

Key Insights
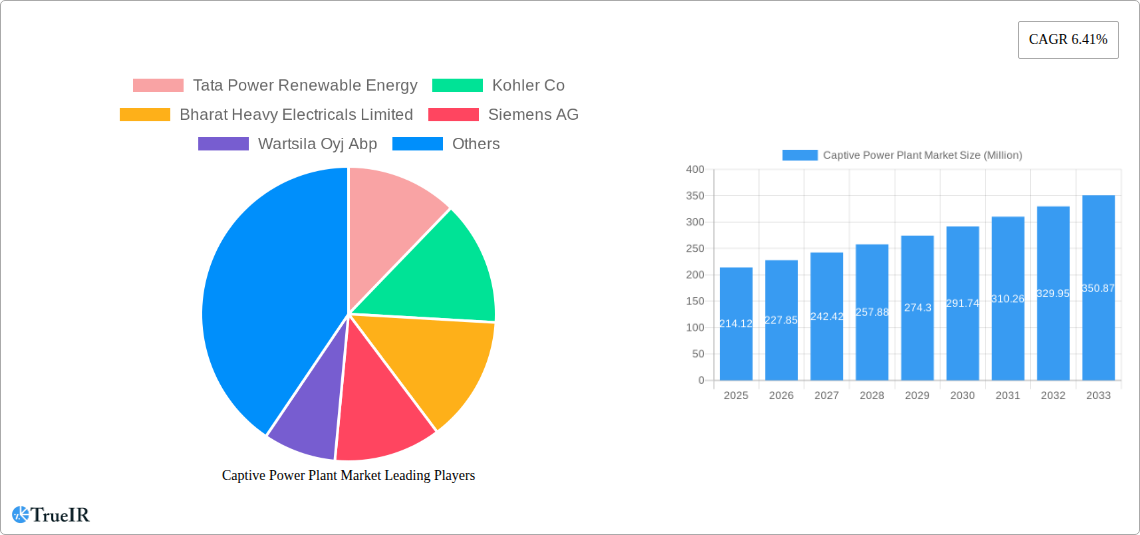
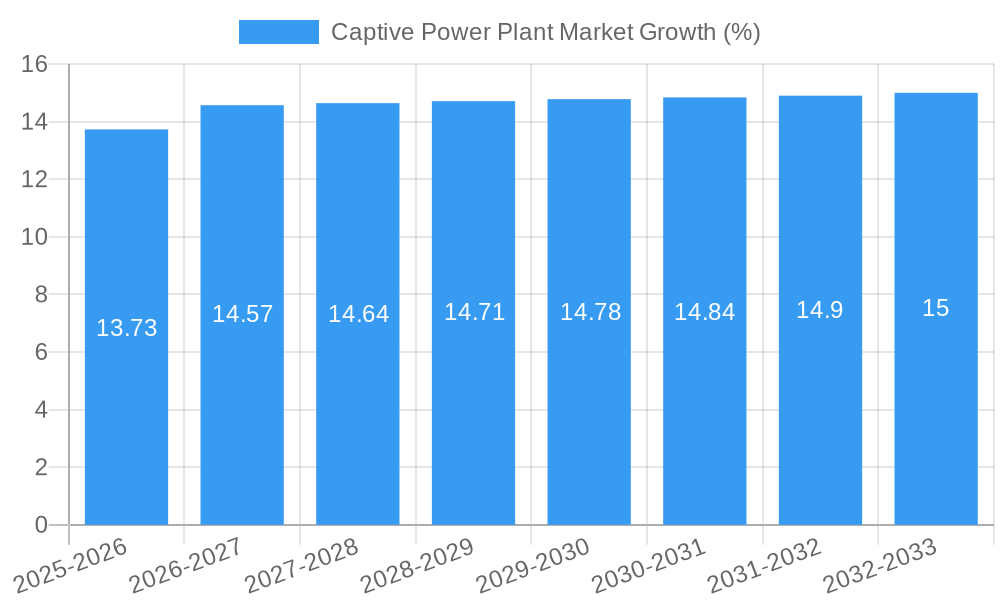
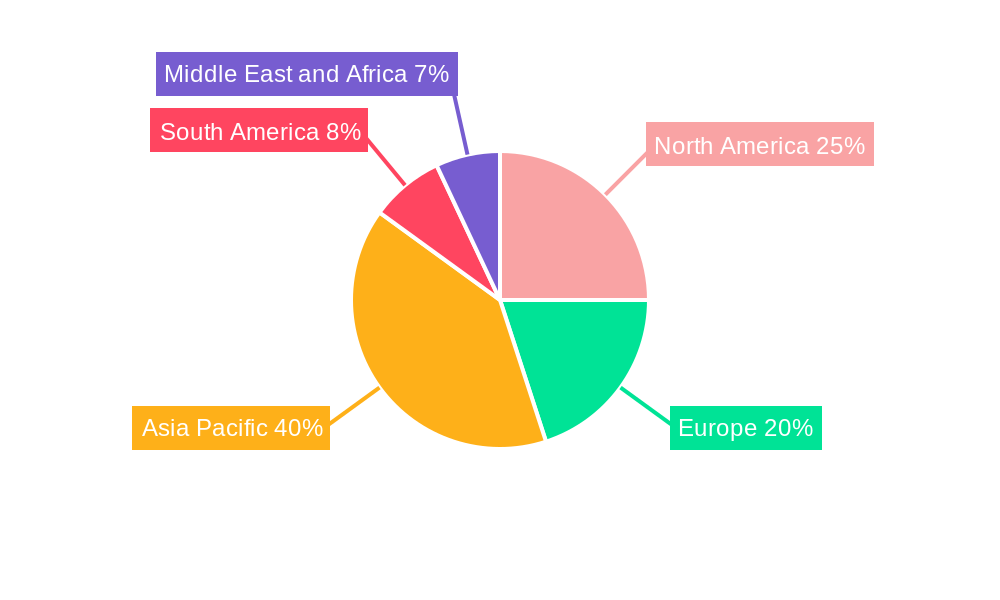
The global captive power plant market, valued at $214.12 million in 2025, is projected to experience robust growth, driven by increasing industrialization and the need for reliable, cost-effective power solutions. A Compound Annual Growth Rate (CAGR) of 6.41% from 2025 to 2033 indicates a significant expansion of this market. Key growth drivers include rising energy demands from sectors like cement, steel, metal & minerals, and petrochemicals, coupled with the desire for greater energy independence and control over power costs. The shift towards renewable energy sources like solar and wind within captive power plants is a prominent trend, driven by sustainability concerns and government incentives. However, the market faces restraints such as high initial investment costs for captive power plant installations, fluctuating fuel prices, and stringent environmental regulations. The segmentation by fuel source reveals a dynamic interplay between traditional fuels (coal, gas, diesel) and the growing adoption of renewable sources. Geographically, regions like Asia Pacific (particularly China and India) and North America are expected to witness substantial growth due to rapid industrial development and a strong emphasis on energy security. The competitive landscape is characterized by a mix of established players like Siemens AG and General Electric Company, alongside emerging renewable energy specialists such as Tata Power Renewable Energy and AMP Solar Group Inc. This competitive environment fosters innovation and drives down costs, further fueling market expansion.
The forecast period (2025-2033) presents lucrative opportunities for companies specializing in engineering, procurement, and construction (EPC) of captive power plants, as well as those providing operation and maintenance services. The increasing adoption of advanced technologies like smart grids and energy storage solutions within captive power plants will further shape the market landscape. Understanding regional regulatory frameworks and aligning with sustainability goals will be critical for success in this evolving market. Market diversification strategies, targeting different industries and fuel sources, are crucial for capturing market share in this competitive and dynamic environment. Long-term contracts with industrial customers, combined with innovative financing models, will further contribute to the growth of the captive power plant market.
Captive Power Plant Market: A Comprehensive Report (2019-2033)
This dynamic report provides a comprehensive analysis of the Captive Power Plant Market, offering invaluable insights for investors, industry professionals, and strategic decision-makers. Leveraging extensive research and data analysis spanning the period from 2019 to 2033 (with a base year of 2025), this report unveils the market's current state, future trajectory, and key growth drivers. The market is projected to reach xx Million by 2033, exhibiting a robust CAGR of xx% during the forecast period (2025-2033).
Captive Power Plant Market Structure & Competitive Landscape
The Captive Power Plant market exhibits a moderately concentrated structure, with several key players holding significant market share. The Herfindahl-Hirschman Index (HHI) for the market in 2024 was estimated at xx, indicating a moderately concentrated market. Innovation within the sector is driven primarily by advancements in renewable energy technologies, coupled with increasing pressure for greater energy efficiency and sustainability. Stringent environmental regulations, particularly concerning carbon emissions, are significantly impacting market dynamics, favoring cleaner fuel sources like renewable energy. Product substitutes, such as grid electricity and energy storage solutions, present ongoing competitive challenges. End-user segmentation is largely driven by industry type, with the Cement, Steel, Metal & Minerals, Petrochemicals, and Other sectors representing the primary consumers.
The market has witnessed a moderate level of M&A activity in recent years. From 2019 to 2024, approximately xx M&A deals were recorded, with a total value estimated at xx Million. These transactions were primarily driven by the need to expand geographical reach, acquire technological capabilities, and consolidate market share.
- Market Concentration: Moderately concentrated, HHI (2024): xx
- Innovation Drivers: Renewable energy technology, energy efficiency
- Regulatory Impacts: Stringent emission regulations favoring renewable energy
- Product Substitutes: Grid electricity, energy storage solutions
- End-User Segmentation: Cement, Steel, Metal & Minerals, Petrochemicals, Others
- M&A Trends: Moderate activity driven by expansion and consolidation; xx deals (2019-2024), xx Million total value.
Captive Power Plant Market Market Trends & Opportunities
The Captive Power Plant market is experiencing significant growth, fueled by increasing industrial energy demand, the rising adoption of renewable energy sources, and government incentives promoting energy independence. The market size is projected to expand from xx Million in 2025 to xx Million by 2033, exhibiting a substantial CAGR of xx%. This growth is underpinned by several key trends, including the shift towards decentralized power generation, advancements in energy storage technologies, and a growing preference for reliable and cost-effective power solutions. Technological shifts towards more efficient and sustainable power generation technologies are driving market growth. Consumer preferences are increasingly favoring renewable energy solutions, particularly solar and wind, due to environmental concerns and cost reductions. Competitive dynamics are shaped by technological advancements, cost optimization strategies, and the emergence of new players in the renewable energy sector. Market penetration rates for renewable-based captive power plants are gradually increasing, expected to reach xx% by 2033.
Dominant Markets & Segments in Captive Power Plant Market
The Indian market currently dominates the Captive Power Plant market in terms of both capacity and growth. This is driven by India's burgeoning industrial sector, its large energy demand, and the government's initiatives to promote renewable energy. Within the industry segments, the Cement, Steel, Metal & Minerals sector constitutes the largest consumer of captive power, followed by the Petrochemicals sector. In terms of fuel sources, the renewable energy segment is experiencing rapid growth, driven by government policies and falling costs of renewable energy technologies.
- Leading Region/Country: India
- Leading Industry Segment: Cement, Steel, Metal & Minerals
- Leading Fuel Source: Coal (currently), followed by increasing adoption of Renewable energy.
Key Growth Drivers:
- Rapid industrialization and increasing energy demand.
- Government incentives and policies promoting renewable energy adoption.
- Falling costs of renewable energy technologies.
- Focus on energy security and reliability.
Captive Power Plant Market Product Analysis
Significant product innovations are focused on enhancing efficiency, reducing emissions, and integrating renewable energy sources. Advancements in gas turbine technology, solar photovoltaic (PV) systems, and energy storage solutions are shaping the competitive landscape. These innovations offer improved reliability, reduced operating costs, and environmental benefits, making them increasingly attractive to end-users. The market fit for these products is strong, particularly in regions with high energy demands and stringent environmental regulations.
Key Drivers, Barriers & Challenges in Captive Power Plant Market
Key Drivers:
- Rising energy demand from industrial sectors.
- Government policies supporting renewable energy integration.
- Technological advancements improving efficiency and reducing costs.
Challenges & Restraints:
- High initial investment costs for new plants.
- Regulatory complexities and bureaucratic hurdles in obtaining permits.
- Potential supply chain disruptions affecting equipment procurement. For example, xx% of critical components were affected by supply chain disruptions in 2023, leading to xx Million in project delays.
- Competition from grid electricity and other energy solutions.
Growth Drivers in the Captive Power Plant Market Market
The market's growth is primarily driven by increasing energy demand from the industrial sector, supportive government policies encouraging renewable energy adoption, and continuous technological advancements resulting in improved efficiency and lower costs.
Challenges Impacting Captive Power Plant Market Growth
Challenges include high initial investment costs, regulatory complexities delaying project approvals, potential supply chain disruptions impacting equipment availability, and competition from alternative energy solutions.
Key Players Shaping the Captive Power Plant Market Market
- Tata Power Renewable Energy
- Kohler Co
- Bharat Heavy Electricals Limited
- Siemens AG
- Wartsila Oyj Abp
- AMP Solar Group Inc
- General Electric Company
Significant Captive Power Plant Market Industry Milestones
- September 2022: Tata Power Renewable Energy (TPREL) announced a collaboration with Viraj Profile to set up a 100 MW captive solar plant, demonstrating the increasing adoption of renewable energy solutions in the steel manufacturing sector.
- June 2022: Cipla Limited's expansion of its captive renewable energy plant highlights the growing trend of pharmaceutical companies investing in sustainable energy solutions. This added capacity demonstrates commitment to reducing carbon footprint and securing long-term energy costs.
Future Outlook for Captive Power Plant Market Market
The future of the Captive Power Plant market is bright, driven by sustained industrial growth, increasing awareness of environmental sustainability, and government support for renewable energy. Strategic opportunities exist for companies that can offer innovative, cost-effective, and sustainable power solutions. The market is poised for significant expansion, with considerable potential for growth in emerging economies and regions with high energy demand.
Captive Power Plant Market Segmentation
-
1. Fuel Source
- 1.1. Coal
- 1.2. Gas
- 1.3. Diesel
- 1.4. Renewable
- 1.5. Other Fuel Sources
-
2. Industry
- 2.1. Cement
- 2.2. Steel
- 2.3. Metal & Minerals
- 2.4. Petrochemicals
- 2.5. Others
Captive Power Plant Market Segmentation By Geography
-
1. North America
- 1.1. United States
- 1.2. Canada
- 1.3. Rest of North America
-
2. Europe
- 2.1. Germany
- 2.2. France
- 2.3. United Kingdom
- 2.4. Rest of Europe
-
3. Asia Pacific
- 3.1. China
- 3.2. India
- 3.3. Japan
- 3.4. South Korea
- 3.5. Rest of Asia Pacific
-
4. South America
- 4.1. Brazil
- 4.2. Argentina
- 4.3. Rest of South America
-
5. Middle East and Africa
- 5.1. Saudi Arabia
- 5.2. United Arab Emirates
- 5.3. South Africa
- 5.4. Rest of Middle East and Africa
Captive Power Plant Market REPORT HIGHLIGHTS
| Aspects | Details |
|---|---|
| Study Period | 2019-2033 |
| Base Year | 2024 |
| Estimated Year | 2025 |
| Forecast Period | 2025-2033 |
| Historical Period | 2019-2024 |
| Growth Rate | CAGR of 6.41% from 2019-2033 |
| Segmentation |
|
Table of Contents
- 1. Introduction
- 1.1. Research Scope
- 1.2. Market Segmentation
- 1.3. Research Methodology
- 1.4. Definitions and Assumptions
- 2. Executive Summary
- 2.1. Introduction
- 3. Market Dynamics
- 3.1. Introduction
- 3.2. Market Drivers
- 3.2.1. Increasing Power Demand across Industrial Sector4.; Remote Location of Several Industries and the Unreliability of the Power Supply
- 3.3. Market Restrains
- 3.3.1. High Capital and Operational Expenditures
- 3.4. Market Trends
- 3.4.1. Steel Industry to Have Significant Share in the Market
- 4. Market Factor Analysis
- 4.1. Porters Five Forces
- 4.2. Supply/Value Chain
- 4.3. PESTEL analysis
- 4.4. Market Entropy
- 4.5. Patent/Trademark Analysis
- 5. Global Captive Power Plant Market Analysis, Insights and Forecast, 2019-2031
- 5.1. Market Analysis, Insights and Forecast - by Fuel Source
- 5.1.1. Coal
- 5.1.2. Gas
- 5.1.3. Diesel
- 5.1.4. Renewable
- 5.1.5. Other Fuel Sources
- 5.2. Market Analysis, Insights and Forecast - by Industry
- 5.2.1. Cement
- 5.2.2. Steel
- 5.2.3. Metal & Minerals
- 5.2.4. Petrochemicals
- 5.2.5. Others
- 5.3. Market Analysis, Insights and Forecast - by Region
- 5.3.1. North America
- 5.3.2. Europe
- 5.3.3. Asia Pacific
- 5.3.4. South America
- 5.3.5. Middle East and Africa
- 5.1. Market Analysis, Insights and Forecast - by Fuel Source
- 6. North America Captive Power Plant Market Analysis, Insights and Forecast, 2019-2031
- 6.1. Market Analysis, Insights and Forecast - by Fuel Source
- 6.1.1. Coal
- 6.1.2. Gas
- 6.1.3. Diesel
- 6.1.4. Renewable
- 6.1.5. Other Fuel Sources
- 6.2. Market Analysis, Insights and Forecast - by Industry
- 6.2.1. Cement
- 6.2.2. Steel
- 6.2.3. Metal & Minerals
- 6.2.4. Petrochemicals
- 6.2.5. Others
- 6.1. Market Analysis, Insights and Forecast - by Fuel Source
- 7. Europe Captive Power Plant Market Analysis, Insights and Forecast, 2019-2031
- 7.1. Market Analysis, Insights and Forecast - by Fuel Source
- 7.1.1. Coal
- 7.1.2. Gas
- 7.1.3. Diesel
- 7.1.4. Renewable
- 7.1.5. Other Fuel Sources
- 7.2. Market Analysis, Insights and Forecast - by Industry
- 7.2.1. Cement
- 7.2.2. Steel
- 7.2.3. Metal & Minerals
- 7.2.4. Petrochemicals
- 7.2.5. Others
- 7.1. Market Analysis, Insights and Forecast - by Fuel Source
- 8. Asia Pacific Captive Power Plant Market Analysis, Insights and Forecast, 2019-2031
- 8.1. Market Analysis, Insights and Forecast - by Fuel Source
- 8.1.1. Coal
- 8.1.2. Gas
- 8.1.3. Diesel
- 8.1.4. Renewable
- 8.1.5. Other Fuel Sources
- 8.2. Market Analysis, Insights and Forecast - by Industry
- 8.2.1. Cement
- 8.2.2. Steel
- 8.2.3. Metal & Minerals
- 8.2.4. Petrochemicals
- 8.2.5. Others
- 8.1. Market Analysis, Insights and Forecast - by Fuel Source
- 9. South America Captive Power Plant Market Analysis, Insights and Forecast, 2019-2031
- 9.1. Market Analysis, Insights and Forecast - by Fuel Source
- 9.1.1. Coal
- 9.1.2. Gas
- 9.1.3. Diesel
- 9.1.4. Renewable
- 9.1.5. Other Fuel Sources
- 9.2. Market Analysis, Insights and Forecast - by Industry
- 9.2.1. Cement
- 9.2.2. Steel
- 9.2.3. Metal & Minerals
- 9.2.4. Petrochemicals
- 9.2.5. Others
- 9.1. Market Analysis, Insights and Forecast - by Fuel Source
- 10. Middle East and Africa Captive Power Plant Market Analysis, Insights and Forecast, 2019-2031
- 10.1. Market Analysis, Insights and Forecast - by Fuel Source
- 10.1.1. Coal
- 10.1.2. Gas
- 10.1.3. Diesel
- 10.1.4. Renewable
- 10.1.5. Other Fuel Sources
- 10.2. Market Analysis, Insights and Forecast - by Industry
- 10.2.1. Cement
- 10.2.2. Steel
- 10.2.3. Metal & Minerals
- 10.2.4. Petrochemicals
- 10.2.5. Others
- 10.1. Market Analysis, Insights and Forecast - by Fuel Source
- 11. North America Captive Power Plant Market Analysis, Insights and Forecast, 2019-2031
- 11.1. Market Analysis, Insights and Forecast - By Country/Sub-region
- 11.1.1 United States
- 11.1.2 Canada
- 11.1.3 Rest of North America
- 12. Europe Captive Power Plant Market Analysis, Insights and Forecast, 2019-2031
- 12.1. Market Analysis, Insights and Forecast - By Country/Sub-region
- 12.1.1 Germany
- 12.1.2 France
- 12.1.3 United Kingdom
- 12.1.4 Rest of Europe
- 13. Asia Pacific Captive Power Plant Market Analysis, Insights and Forecast, 2019-2031
- 13.1. Market Analysis, Insights and Forecast - By Country/Sub-region
- 13.1.1 China
- 13.1.2 India
- 13.1.3 Japan
- 13.1.4 South Korea
- 13.1.5 Rest of Asia Pacific
- 14. South America Captive Power Plant Market Analysis, Insights and Forecast, 2019-2031
- 14.1. Market Analysis, Insights and Forecast - By Country/Sub-region
- 14.1.1 Brazil
- 14.1.2 Argentina
- 14.1.3 Rest of South America
- 15. Middle East and Africa Captive Power Plant Market Analysis, Insights and Forecast, 2019-2031
- 15.1. Market Analysis, Insights and Forecast - By Country/Sub-region
- 15.1.1 Saudi Arabia
- 15.1.2 United Arab Emirates
- 15.1.3 South Africa
- 15.1.4 Rest of Middle East and Africa
- 16. Competitive Analysis
- 16.1. Global Market Share Analysis 2024
- 16.2. Company Profiles
- 16.2.1 Tata Power Renewable Energy
- 16.2.1.1. Overview
- 16.2.1.2. Products
- 16.2.1.3. SWOT Analysis
- 16.2.1.4. Recent Developments
- 16.2.1.5. Financials (Based on Availability)
- 16.2.2 Kohler Co
- 16.2.2.1. Overview
- 16.2.2.2. Products
- 16.2.2.3. SWOT Analysis
- 16.2.2.4. Recent Developments
- 16.2.2.5. Financials (Based on Availability)
- 16.2.3 Bharat Heavy Electricals Limited
- 16.2.3.1. Overview
- 16.2.3.2. Products
- 16.2.3.3. SWOT Analysis
- 16.2.3.4. Recent Developments
- 16.2.3.5. Financials (Based on Availability)
- 16.2.4 Siemens AG
- 16.2.4.1. Overview
- 16.2.4.2. Products
- 16.2.4.3. SWOT Analysis
- 16.2.4.4. Recent Developments
- 16.2.4.5. Financials (Based on Availability)
- 16.2.5 Wartsila Oyj Abp
- 16.2.5.1. Overview
- 16.2.5.2. Products
- 16.2.5.3. SWOT Analysis
- 16.2.5.4. Recent Developments
- 16.2.5.5. Financials (Based on Availability)
- 16.2.6 AMP Solar Group Inc
- 16.2.6.1. Overview
- 16.2.6.2. Products
- 16.2.6.3. SWOT Analysis
- 16.2.6.4. Recent Developments
- 16.2.6.5. Financials (Based on Availability)
- 16.2.7 General Electric Company
- 16.2.7.1. Overview
- 16.2.7.2. Products
- 16.2.7.3. SWOT Analysis
- 16.2.7.4. Recent Developments
- 16.2.7.5. Financials (Based on Availability)
- 16.2.1 Tata Power Renewable Energy
List of Figures
- Figure 1: Global Captive Power Plant Market Revenue Breakdown (Million, %) by Region 2024 & 2032
- Figure 2: Global Captive Power Plant Market Volume Breakdown (K Unit, %) by Region 2024 & 2032
- Figure 3: North America Captive Power Plant Market Revenue (Million), by Country 2024 & 2032
- Figure 4: North America Captive Power Plant Market Volume (K Unit), by Country 2024 & 2032
- Figure 5: North America Captive Power Plant Market Revenue Share (%), by Country 2024 & 2032
- Figure 6: North America Captive Power Plant Market Volume Share (%), by Country 2024 & 2032
- Figure 7: Europe Captive Power Plant Market Revenue (Million), by Country 2024 & 2032
- Figure 8: Europe Captive Power Plant Market Volume (K Unit), by Country 2024 & 2032
- Figure 9: Europe Captive Power Plant Market Revenue Share (%), by Country 2024 & 2032
- Figure 10: Europe Captive Power Plant Market Volume Share (%), by Country 2024 & 2032
- Figure 11: Asia Pacific Captive Power Plant Market Revenue (Million), by Country 2024 & 2032
- Figure 12: Asia Pacific Captive Power Plant Market Volume (K Unit), by Country 2024 & 2032
- Figure 13: Asia Pacific Captive Power Plant Market Revenue Share (%), by Country 2024 & 2032
- Figure 14: Asia Pacific Captive Power Plant Market Volume Share (%), by Country 2024 & 2032
- Figure 15: South America Captive Power Plant Market Revenue (Million), by Country 2024 & 2032
- Figure 16: South America Captive Power Plant Market Volume (K Unit), by Country 2024 & 2032
- Figure 17: South America Captive Power Plant Market Revenue Share (%), by Country 2024 & 2032
- Figure 18: South America Captive Power Plant Market Volume Share (%), by Country 2024 & 2032
- Figure 19: Middle East and Africa Captive Power Plant Market Revenue (Million), by Country 2024 & 2032
- Figure 20: Middle East and Africa Captive Power Plant Market Volume (K Unit), by Country 2024 & 2032
- Figure 21: Middle East and Africa Captive Power Plant Market Revenue Share (%), by Country 2024 & 2032
- Figure 22: Middle East and Africa Captive Power Plant Market Volume Share (%), by Country 2024 & 2032
- Figure 23: North America Captive Power Plant Market Revenue (Million), by Fuel Source 2024 & 2032
- Figure 24: North America Captive Power Plant Market Volume (K Unit), by Fuel Source 2024 & 2032
- Figure 25: North America Captive Power Plant Market Revenue Share (%), by Fuel Source 2024 & 2032
- Figure 26: North America Captive Power Plant Market Volume Share (%), by Fuel Source 2024 & 2032
- Figure 27: North America Captive Power Plant Market Revenue (Million), by Industry 2024 & 2032
- Figure 28: North America Captive Power Plant Market Volume (K Unit), by Industry 2024 & 2032
- Figure 29: North America Captive Power Plant Market Revenue Share (%), by Industry 2024 & 2032
- Figure 30: North America Captive Power Plant Market Volume Share (%), by Industry 2024 & 2032
- Figure 31: North America Captive Power Plant Market Revenue (Million), by Country 2024 & 2032
- Figure 32: North America Captive Power Plant Market Volume (K Unit), by Country 2024 & 2032
- Figure 33: North America Captive Power Plant Market Revenue Share (%), by Country 2024 & 2032
- Figure 34: North America Captive Power Plant Market Volume Share (%), by Country 2024 & 2032
- Figure 35: Europe Captive Power Plant Market Revenue (Million), by Fuel Source 2024 & 2032
- Figure 36: Europe Captive Power Plant Market Volume (K Unit), by Fuel Source 2024 & 2032
- Figure 37: Europe Captive Power Plant Market Revenue Share (%), by Fuel Source 2024 & 2032
- Figure 38: Europe Captive Power Plant Market Volume Share (%), by Fuel Source 2024 & 2032
- Figure 39: Europe Captive Power Plant Market Revenue (Million), by Industry 2024 & 2032
- Figure 40: Europe Captive Power Plant Market Volume (K Unit), by Industry 2024 & 2032
- Figure 41: Europe Captive Power Plant Market Revenue Share (%), by Industry 2024 & 2032
- Figure 42: Europe Captive Power Plant Market Volume Share (%), by Industry 2024 & 2032
- Figure 43: Europe Captive Power Plant Market Revenue (Million), by Country 2024 & 2032
- Figure 44: Europe Captive Power Plant Market Volume (K Unit), by Country 2024 & 2032
- Figure 45: Europe Captive Power Plant Market Revenue Share (%), by Country 2024 & 2032
- Figure 46: Europe Captive Power Plant Market Volume Share (%), by Country 2024 & 2032
- Figure 47: Asia Pacific Captive Power Plant Market Revenue (Million), by Fuel Source 2024 & 2032
- Figure 48: Asia Pacific Captive Power Plant Market Volume (K Unit), by Fuel Source 2024 & 2032
- Figure 49: Asia Pacific Captive Power Plant Market Revenue Share (%), by Fuel Source 2024 & 2032
- Figure 50: Asia Pacific Captive Power Plant Market Volume Share (%), by Fuel Source 2024 & 2032
- Figure 51: Asia Pacific Captive Power Plant Market Revenue (Million), by Industry 2024 & 2032
- Figure 52: Asia Pacific Captive Power Plant Market Volume (K Unit), by Industry 2024 & 2032
- Figure 53: Asia Pacific Captive Power Plant Market Revenue Share (%), by Industry 2024 & 2032
- Figure 54: Asia Pacific Captive Power Plant Market Volume Share (%), by Industry 2024 & 2032
- Figure 55: Asia Pacific Captive Power Plant Market Revenue (Million), by Country 2024 & 2032
- Figure 56: Asia Pacific Captive Power Plant Market Volume (K Unit), by Country 2024 & 2032
- Figure 57: Asia Pacific Captive Power Plant Market Revenue Share (%), by Country 2024 & 2032
- Figure 58: Asia Pacific Captive Power Plant Market Volume Share (%), by Country 2024 & 2032
- Figure 59: South America Captive Power Plant Market Revenue (Million), by Fuel Source 2024 & 2032
- Figure 60: South America Captive Power Plant Market Volume (K Unit), by Fuel Source 2024 & 2032
- Figure 61: South America Captive Power Plant Market Revenue Share (%), by Fuel Source 2024 & 2032
- Figure 62: South America Captive Power Plant Market Volume Share (%), by Fuel Source 2024 & 2032
- Figure 63: South America Captive Power Plant Market Revenue (Million), by Industry 2024 & 2032
- Figure 64: South America Captive Power Plant Market Volume (K Unit), by Industry 2024 & 2032
- Figure 65: South America Captive Power Plant Market Revenue Share (%), by Industry 2024 & 2032
- Figure 66: South America Captive Power Plant Market Volume Share (%), by Industry 2024 & 2032
- Figure 67: South America Captive Power Plant Market Revenue (Million), by Country 2024 & 2032
- Figure 68: South America Captive Power Plant Market Volume (K Unit), by Country 2024 & 2032
- Figure 69: South America Captive Power Plant Market Revenue Share (%), by Country 2024 & 2032
- Figure 70: South America Captive Power Plant Market Volume Share (%), by Country 2024 & 2032
- Figure 71: Middle East and Africa Captive Power Plant Market Revenue (Million), by Fuel Source 2024 & 2032
- Figure 72: Middle East and Africa Captive Power Plant Market Volume (K Unit), by Fuel Source 2024 & 2032
- Figure 73: Middle East and Africa Captive Power Plant Market Revenue Share (%), by Fuel Source 2024 & 2032
- Figure 74: Middle East and Africa Captive Power Plant Market Volume Share (%), by Fuel Source 2024 & 2032
- Figure 75: Middle East and Africa Captive Power Plant Market Revenue (Million), by Industry 2024 & 2032
- Figure 76: Middle East and Africa Captive Power Plant Market Volume (K Unit), by Industry 2024 & 2032
- Figure 77: Middle East and Africa Captive Power Plant Market Revenue Share (%), by Industry 2024 & 2032
- Figure 78: Middle East and Africa Captive Power Plant Market Volume Share (%), by Industry 2024 & 2032
- Figure 79: Middle East and Africa Captive Power Plant Market Revenue (Million), by Country 2024 & 2032
- Figure 80: Middle East and Africa Captive Power Plant Market Volume (K Unit), by Country 2024 & 2032
- Figure 81: Middle East and Africa Captive Power Plant Market Revenue Share (%), by Country 2024 & 2032
- Figure 82: Middle East and Africa Captive Power Plant Market Volume Share (%), by Country 2024 & 2032
List of Tables
- Table 1: Global Captive Power Plant Market Revenue Million Forecast, by Region 2019 & 2032
- Table 2: Global Captive Power Plant Market Volume K Unit Forecast, by Region 2019 & 2032
- Table 3: Global Captive Power Plant Market Revenue Million Forecast, by Fuel Source 2019 & 2032
- Table 4: Global Captive Power Plant Market Volume K Unit Forecast, by Fuel Source 2019 & 2032
- Table 5: Global Captive Power Plant Market Revenue Million Forecast, by Industry 2019 & 2032
- Table 6: Global Captive Power Plant Market Volume K Unit Forecast, by Industry 2019 & 2032
- Table 7: Global Captive Power Plant Market Revenue Million Forecast, by Region 2019 & 2032
- Table 8: Global Captive Power Plant Market Volume K Unit Forecast, by Region 2019 & 2032
- Table 9: Global Captive Power Plant Market Revenue Million Forecast, by Country 2019 & 2032
- Table 10: Global Captive Power Plant Market Volume K Unit Forecast, by Country 2019 & 2032
- Table 11: United States Captive Power Plant Market Revenue (Million) Forecast, by Application 2019 & 2032
- Table 12: United States Captive Power Plant Market Volume (K Unit) Forecast, by Application 2019 & 2032
- Table 13: Canada Captive Power Plant Market Revenue (Million) Forecast, by Application 2019 & 2032
- Table 14: Canada Captive Power Plant Market Volume (K Unit) Forecast, by Application 2019 & 2032
- Table 15: Rest of North America Captive Power Plant Market Revenue (Million) Forecast, by Application 2019 & 2032
- Table 16: Rest of North America Captive Power Plant Market Volume (K Unit) Forecast, by Application 2019 & 2032
- Table 17: Global Captive Power Plant Market Revenue Million Forecast, by Country 2019 & 2032
- Table 18: Global Captive Power Plant Market Volume K Unit Forecast, by Country 2019 & 2032
- Table 19: Germany Captive Power Plant Market Revenue (Million) Forecast, by Application 2019 & 2032
- Table 20: Germany Captive Power Plant Market Volume (K Unit) Forecast, by Application 2019 & 2032
- Table 21: France Captive Power Plant Market Revenue (Million) Forecast, by Application 2019 & 2032
- Table 22: France Captive Power Plant Market Volume (K Unit) Forecast, by Application 2019 & 2032
- Table 23: United Kingdom Captive Power Plant Market Revenue (Million) Forecast, by Application 2019 & 2032
- Table 24: United Kingdom Captive Power Plant Market Volume (K Unit) Forecast, by Application 2019 & 2032
- Table 25: Rest of Europe Captive Power Plant Market Revenue (Million) Forecast, by Application 2019 & 2032
- Table 26: Rest of Europe Captive Power Plant Market Volume (K Unit) Forecast, by Application 2019 & 2032
- Table 27: Global Captive Power Plant Market Revenue Million Forecast, by Country 2019 & 2032
- Table 28: Global Captive Power Plant Market Volume K Unit Forecast, by Country 2019 & 2032
- Table 29: China Captive Power Plant Market Revenue (Million) Forecast, by Application 2019 & 2032
- Table 30: China Captive Power Plant Market Volume (K Unit) Forecast, by Application 2019 & 2032
- Table 31: India Captive Power Plant Market Revenue (Million) Forecast, by Application 2019 & 2032
- Table 32: India Captive Power Plant Market Volume (K Unit) Forecast, by Application 2019 & 2032
- Table 33: Japan Captive Power Plant Market Revenue (Million) Forecast, by Application 2019 & 2032
- Table 34: Japan Captive Power Plant Market Volume (K Unit) Forecast, by Application 2019 & 2032
- Table 35: South Korea Captive Power Plant Market Revenue (Million) Forecast, by Application 2019 & 2032
- Table 36: South Korea Captive Power Plant Market Volume (K Unit) Forecast, by Application 2019 & 2032
- Table 37: Rest of Asia Pacific Captive Power Plant Market Revenue (Million) Forecast, by Application 2019 & 2032
- Table 38: Rest of Asia Pacific Captive Power Plant Market Volume (K Unit) Forecast, by Application 2019 & 2032
- Table 39: Global Captive Power Plant Market Revenue Million Forecast, by Country 2019 & 2032
- Table 40: Global Captive Power Plant Market Volume K Unit Forecast, by Country 2019 & 2032
- Table 41: Brazil Captive Power Plant Market Revenue (Million) Forecast, by Application 2019 & 2032
- Table 42: Brazil Captive Power Plant Market Volume (K Unit) Forecast, by Application 2019 & 2032
- Table 43: Argentina Captive Power Plant Market Revenue (Million) Forecast, by Application 2019 & 2032
- Table 44: Argentina Captive Power Plant Market Volume (K Unit) Forecast, by Application 2019 & 2032
- Table 45: Rest of South America Captive Power Plant Market Revenue (Million) Forecast, by Application 2019 & 2032
- Table 46: Rest of South America Captive Power Plant Market Volume (K Unit) Forecast, by Application 2019 & 2032
- Table 47: Global Captive Power Plant Market Revenue Million Forecast, by Country 2019 & 2032
- Table 48: Global Captive Power Plant Market Volume K Unit Forecast, by Country 2019 & 2032
- Table 49: Saudi Arabia Captive Power Plant Market Revenue (Million) Forecast, by Application 2019 & 2032
- Table 50: Saudi Arabia Captive Power Plant Market Volume (K Unit) Forecast, by Application 2019 & 2032
- Table 51: United Arab Emirates Captive Power Plant Market Revenue (Million) Forecast, by Application 2019 & 2032
- Table 52: United Arab Emirates Captive Power Plant Market Volume (K Unit) Forecast, by Application 2019 & 2032
- Table 53: South Africa Captive Power Plant Market Revenue (Million) Forecast, by Application 2019 & 2032
- Table 54: South Africa Captive Power Plant Market Volume (K Unit) Forecast, by Application 2019 & 2032
- Table 55: Rest of Middle East and Africa Captive Power Plant Market Revenue (Million) Forecast, by Application 2019 & 2032
- Table 56: Rest of Middle East and Africa Captive Power Plant Market Volume (K Unit) Forecast, by Application 2019 & 2032
- Table 57: Global Captive Power Plant Market Revenue Million Forecast, by Fuel Source 2019 & 2032
- Table 58: Global Captive Power Plant Market Volume K Unit Forecast, by Fuel Source 2019 & 2032
- Table 59: Global Captive Power Plant Market Revenue Million Forecast, by Industry 2019 & 2032
- Table 60: Global Captive Power Plant Market Volume K Unit Forecast, by Industry 2019 & 2032
- Table 61: Global Captive Power Plant Market Revenue Million Forecast, by Country 2019 & 2032
- Table 62: Global Captive Power Plant Market Volume K Unit Forecast, by Country 2019 & 2032
- Table 63: United States Captive Power Plant Market Revenue (Million) Forecast, by Application 2019 & 2032
- Table 64: United States Captive Power Plant Market Volume (K Unit) Forecast, by Application 2019 & 2032
- Table 65: Canada Captive Power Plant Market Revenue (Million) Forecast, by Application 2019 & 2032
- Table 66: Canada Captive Power Plant Market Volume (K Unit) Forecast, by Application 2019 & 2032
- Table 67: Rest of North America Captive Power Plant Market Revenue (Million) Forecast, by Application 2019 & 2032
- Table 68: Rest of North America Captive Power Plant Market Volume (K Unit) Forecast, by Application 2019 & 2032
- Table 69: Global Captive Power Plant Market Revenue Million Forecast, by Fuel Source 2019 & 2032
- Table 70: Global Captive Power Plant Market Volume K Unit Forecast, by Fuel Source 2019 & 2032
- Table 71: Global Captive Power Plant Market Revenue Million Forecast, by Industry 2019 & 2032
- Table 72: Global Captive Power Plant Market Volume K Unit Forecast, by Industry 2019 & 2032
- Table 73: Global Captive Power Plant Market Revenue Million Forecast, by Country 2019 & 2032
- Table 74: Global Captive Power Plant Market Volume K Unit Forecast, by Country 2019 & 2032
- Table 75: Germany Captive Power Plant Market Revenue (Million) Forecast, by Application 2019 & 2032
- Table 76: Germany Captive Power Plant Market Volume (K Unit) Forecast, by Application 2019 & 2032
- Table 77: France Captive Power Plant Market Revenue (Million) Forecast, by Application 2019 & 2032
- Table 78: France Captive Power Plant Market Volume (K Unit) Forecast, by Application 2019 & 2032
- Table 79: United Kingdom Captive Power Plant Market Revenue (Million) Forecast, by Application 2019 & 2032
- Table 80: United Kingdom Captive Power Plant Market Volume (K Unit) Forecast, by Application 2019 & 2032
- Table 81: Rest of Europe Captive Power Plant Market Revenue (Million) Forecast, by Application 2019 & 2032
- Table 82: Rest of Europe Captive Power Plant Market Volume (K Unit) Forecast, by Application 2019 & 2032
- Table 83: Global Captive Power Plant Market Revenue Million Forecast, by Fuel Source 2019 & 2032
- Table 84: Global Captive Power Plant Market Volume K Unit Forecast, by Fuel Source 2019 & 2032
- Table 85: Global Captive Power Plant Market Revenue Million Forecast, by Industry 2019 & 2032
- Table 86: Global Captive Power Plant Market Volume K Unit Forecast, by Industry 2019 & 2032
- Table 87: Global Captive Power Plant Market Revenue Million Forecast, by Country 2019 & 2032
- Table 88: Global Captive Power Plant Market Volume K Unit Forecast, by Country 2019 & 2032
- Table 89: China Captive Power Plant Market Revenue (Million) Forecast, by Application 2019 & 2032
- Table 90: China Captive Power Plant Market Volume (K Unit) Forecast, by Application 2019 & 2032
- Table 91: India Captive Power Plant Market Revenue (Million) Forecast, by Application 2019 & 2032
- Table 92: India Captive Power Plant Market Volume (K Unit) Forecast, by Application 2019 & 2032
- Table 93: Japan Captive Power Plant Market Revenue (Million) Forecast, by Application 2019 & 2032
- Table 94: Japan Captive Power Plant Market Volume (K Unit) Forecast, by Application 2019 & 2032
- Table 95: South Korea Captive Power Plant Market Revenue (Million) Forecast, by Application 2019 & 2032
- Table 96: South Korea Captive Power Plant Market Volume (K Unit) Forecast, by Application 2019 & 2032
- Table 97: Rest of Asia Pacific Captive Power Plant Market Revenue (Million) Forecast, by Application 2019 & 2032
- Table 98: Rest of Asia Pacific Captive Power Plant Market Volume (K Unit) Forecast, by Application 2019 & 2032
- Table 99: Global Captive Power Plant Market Revenue Million Forecast, by Fuel Source 2019 & 2032
- Table 100: Global Captive Power Plant Market Volume K Unit Forecast, by Fuel Source 2019 & 2032
- Table 101: Global Captive Power Plant Market Revenue Million Forecast, by Industry 2019 & 2032
- Table 102: Global Captive Power Plant Market Volume K Unit Forecast, by Industry 2019 & 2032
- Table 103: Global Captive Power Plant Market Revenue Million Forecast, by Country 2019 & 2032
- Table 104: Global Captive Power Plant Market Volume K Unit Forecast, by Country 2019 & 2032
- Table 105: Brazil Captive Power Plant Market Revenue (Million) Forecast, by Application 2019 & 2032
- Table 106: Brazil Captive Power Plant Market Volume (K Unit) Forecast, by Application 2019 & 2032
- Table 107: Argentina Captive Power Plant Market Revenue (Million) Forecast, by Application 2019 & 2032
- Table 108: Argentina Captive Power Plant Market Volume (K Unit) Forecast, by Application 2019 & 2032
- Table 109: Rest of South America Captive Power Plant Market Revenue (Million) Forecast, by Application 2019 & 2032
- Table 110: Rest of South America Captive Power Plant Market Volume (K Unit) Forecast, by Application 2019 & 2032
- Table 111: Global Captive Power Plant Market Revenue Million Forecast, by Fuel Source 2019 & 2032
- Table 112: Global Captive Power Plant Market Volume K Unit Forecast, by Fuel Source 2019 & 2032
- Table 113: Global Captive Power Plant Market Revenue Million Forecast, by Industry 2019 & 2032
- Table 114: Global Captive Power Plant Market Volume K Unit Forecast, by Industry 2019 & 2032
- Table 115: Global Captive Power Plant Market Revenue Million Forecast, by Country 2019 & 2032
- Table 116: Global Captive Power Plant Market Volume K Unit Forecast, by Country 2019 & 2032
- Table 117: Saudi Arabia Captive Power Plant Market Revenue (Million) Forecast, by Application 2019 & 2032
- Table 118: Saudi Arabia Captive Power Plant Market Volume (K Unit) Forecast, by Application 2019 & 2032
- Table 119: United Arab Emirates Captive Power Plant Market Revenue (Million) Forecast, by Application 2019 & 2032
- Table 120: United Arab Emirates Captive Power Plant Market Volume (K Unit) Forecast, by Application 2019 & 2032
- Table 121: South Africa Captive Power Plant Market Revenue (Million) Forecast, by Application 2019 & 2032
- Table 122: South Africa Captive Power Plant Market Volume (K Unit) Forecast, by Application 2019 & 2032
- Table 123: Rest of Middle East and Africa Captive Power Plant Market Revenue (Million) Forecast, by Application 2019 & 2032
- Table 124: Rest of Middle East and Africa Captive Power Plant Market Volume (K Unit) Forecast, by Application 2019 & 2032
Frequently Asked Questions
1. What is the projected Compound Annual Growth Rate (CAGR) of the Captive Power Plant Market?
The projected CAGR is approximately 6.41%.
2. Which companies are prominent players in the Captive Power Plant Market?
Key companies in the market include Tata Power Renewable Energy, Kohler Co, Bharat Heavy Electricals Limited, Siemens AG, Wartsila Oyj Abp, AMP Solar Group Inc, General Electric Company.
3. What are the main segments of the Captive Power Plant Market?
The market segments include Fuel Source, Industry.
4. Can you provide details about the market size?
The market size is estimated to be USD 214.12 Million as of 2022.
5. What are some drivers contributing to market growth?
Increasing Power Demand across Industrial Sector4.; Remote Location of Several Industries and the Unreliability of the Power Supply.
6. What are the notable trends driving market growth?
Steel Industry to Have Significant Share in the Market.
7. Are there any restraints impacting market growth?
High Capital and Operational Expenditures.
8. Can you provide examples of recent developments in the market?
September 2022: Tata Power Renewable Energy (TPREL) announced a collaboration with Viraj Profile, a stainless steel manufacturer, to set up a 100 MW captive solar plant. The company will develop the Nandgaon plant at its Nasik site, and it will power the Tarapur Plant of Viraj Profile.
9. What pricing options are available for accessing the report?
Pricing options include single-user, multi-user, and enterprise licenses priced at USD 4750, USD 5250, and USD 8750 respectively.
10. Is the market size provided in terms of value or volume?
The market size is provided in terms of value, measured in Million and volume, measured in K Unit.
11. Are there any specific market keywords associated with the report?
Yes, the market keyword associated with the report is "Captive Power Plant Market," which aids in identifying and referencing the specific market segment covered.
12. How do I determine which pricing option suits my needs best?
The pricing options vary based on user requirements and access needs. Individual users may opt for single-user licenses, while businesses requiring broader access may choose multi-user or enterprise licenses for cost-effective access to the report.
13. Are there any additional resources or data provided in the Captive Power Plant Market report?
While the report offers comprehensive insights, it's advisable to review the specific contents or supplementary materials provided to ascertain if additional resources or data are available.
14. How can I stay updated on further developments or reports in the Captive Power Plant Market?
To stay informed about further developments, trends, and reports in the Captive Power Plant Market, consider subscribing to industry newsletters, following relevant companies and organizations, or regularly checking reputable industry news sources and publications.
Methodology
Step 1 - Identification of Relevant Samples Size from Population Database


Step 2 - Approaches for Defining Global Market Size (Value, Volume* & Price*)

Note*: In applicable scenarios
Step 3 - Data Sources
Primary Research
- Web Analytics
- Survey Reports
- Research Institute
- Latest Research Reports
- Opinion Leaders
Secondary Research
- Annual Reports
- White Paper
- Latest Press Release
- Industry Association
- Paid Database
- Investor Presentations

Step 4 - Data Triangulation
Involves using different sources of information in order to increase the validity of a study
These sources are likely to be stakeholders in a program - participants, other researchers, program staff, other community members, and so on.
Then we put all data in single framework & apply various statistical tools to find out the dynamic on the market.
During the analysis stage, feedback from the stakeholder groups would be compared to determine areas of agreement as well as areas of divergence
