

Key Insights
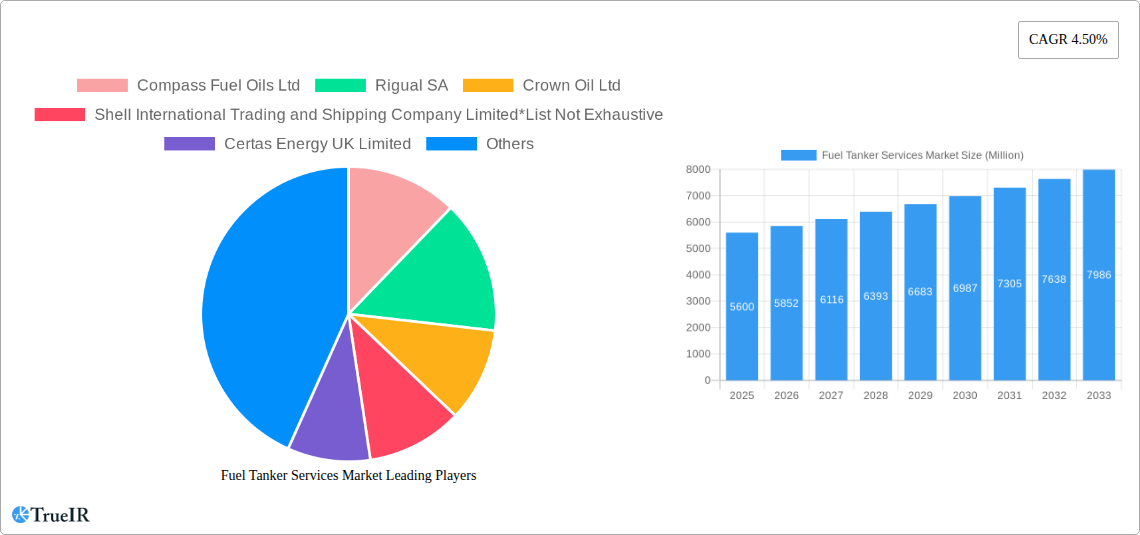
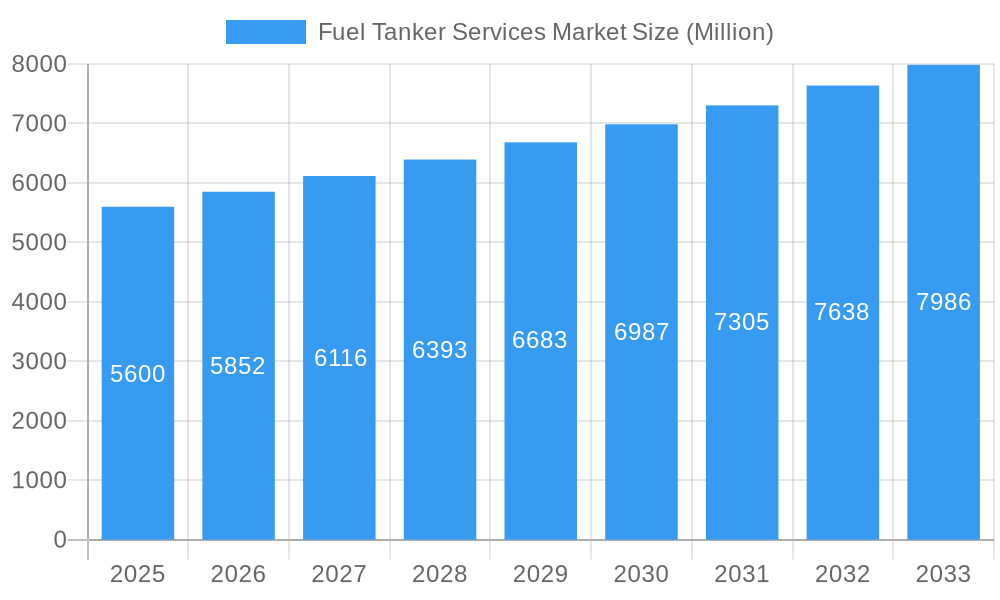
The global Fuel Tanker Services market, valued at $5.60 billion in 2025, is projected to experience robust growth, driven by increasing global fuel demand and expanding infrastructure development in emerging economies. A compound annual growth rate (CAGR) of 4.5% from 2025 to 2033 indicates a significant market expansion. Key growth drivers include the rising consumption of petroleum products, particularly in the transportation and industrial sectors, and the ongoing need for efficient fuel transportation and storage solutions. The market is segmented by tanker capacity (below 20,000 liters, 30,000-40,000 liters, above 40,000 liters), fuel type (petrol, LNG, other fuels), operator type (retail petrol companies, refineries), and material type (carbon steel, stainless steel, aluminum alloy). The increasing adoption of LNG as a cleaner fuel source is expected to further fuel market growth in the coming years. However, fluctuating fuel prices and stringent environmental regulations pose challenges to market expansion. Regional analysis reveals strong growth potential in Asia-Pacific, fueled by rapid industrialization and urbanization, while North America and Europe represent established markets with steady growth trajectories. Competitive dynamics involve major players like Compass Fuel Oils Ltd, Rigual SA, Crown Oil Ltd, Shell International Trading and Shipping Company Limited, and Certas Energy UK Limited, alongside numerous regional and specialized operators. The market is likely to see increased consolidation and strategic partnerships as companies strive for efficiency and market share expansion.
Fuel Tanker Services Market Market Size (In Billion)
The diverse segmentation within the fuel tanker services market presents opportunities for specialized service providers. Companies are focusing on technological advancements to improve efficiency and safety, including implementing advanced tracking systems, fuel optimization strategies, and adopting eco-friendly materials. Furthermore, the growing emphasis on sustainability and reducing carbon emissions will likely drive the adoption of LNG-focused fuel tankers and the development of innovative fuel transportation technologies. The market's future growth hinges on effective regulatory compliance, infrastructure investments, and the overall health of the global energy sector. Future research should focus on the impact of alternative fuels and evolving environmental regulations on market segment growth and the competitive landscape.
Fuel Tanker Services Market Company Market Share
Fuel Tanker Services Market: A Comprehensive Report (2019-2033)
This dynamic report provides a comprehensive analysis of the Fuel Tanker Services Market, offering invaluable insights for businesses, investors, and stakeholders seeking to navigate this evolving landscape. Covering the period from 2019 to 2033, with a focus on 2025, this report delves into market size, segmentation, competitive dynamics, and future growth prospects. The study incorporates detailed analysis of key players like Compass Fuel Oils Ltd, Rigual SA, Crown Oil Ltd, Shell International Trading and Shipping Company Limited, Certas Energy UK Limited, and more, providing a 360-degree view of the market. Download now to gain a competitive edge.
Fuel Tanker Services Market Structure & Competitive Landscape
The Fuel Tanker Services market exhibits a moderately consolidated structure, with a Herfindahl-Hirschman Index (HHI) estimated at xx in 2025. This reflects the presence of several large players alongside numerous smaller, regional operators. Market concentration is influenced by factors such as economies of scale, access to capital, and technological advancements. Innovation, particularly in fuel efficiency and safety technologies, is a key driver of competition. Stringent regulations concerning emissions and safety standards significantly impact operational costs and market entry barriers. Product substitutes, such as pipelines and rail transport, exert competitive pressure, especially for long-distance fuel transportation.
The market is segmented by end-user, with Retail Petrol Companies and Refineries representing the largest segments. Mergers and Acquisitions (M&A) activity has been relatively moderate in recent years, with an estimated xx Million USD worth of transactions in 2024. However, increased consolidation is expected as companies seek to expand their market share and enhance operational efficiency.
- Market Concentration: HHI of xx in 2025 (estimated).
- Innovation Drivers: Fuel efficiency technologies, safety enhancements, digitalization of operations.
- Regulatory Impacts: Emission standards, safety regulations, licensing requirements.
- Product Substitutes: Pipelines, rail transport.
- End-User Segmentation: Retail Petrol Companies, Refineries, others.
- M&A Trends: xx Million USD in transactions in 2024 (estimated).
Fuel Tanker Services Market Market Trends & Opportunities
The global Fuel Tanker Services Market is experiencing robust growth, driven by increasing global fuel demand, expansion of the transportation sector, and infrastructure development in emerging economies. The market size is projected to reach xx Million USD by 2033, registering a Compound Annual Growth Rate (CAGR) of xx% during the forecast period (2025-2033). Technological advancements, such as the adoption of advanced telematics and GPS tracking systems for improved fleet management and fuel optimization, are reshaping the industry. Consumer preferences for cleaner fuels are creating opportunities for the transport of LNG and other alternative fuels. Furthermore, the growing focus on sustainability is encouraging the adoption of fuel-efficient tankers and environmentally friendly operating practices. Intense competition among established players and new entrants is leading to price pressures, emphasizing the need for operational efficiency and differentiation through value-added services. Market penetration rates for newer technologies, such as LNG tankers, are expected to grow significantly, reaching xx% by 2033.
Dominant Markets & Segments in Fuel Tanker Services Market
While regional dominance varies across segments, several trends emerge. The European market generally holds a significant share, driven by strong industrial activity and established infrastructure. Within the capacity segment, the demand for tankers with capacities above 40,000 liters is significantly higher due to economies of scale and the needs of large-scale industrial operations. Similarly, petrol remains the most dominant fuel type transported, although the LNG segment shows promising growth prospects due to environmental concerns and government incentives. Refineries represent a large end-user segment, underpinned by their role in fuel distribution and processing. Carbon steel remains the most widely used material for tanker construction because of its cost-effectiveness, however, the use of stainless steel and aluminum alloys is increasing, especially where corrosion resistance is vital.
- Key Growth Drivers:
- Robust infrastructure development in emerging economies.
- Favorable government policies supporting transportation infrastructure.
- Increasing demand for fuel transportation.
- Rising adoption of alternative fuels (LNG).
- Dominant Segments:
- Capacity: Above 40,000 Liters.
- Fuel Type: Petrol.
- Operator: Refineries.
- Material Type: Carbon Steel.
Fuel Tanker Services Market Product Analysis
The Fuel Tanker Services market is witnessing significant product innovation focused on improving fuel efficiency, safety, and environmental performance. Technological advancements include the integration of advanced telematics for real-time tracking and fleet management, the adoption of lighter-weight materials to reduce fuel consumption, and the development of specialized tankers for the transport of LNG and other alternative fuels. These innovations provide competitive advantages by enhancing operational efficiency, reducing costs, and improving environmental sustainability. The market fit for these advancements is strong, driven by increasing regulatory pressure and consumer demand for environmentally responsible transportation solutions.
Key Drivers, Barriers & Challenges in Fuel Tanker Services Market
Key Drivers: Growing global fuel demand, expansion of the transportation sector, infrastructure development in emerging economies, and technological advancements in fuel efficiency and safety. Government regulations promoting cleaner fuels and sustainable transportation are also key drivers.
Challenges and Restraints: Fluctuations in fuel prices, stringent environmental regulations leading to higher compliance costs, competition from alternative transportation modes (pipelines, rail), and potential supply chain disruptions due to geopolitical instability can all significantly impact market growth. The estimated impact of these challenges on market growth is a reduction of xx% by 2033 (predicted).
Growth Drivers in the Fuel Tanker Services Market Market
The market's growth is fueled by a confluence of factors. Increased global fuel demand, particularly in emerging economies, is a primary driver. Expansion of the transportation sector, coupled with growing infrastructure development, further boosts the need for efficient fuel transportation. Technological advancements, such as the development of more efficient and safer tankers, also contribute significantly. Finally, governmental policies promoting sustainable transportation and cleaner fuel sources create favorable conditions for market expansion.
Challenges Impacting Fuel Tanker Services Market Growth
Several challenges impede market growth. Stringent environmental regulations increase operational costs and compliance burdens. Supply chain disruptions, influenced by geopolitical events or natural disasters, can lead to delays and increased transportation costs. Furthermore, intensifying competition among existing players and new entrants pressures profit margins. These factors collectively impact the market's overall trajectory.
Key Players Shaping the Fuel Tanker Services Market Market
- Compass Fuel Oils Ltd
- Rigual SA
- Crown Oil Ltd
- Shell International Trading and Shipping Company Limited
- Certas Energy UK Limited
Significant Fuel Tanker Services Market Industry Milestones
- January 2024: Compass Fuel Oils Ltd announced the acquisition of a new Arctic fuel tanker, significantly expanding its capacity.
- December 2023: ReFuels announced the construction of a new CNG refueling facility, promoting sustainable transportation.
Future Outlook for Fuel Tanker Services Market Market
The Fuel Tanker Services market is poised for continued growth, driven by the factors outlined above. Strategic opportunities exist for companies to invest in innovative technologies, expand into emerging markets, and offer value-added services. The market's potential is significant, with substantial growth expected in the coming years. Focus on sustainability and the adoption of alternative fuels will shape the future trajectory of the market.
Fuel Tanker Services Market Segmentation
-
1. Material Type
- 1.1. Carbon Steel
- 1.2. Stainless Steel
- 1.3. Aluminum Alloy
-
2. Capacity
- 2.1. Below 20000 Liters
- 2.2. 30000 - 40000 Liters
- 2.3. Above 40000 Liters
-
3. Fuel Type
- 3.1. Petrol
- 3.2. LNG
- 3.3. Other Fuels
-
4. Operator
- 4.1. Retail Petrol Companies
- 4.2. Refineries
Fuel Tanker Services Market Segmentation By Geography
-
1. North America
- 1.1. United States
- 1.2. Canada
- 1.3. Rest of North America
-
2. Europe
- 2.1. Germany
- 2.2. France
- 2.3. United Kingdom
- 2.4. Italy
- 2.5. Spain
- 2.6. NORDIC
- 2.7. Russia
- 2.8. Rest of Europe
-
3. Asia Pacific
- 3.1. China
- 3.2. India
- 3.3. Australia
- 3.4. Malaysia
- 3.5. Indonesia
- 3.6. Thailand
- 3.7. Vietnam
- 3.8. Rest of Asia Pacific
-
4. Middle East and Africa
- 4.1. Saudi Arabia
- 4.2. United Arab Emirates
- 4.3. South Africa
- 4.4. Nigeria
- 4.5. Rest of Middle East and Africa
- 4.6. Egypt
-
5. South America
- 5.1. Brazil
- 5.2. Argentina
- 5.3. Colombia
- 5.4. Rest of South America
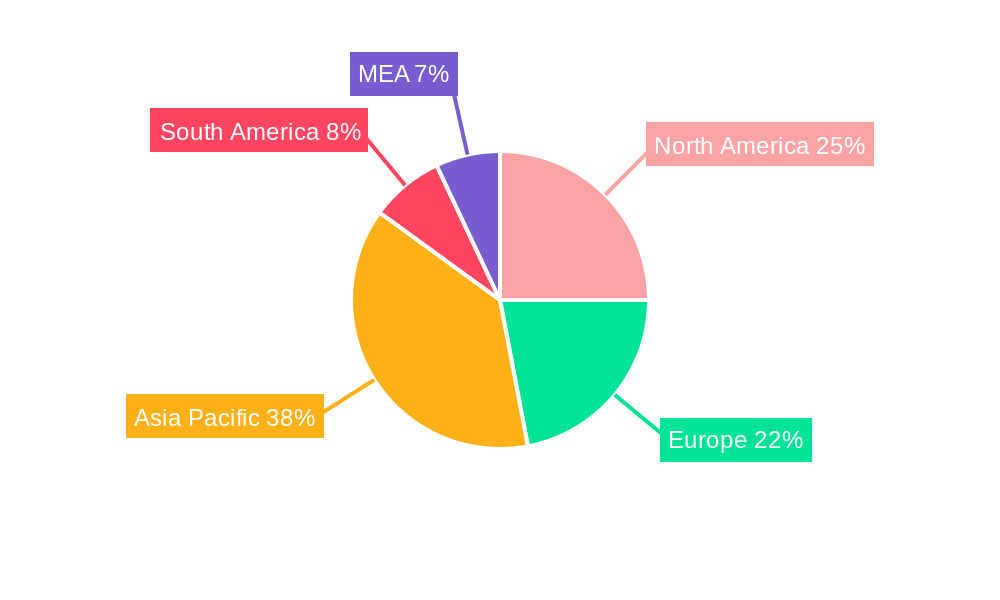
Fuel Tanker Services Market Regional Market Share
Geographic Coverage of Fuel Tanker Services Market
Fuel Tanker Services Market REPORT HIGHLIGHTS
| Aspects | Details |
|---|---|
| Study Period | 2020-2034 |
| Base Year | 2025 |
| Estimated Year | 2026 |
| Forecast Period | 2026-2034 |
| Historical Period | 2020-2025 |
| Growth Rate | CAGR of 4.50% from 2020-2034 |
| Segmentation |
|
Table of Contents
- 1. Introduction
- 1.1. Research Scope
- 1.2. Market Segmentation
- 1.3. Research Objective
- 1.4. Definitions and Assumptions
- 2. Executive Summary
- 2.1. Market Snapshot
- 3. Market Dynamics
- 3.1. Market Drivers
- 3.2. Market Restrains
- 3.3. Market Trends
- 3.4. Market Opportunities
- 4. Market Factor Analysis
- 4.1. Porters Five Forces
- 4.1.1. Bargaining Power of Suppliers
- 4.1.2. Bargaining Power of Buyers
- 4.1.3. Threat of New Entrants
- 4.1.4. Threat of Substitutes
- 4.1.5. Competitive Rivalry
- 4.2. PESTEL analysis
- 4.3. BCG Analysis
- 4.3.1. Stars (High Growth, High Market Share)
- 4.3.2. Cash Cows (Low Growth, High Market Share)
- 4.3.3. Question Mark (High Growth, Low Market Share)
- 4.3.4. Dogs (Low Growth, Low Market Share)
- 4.4. Ansoff Matrix Analysis
- 4.5. Supply Chain Analysis
- 4.6. Regulatory Landscape
- 4.7. Current Market Potential and Opportunity Assessment (TAM–SAM–SOM Framework)
- 4.8. TIR Analyst Note
- 4.1. Porters Five Forces
- 5. Market Analysis, Insights and Forecast 2021-2033
- 5.1. Market Analysis, Insights and Forecast - by Material Type
- 5.1.1. Carbon Steel
- 5.1.2. Stainless Steel
- 5.1.3. Aluminum Alloy
- 5.2. Market Analysis, Insights and Forecast - by Capacity
- 5.2.1. Below 20000 Liters
- 5.2.2. 30000 - 40000 Liters
- 5.2.3. Above 40000 Liters
- 5.3. Market Analysis, Insights and Forecast - by Fuel Type
- 5.3.1. Petrol
- 5.3.2. LNG
- 5.3.3. Other Fuels
- 5.4. Market Analysis, Insights and Forecast - by Operator
- 5.4.1. Retail Petrol Companies
- 5.4.2. Refineries
- 5.5. Market Analysis, Insights and Forecast - by Region
- 5.5.1. North America
- 5.5.2. Europe
- 5.5.3. Asia Pacific
- 5.5.4. Middle East and Africa
- 5.5.5. South America
- 5.1. Market Analysis, Insights and Forecast - by Material Type
- 6. Global Fuel Tanker Services Market Analysis, Insights and Forecast, 2021-2033
- 6.1. Market Analysis, Insights and Forecast - by Material Type
- 6.1.1. Carbon Steel
- 6.1.2. Stainless Steel
- 6.1.3. Aluminum Alloy
- 6.2. Market Analysis, Insights and Forecast - by Capacity
- 6.2.1. Below 20000 Liters
- 6.2.2. 30000 - 40000 Liters
- 6.2.3. Above 40000 Liters
- 6.3. Market Analysis, Insights and Forecast - by Fuel Type
- 6.3.1. Petrol
- 6.3.2. LNG
- 6.3.3. Other Fuels
- 6.4. Market Analysis, Insights and Forecast - by Operator
- 6.4.1. Retail Petrol Companies
- 6.4.2. Refineries
- 6.1. Market Analysis, Insights and Forecast - by Material Type
- 7. North America Fuel Tanker Services Market Analysis, Insights and Forecast, 2020-2032
- 7.1. Market Analysis, Insights and Forecast - by Material Type
- 7.1.1. Carbon Steel
- 7.1.2. Stainless Steel
- 7.1.3. Aluminum Alloy
- 7.2. Market Analysis, Insights and Forecast - by Capacity
- 7.2.1. Below 20000 Liters
- 7.2.2. 30000 - 40000 Liters
- 7.2.3. Above 40000 Liters
- 7.3. Market Analysis, Insights and Forecast - by Fuel Type
- 7.3.1. Petrol
- 7.3.2. LNG
- 7.3.3. Other Fuels
- 7.4. Market Analysis, Insights and Forecast - by Operator
- 7.4.1. Retail Petrol Companies
- 7.4.2. Refineries
- 7.1. Market Analysis, Insights and Forecast - by Material Type
- 8. Europe Fuel Tanker Services Market Analysis, Insights and Forecast, 2020-2032
- 8.1. Market Analysis, Insights and Forecast - by Material Type
- 8.1.1. Carbon Steel
- 8.1.2. Stainless Steel
- 8.1.3. Aluminum Alloy
- 8.2. Market Analysis, Insights and Forecast - by Capacity
- 8.2.1. Below 20000 Liters
- 8.2.2. 30000 - 40000 Liters
- 8.2.3. Above 40000 Liters
- 8.3. Market Analysis, Insights and Forecast - by Fuel Type
- 8.3.1. Petrol
- 8.3.2. LNG
- 8.3.3. Other Fuels
- 8.4. Market Analysis, Insights and Forecast - by Operator
- 8.4.1. Retail Petrol Companies
- 8.4.2. Refineries
- 8.1. Market Analysis, Insights and Forecast - by Material Type
- 9. Asia Pacific Fuel Tanker Services Market Analysis, Insights and Forecast, 2020-2032
- 9.1. Market Analysis, Insights and Forecast - by Material Type
- 9.1.1. Carbon Steel
- 9.1.2. Stainless Steel
- 9.1.3. Aluminum Alloy
- 9.2. Market Analysis, Insights and Forecast - by Capacity
- 9.2.1. Below 20000 Liters
- 9.2.2. 30000 - 40000 Liters
- 9.2.3. Above 40000 Liters
- 9.3. Market Analysis, Insights and Forecast - by Fuel Type
- 9.3.1. Petrol
- 9.3.2. LNG
- 9.3.3. Other Fuels
- 9.4. Market Analysis, Insights and Forecast - by Operator
- 9.4.1. Retail Petrol Companies
- 9.4.2. Refineries
- 9.1. Market Analysis, Insights and Forecast - by Material Type
- 10. Middle East and Africa Fuel Tanker Services Market Analysis, Insights and Forecast, 2020-2032
- 10.1. Market Analysis, Insights and Forecast - by Material Type
- 10.1.1. Carbon Steel
- 10.1.2. Stainless Steel
- 10.1.3. Aluminum Alloy
- 10.2. Market Analysis, Insights and Forecast - by Capacity
- 10.2.1. Below 20000 Liters
- 10.2.2. 30000 - 40000 Liters
- 10.2.3. Above 40000 Liters
- 10.3. Market Analysis, Insights and Forecast - by Fuel Type
- 10.3.1. Petrol
- 10.3.2. LNG
- 10.3.3. Other Fuels
- 10.4. Market Analysis, Insights and Forecast - by Operator
- 10.4.1. Retail Petrol Companies
- 10.4.2. Refineries
- 10.1. Market Analysis, Insights and Forecast - by Material Type
- 11. South America Fuel Tanker Services Market Analysis, Insights and Forecast, 2020-2032
- 11.1. Market Analysis, Insights and Forecast - by Material Type
- 11.1.1. Carbon Steel
- 11.1.2. Stainless Steel
- 11.1.3. Aluminum Alloy
- 11.2. Market Analysis, Insights and Forecast - by Capacity
- 11.2.1. Below 20000 Liters
- 11.2.2. 30000 - 40000 Liters
- 11.2.3. Above 40000 Liters
- 11.3. Market Analysis, Insights and Forecast - by Fuel Type
- 11.3.1. Petrol
- 11.3.2. LNG
- 11.3.3. Other Fuels
- 11.4. Market Analysis, Insights and Forecast - by Operator
- 11.4.1. Retail Petrol Companies
- 11.4.2. Refineries
- 11.1. Market Analysis, Insights and Forecast - by Material Type
- 12. Competitive Analysis
- 12.1. Company Profiles
- 12.1.1 Compass Fuel Oils Ltd
- 12.1.1.1. Company Overview
- 12.1.1.2. Products
- 12.1.1.3. Company Financials
- 12.1.1.4. SWOT Analysis
- 12.1.2 Rigual SA
- 12.1.2.1. Company Overview
- 12.1.2.2. Products
- 12.1.2.3. Company Financials
- 12.1.2.4. SWOT Analysis
- 12.1.3 Crown Oil Ltd
- 12.1.3.1. Company Overview
- 12.1.3.2. Products
- 12.1.3.3. Company Financials
- 12.1.3.4. SWOT Analysis
- 12.1.4 Shell International Trading and Shipping Company Limited*List Not Exhaustive
- 12.1.4.1. Company Overview
- 12.1.4.2. Products
- 12.1.4.3. Company Financials
- 12.1.4.4. SWOT Analysis
- 12.1.5 Certas Energy UK Limited
- 12.1.5.1. Company Overview
- 12.1.5.2. Products
- 12.1.5.3. Company Financials
- 12.1.5.4. SWOT Analysis
- 12.1.1 Compass Fuel Oils Ltd
- 12.2. Market Entropy
- 12.2.1 Company's Key Areas Served
- 12.2.2 Recent Developments
- 12.3. Company Market Share Analysis 2025
- 12.3.1 Top 5 Companies Market Share Analysis
- 12.3.2 Top 3 Companies Market Share Analysis
- 12.4. List of Potential Customers
- 13. Research Methodology
List of Figures
- Figure 1: Global Fuel Tanker Services Market Revenue Breakdown (Million, %) by Region 2025 & 2033
- Figure 2: North America Fuel Tanker Services Market Revenue (Million), by Material Type 2025 & 2033
- Figure 3: North America Fuel Tanker Services Market Revenue Share (%), by Material Type 2025 & 2033
- Figure 4: North America Fuel Tanker Services Market Revenue (Million), by Capacity 2025 & 2033
- Figure 5: North America Fuel Tanker Services Market Revenue Share (%), by Capacity 2025 & 2033
- Figure 6: North America Fuel Tanker Services Market Revenue (Million), by Fuel Type 2025 & 2033
- Figure 7: North America Fuel Tanker Services Market Revenue Share (%), by Fuel Type 2025 & 2033
- Figure 8: North America Fuel Tanker Services Market Revenue (Million), by Operator 2025 & 2033
- Figure 9: North America Fuel Tanker Services Market Revenue Share (%), by Operator 2025 & 2033
- Figure 10: North America Fuel Tanker Services Market Revenue (Million), by Country 2025 & 2033
- Figure 11: North America Fuel Tanker Services Market Revenue Share (%), by Country 2025 & 2033
- Figure 12: Europe Fuel Tanker Services Market Revenue (Million), by Material Type 2025 & 2033
- Figure 13: Europe Fuel Tanker Services Market Revenue Share (%), by Material Type 2025 & 2033
- Figure 14: Europe Fuel Tanker Services Market Revenue (Million), by Capacity 2025 & 2033
- Figure 15: Europe Fuel Tanker Services Market Revenue Share (%), by Capacity 2025 & 2033
- Figure 16: Europe Fuel Tanker Services Market Revenue (Million), by Fuel Type 2025 & 2033
- Figure 17: Europe Fuel Tanker Services Market Revenue Share (%), by Fuel Type 2025 & 2033
- Figure 18: Europe Fuel Tanker Services Market Revenue (Million), by Operator 2025 & 2033
- Figure 19: Europe Fuel Tanker Services Market Revenue Share (%), by Operator 2025 & 2033
- Figure 20: Europe Fuel Tanker Services Market Revenue (Million), by Country 2025 & 2033
- Figure 21: Europe Fuel Tanker Services Market Revenue Share (%), by Country 2025 & 2033
- Figure 22: Asia Pacific Fuel Tanker Services Market Revenue (Million), by Material Type 2025 & 2033
- Figure 23: Asia Pacific Fuel Tanker Services Market Revenue Share (%), by Material Type 2025 & 2033
- Figure 24: Asia Pacific Fuel Tanker Services Market Revenue (Million), by Capacity 2025 & 2033
- Figure 25: Asia Pacific Fuel Tanker Services Market Revenue Share (%), by Capacity 2025 & 2033
- Figure 26: Asia Pacific Fuel Tanker Services Market Revenue (Million), by Fuel Type 2025 & 2033
- Figure 27: Asia Pacific Fuel Tanker Services Market Revenue Share (%), by Fuel Type 2025 & 2033
- Figure 28: Asia Pacific Fuel Tanker Services Market Revenue (Million), by Operator 2025 & 2033
- Figure 29: Asia Pacific Fuel Tanker Services Market Revenue Share (%), by Operator 2025 & 2033
- Figure 30: Asia Pacific Fuel Tanker Services Market Revenue (Million), by Country 2025 & 2033
- Figure 31: Asia Pacific Fuel Tanker Services Market Revenue Share (%), by Country 2025 & 2033
- Figure 32: Middle East and Africa Fuel Tanker Services Market Revenue (Million), by Material Type 2025 & 2033
- Figure 33: Middle East and Africa Fuel Tanker Services Market Revenue Share (%), by Material Type 2025 & 2033
- Figure 34: Middle East and Africa Fuel Tanker Services Market Revenue (Million), by Capacity 2025 & 2033
- Figure 35: Middle East and Africa Fuel Tanker Services Market Revenue Share (%), by Capacity 2025 & 2033
- Figure 36: Middle East and Africa Fuel Tanker Services Market Revenue (Million), by Fuel Type 2025 & 2033
- Figure 37: Middle East and Africa Fuel Tanker Services Market Revenue Share (%), by Fuel Type 2025 & 2033
- Figure 38: Middle East and Africa Fuel Tanker Services Market Revenue (Million), by Operator 2025 & 2033
- Figure 39: Middle East and Africa Fuel Tanker Services Market Revenue Share (%), by Operator 2025 & 2033
- Figure 40: Middle East and Africa Fuel Tanker Services Market Revenue (Million), by Country 2025 & 2033
- Figure 41: Middle East and Africa Fuel Tanker Services Market Revenue Share (%), by Country 2025 & 2033
- Figure 42: South America Fuel Tanker Services Market Revenue (Million), by Material Type 2025 & 2033
- Figure 43: South America Fuel Tanker Services Market Revenue Share (%), by Material Type 2025 & 2033
- Figure 44: South America Fuel Tanker Services Market Revenue (Million), by Capacity 2025 & 2033
- Figure 45: South America Fuel Tanker Services Market Revenue Share (%), by Capacity 2025 & 2033
- Figure 46: South America Fuel Tanker Services Market Revenue (Million), by Fuel Type 2025 & 2033
- Figure 47: South America Fuel Tanker Services Market Revenue Share (%), by Fuel Type 2025 & 2033
- Figure 48: South America Fuel Tanker Services Market Revenue (Million), by Operator 2025 & 2033
- Figure 49: South America Fuel Tanker Services Market Revenue Share (%), by Operator 2025 & 2033
- Figure 50: South America Fuel Tanker Services Market Revenue (Million), by Country 2025 & 2033
- Figure 51: South America Fuel Tanker Services Market Revenue Share (%), by Country 2025 & 2033
List of Tables
- Table 1: Global Fuel Tanker Services Market Revenue Million Forecast, by Material Type 2020 & 2033
- Table 2: Global Fuel Tanker Services Market Revenue Million Forecast, by Capacity 2020 & 2033
- Table 3: Global Fuel Tanker Services Market Revenue Million Forecast, by Fuel Type 2020 & 2033
- Table 4: Global Fuel Tanker Services Market Revenue Million Forecast, by Operator 2020 & 2033
- Table 5: Global Fuel Tanker Services Market Revenue Million Forecast, by Region 2020 & 2033
- Table 6: Global Fuel Tanker Services Market Revenue Million Forecast, by Material Type 2020 & 2033
- Table 7: Global Fuel Tanker Services Market Revenue Million Forecast, by Capacity 2020 & 2033
- Table 8: Global Fuel Tanker Services Market Revenue Million Forecast, by Fuel Type 2020 & 2033
- Table 9: Global Fuel Tanker Services Market Revenue Million Forecast, by Operator 2020 & 2033
- Table 10: Global Fuel Tanker Services Market Revenue Million Forecast, by Country 2020 & 2033
- Table 11: United States Fuel Tanker Services Market Revenue (Million) Forecast, by Application 2020 & 2033
- Table 12: Canada Fuel Tanker Services Market Revenue (Million) Forecast, by Application 2020 & 2033
- Table 13: Rest of North America Fuel Tanker Services Market Revenue (Million) Forecast, by Application 2020 & 2033
- Table 14: Global Fuel Tanker Services Market Revenue Million Forecast, by Material Type 2020 & 2033
- Table 15: Global Fuel Tanker Services Market Revenue Million Forecast, by Capacity 2020 & 2033
- Table 16: Global Fuel Tanker Services Market Revenue Million Forecast, by Fuel Type 2020 & 2033
- Table 17: Global Fuel Tanker Services Market Revenue Million Forecast, by Operator 2020 & 2033
- Table 18: Global Fuel Tanker Services Market Revenue Million Forecast, by Country 2020 & 2033
- Table 19: Germany Fuel Tanker Services Market Revenue (Million) Forecast, by Application 2020 & 2033
- Table 20: France Fuel Tanker Services Market Revenue (Million) Forecast, by Application 2020 & 2033
- Table 21: United Kingdom Fuel Tanker Services Market Revenue (Million) Forecast, by Application 2020 & 2033
- Table 22: Italy Fuel Tanker Services Market Revenue (Million) Forecast, by Application 2020 & 2033
- Table 23: Spain Fuel Tanker Services Market Revenue (Million) Forecast, by Application 2020 & 2033
- Table 24: NORDIC Fuel Tanker Services Market Revenue (Million) Forecast, by Application 2020 & 2033
- Table 25: Russia Fuel Tanker Services Market Revenue (Million) Forecast, by Application 2020 & 2033
- Table 26: Rest of Europe Fuel Tanker Services Market Revenue (Million) Forecast, by Application 2020 & 2033
- Table 27: Global Fuel Tanker Services Market Revenue Million Forecast, by Material Type 2020 & 2033
- Table 28: Global Fuel Tanker Services Market Revenue Million Forecast, by Capacity 2020 & 2033
- Table 29: Global Fuel Tanker Services Market Revenue Million Forecast, by Fuel Type 2020 & 2033
- Table 30: Global Fuel Tanker Services Market Revenue Million Forecast, by Operator 2020 & 2033
- Table 31: Global Fuel Tanker Services Market Revenue Million Forecast, by Country 2020 & 2033
- Table 32: China Fuel Tanker Services Market Revenue (Million) Forecast, by Application 2020 & 2033
- Table 33: India Fuel Tanker Services Market Revenue (Million) Forecast, by Application 2020 & 2033
- Table 34: Australia Fuel Tanker Services Market Revenue (Million) Forecast, by Application 2020 & 2033
- Table 35: Malaysia Fuel Tanker Services Market Revenue (Million) Forecast, by Application 2020 & 2033
- Table 36: Indonesia Fuel Tanker Services Market Revenue (Million) Forecast, by Application 2020 & 2033
- Table 37: Thailand Fuel Tanker Services Market Revenue (Million) Forecast, by Application 2020 & 2033
- Table 38: Vietnam Fuel Tanker Services Market Revenue (Million) Forecast, by Application 2020 & 2033
- Table 39: Rest of Asia Pacific Fuel Tanker Services Market Revenue (Million) Forecast, by Application 2020 & 2033
- Table 40: Global Fuel Tanker Services Market Revenue Million Forecast, by Material Type 2020 & 2033
- Table 41: Global Fuel Tanker Services Market Revenue Million Forecast, by Capacity 2020 & 2033
- Table 42: Global Fuel Tanker Services Market Revenue Million Forecast, by Fuel Type 2020 & 2033
- Table 43: Global Fuel Tanker Services Market Revenue Million Forecast, by Operator 2020 & 2033
- Table 44: Global Fuel Tanker Services Market Revenue Million Forecast, by Country 2020 & 2033
- Table 45: Saudi Arabia Fuel Tanker Services Market Revenue (Million) Forecast, by Application 2020 & 2033
- Table 46: United Arab Emirates Fuel Tanker Services Market Revenue (Million) Forecast, by Application 2020 & 2033
- Table 47: South Africa Fuel Tanker Services Market Revenue (Million) Forecast, by Application 2020 & 2033
- Table 48: Nigeria Fuel Tanker Services Market Revenue (Million) Forecast, by Application 2020 & 2033
- Table 49: Rest of Middle East and Africa Fuel Tanker Services Market Revenue (Million) Forecast, by Application 2020 & 2033
- Table 50: Egypt Fuel Tanker Services Market Revenue (Million) Forecast, by Application 2020 & 2033
- Table 51: Global Fuel Tanker Services Market Revenue Million Forecast, by Material Type 2020 & 2033
- Table 52: Global Fuel Tanker Services Market Revenue Million Forecast, by Capacity 2020 & 2033
- Table 53: Global Fuel Tanker Services Market Revenue Million Forecast, by Fuel Type 2020 & 2033
- Table 54: Global Fuel Tanker Services Market Revenue Million Forecast, by Operator 2020 & 2033
- Table 55: Global Fuel Tanker Services Market Revenue Million Forecast, by Country 2020 & 2033
- Table 56: Brazil Fuel Tanker Services Market Revenue (Million) Forecast, by Application 2020 & 2033
- Table 57: Argentina Fuel Tanker Services Market Revenue (Million) Forecast, by Application 2020 & 2033
- Table 58: Colombia Fuel Tanker Services Market Revenue (Million) Forecast, by Application 2020 & 2033
- Table 59: Rest of South America Fuel Tanker Services Market Revenue (Million) Forecast, by Application 2020 & 2033
Frequently Asked Questions
1. What is the projected Compound Annual Growth Rate (CAGR) of the Fuel Tanker Services Market?
The projected CAGR is approximately 4.50%.
2. Which companies are prominent players in the Fuel Tanker Services Market?
Key companies in the market include Compass Fuel Oils Ltd, Rigual SA, Crown Oil Ltd, Shell International Trading and Shipping Company Limited*List Not Exhaustive, Certas Energy UK Limited.
3. What are the main segments of the Fuel Tanker Services Market?
The market segments include Material Type, Capacity, Fuel Type, Operator.
4. Can you provide details about the market size?
The market size is estimated to be USD 5.60 Million as of 2022.
5. What are some drivers contributing to market growth?
4.; Increasing Demand for Sales of Commercial Vehicles4.; Increasing Deployment of Retail Fuel Outlets Across Various Countries.
6. What are the notable trends driving market growth?
The LNG Segment is Expected to Dominate the Market.
7. Are there any restraints impacting market growth?
4.; Growing Penetration and Demand for Electric Vehicles.
8. Can you provide examples of recent developments in the market?
January 2024: Compass Fuel Oils Ltd announced the acquisition of a new Arctic fuel tanker, marking a significant addition to their expanding fleet at their headquarters in Preston, United Kingdom. This latest addition underscores the company’s commitment to enhancing its capacity.
9. What pricing options are available for accessing the report?
Pricing options include single-user, multi-user, and enterprise licenses priced at USD 4750, USD 5250, and USD 8750 respectively.
10. Is the market size provided in terms of value or volume?
The market size is provided in terms of value, measured in Million.
11. Are there any specific market keywords associated with the report?
Yes, the market keyword associated with the report is "Fuel Tanker Services Market," which aids in identifying and referencing the specific market segment covered.
12. How do I determine which pricing option suits my needs best?
The pricing options vary based on user requirements and access needs. Individual users may opt for single-user licenses, while businesses requiring broader access may choose multi-user or enterprise licenses for cost-effective access to the report.
13. Are there any additional resources or data provided in the Fuel Tanker Services Market report?
While the report offers comprehensive insights, it's advisable to review the specific contents or supplementary materials provided to ascertain if additional resources or data are available.
14. How can I stay updated on further developments or reports in the Fuel Tanker Services Market?
To stay informed about further developments, trends, and reports in the Fuel Tanker Services Market, consider subscribing to industry newsletters, following relevant companies and organizations, or regularly checking reputable industry news sources and publications.
Methodology
Step 1 - Identification of Relevant Samples Size from Population Database


Step 2 - Approaches for Defining Global Market Size (Value, Volume* & Price*)

Note*: In applicable scenarios
Step 3 - Data Sources
Primary Research
- Web Analytics
- Survey Reports
- Research Institute
- Latest Research Reports
- Opinion Leaders
Secondary Research
- Annual Reports
- White Paper
- Latest Press Release
- Industry Association
- Paid Database
- Investor Presentations

Step 4 - Data Triangulation
Involves using different sources of information in order to increase the validity of a study
These sources are likely to be stakeholders in a program - participants, other researchers, program staff, other community members, and so on.
Then we put all data in single framework & apply various statistical tools to find out the dynamic on the market.
During the analysis stage, feedback from the stakeholder groups would be compared to determine areas of agreement as well as areas of divergence