

Key Insights
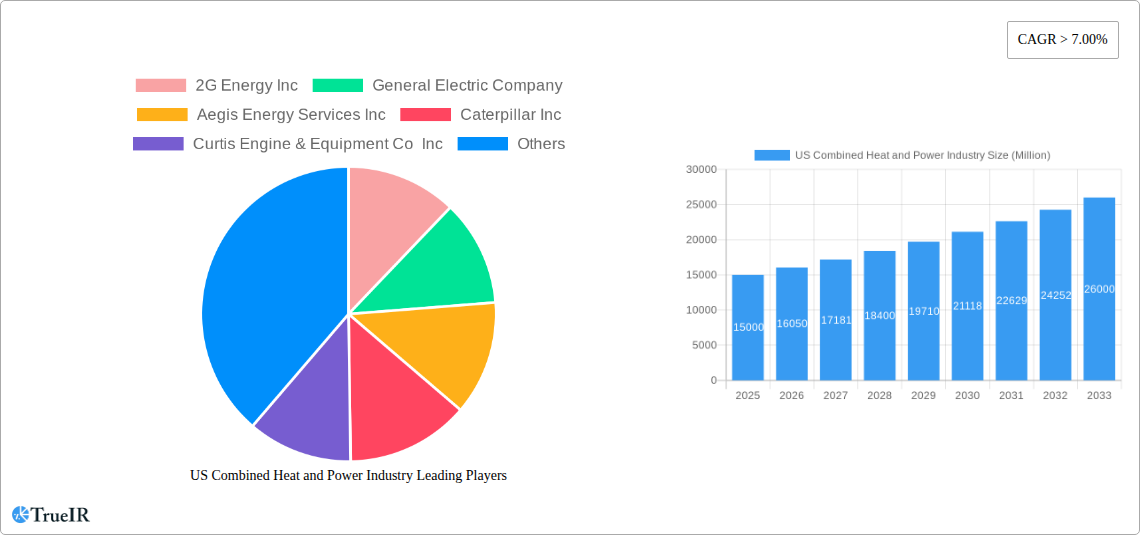
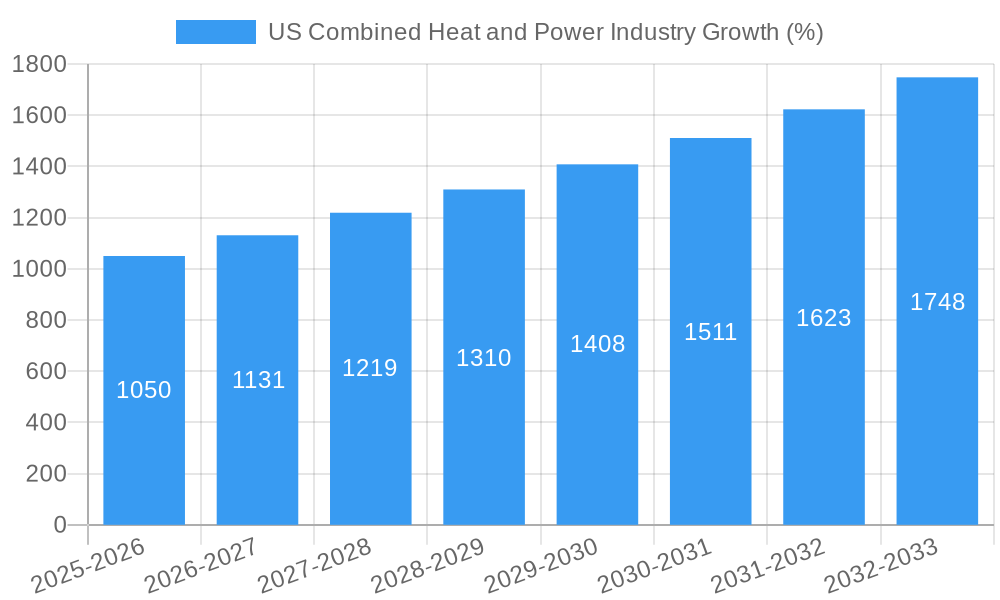
The US Combined Heat and Power (CHP) industry is experiencing robust growth, driven by increasing energy efficiency mandates, rising electricity costs, and a growing focus on reducing carbon emissions. The market, valued at approximately $15 billion in 2025, is projected to maintain a Compound Annual Growth Rate (CAGR) exceeding 7% through 2033. This expansion is fueled by several key trends: the increasing adoption of renewable energy sources integrated with CHP systems (like solar and biogas), advancements in CHP technology leading to improved efficiency and reduced operating costs, and supportive government policies incentivizing energy-efficient solutions. Key market segments include industrial CHP, commercial CHP, and institutional CHP, with industrial applications currently dominating due to high energy demands. Leading players such as General Electric, Caterpillar, and Yanmar America Corp are driving innovation and expanding their market presence through strategic partnerships, technological advancements, and acquisitions. However, high initial investment costs associated with CHP system implementation and the complexities involved in integrating these systems with existing infrastructure remain key restraints to wider market penetration.
Despite these challenges, the long-term outlook for the US CHP market remains positive. Continued advancements in technology, coupled with increasing regulatory pressure to reduce greenhouse gas emissions and enhance energy security, will significantly propel market growth. The shift towards decentralized energy generation and microgrids, where CHP systems play a vital role, presents significant opportunities for industry players. Furthermore, the growing demand for reliable and sustainable energy solutions across various sectors, including healthcare, data centers, and manufacturing, will further contribute to the industry's expansion in the coming years. The increasing adoption of smart grid technologies and the integration of CHP systems within these grids will also play a crucial role in shaping the future of the US CHP market.
US Combined Heat & Power (CHP) Industry Report: 2019-2033 Forecast
This comprehensive report delivers an in-depth analysis of the US Combined Heat and Power (CHP) industry, providing critical insights for strategic decision-making. With a study period spanning 2019-2033, a base year of 2025, and a forecast period of 2025-2033, this report offers a complete overview of market trends, competitive dynamics, and future growth potential. The US CHP market is estimated to be valued at $XX Million in 2025 and is projected to experience significant growth over the forecast period.
US Combined Heat and Power Industry Market Structure & Competitive Landscape
The US CHP market exhibits a moderately concentrated structure, with a few major players holding significant market share. The Herfindahl-Hirschman Index (HHI) is estimated at XX, indicating a moderately consolidated market. Key factors influencing this structure include economies of scale, technological advancements, and regulatory frameworks. Innovation is driven by the need for greater efficiency, lower emissions, and improved integration with renewable energy sources. Regulatory impacts, particularly environmental regulations and incentives for CHP adoption, are significant. Product substitutes, such as independent power generation and district heating systems, exert competitive pressure.
The end-user segmentation is diverse, encompassing industrial facilities, commercial buildings, and institutional sectors. Mergers and acquisitions (M&A) activity has been moderate in recent years, with approximately XX M&A deals recorded between 2019 and 2024, valued at an estimated $XX Million. Future M&A activity is anticipated to increase as companies seek to expand their market share and consolidate their technological capabilities.
- Market Concentration: Moderately concentrated (HHI: XX)
- Innovation Drivers: Efficiency gains, emissions reduction, renewable energy integration
- Regulatory Impacts: Environmental regulations, government incentives
- Product Substitutes: Independent power generation, district heating
- End-User Segmentation: Industrial, commercial, institutional
- M&A Trends: Moderate activity (XX deals, ~$XX Million 2019-2024), projected increase
US Combined Heat and Power Industry Market Trends & Opportunities
The US CHP market is experiencing robust growth, driven by increasing energy demand, stringent environmental regulations, and the rising adoption of renewable energy sources. The market is projected to exhibit a Compound Annual Growth Rate (CAGR) of XX% during the forecast period (2025-2033). Technological advancements, including the development of more efficient CHP systems and improved integration with smart grids, are key growth catalysts. Consumer preferences are shifting towards environmentally friendly and cost-effective energy solutions, furthering the adoption of CHP technologies. Intense competition among established players and new entrants is shaping the market dynamics, fostering innovation and price competitiveness. Market penetration rates for CHP are projected to reach XX% by 2033, driven primarily by the industrial sector.
Dominant Markets & Segments in US Combined Heat and Power Industry
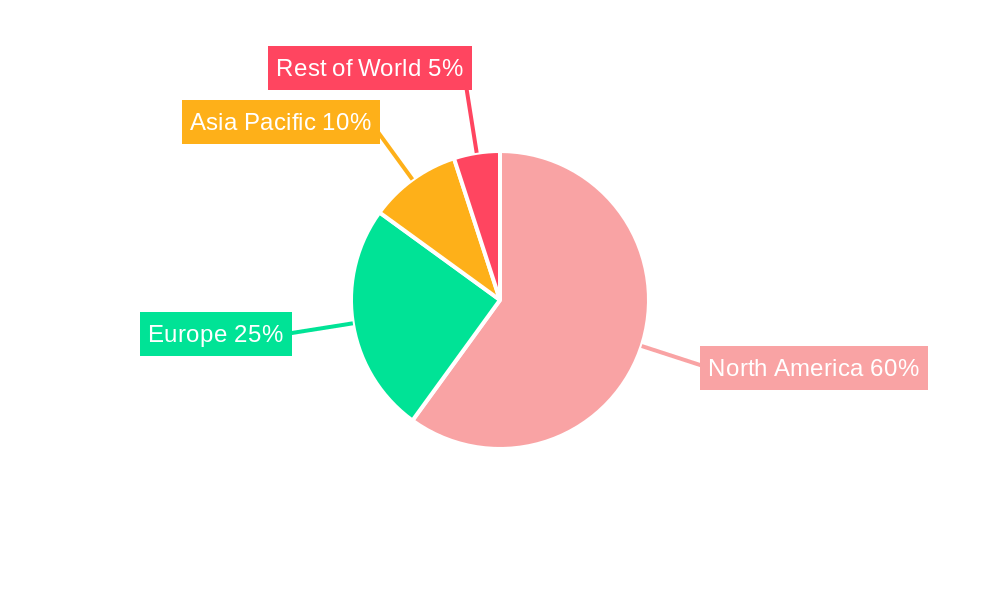
The industrial sector currently represents the largest segment of the US CHP market, accounting for approximately XX% of total market share in 2025. This is fueled by the increasing need for reliable and efficient on-site power generation in energy-intensive industries. The Northeast and Mid-Atlantic regions are currently the most dominant markets for CHP, driven by favorable regulatory policies, dense population centers, and strong industrial bases.
- Key Growth Drivers in the Industrial Sector:
- Increasing energy demand from industrial processes
- Stringent environmental regulations on industrial emissions
- Cost savings from on-site power generation
- Incentives for CHP adoption in industrial facilities
- Key Growth Drivers in the Northeast/Mid-Atlantic:
- Supportive regulatory environment and incentives
- High population density leading to higher energy demand
- Concentrated industrial base
- Existing infrastructure for CHP deployment
US Combined Heat and Power Industry Product Analysis
The US CHP market features a diverse range of products, encompassing gas turbines, reciprocating engines, and fuel cells. Recent innovations focus on improved efficiency, reduced emissions, and enhanced flexibility to integrate with renewable energy sources. Advanced control systems and digital technologies are being incorporated to optimize performance and reduce operational costs. The competitive advantage lies in offering high-efficiency systems with lower lifecycle costs and minimal environmental impact, tailored to specific end-user needs.
Key Drivers, Barriers & Challenges in US Combined Heat and Power Industry
Key Drivers:
- Stringent environmental regulations: Regulations limiting greenhouse gas emissions drive the adoption of cleaner energy sources, including CHP.
- Rising energy costs: The increasing cost of electricity motivates businesses to explore cost-effective solutions like on-site CHP generation.
- Technological advancements: Improved efficiency and reduced emissions from CHP systems make them increasingly attractive.
Challenges:
- High initial investment costs: The upfront cost of CHP systems can be a barrier to adoption, especially for smaller businesses. This represents approximately a XX% obstacle for smaller businesses.
- Complex regulatory landscape: Navigating permitting and regulatory compliance can be challenging and time-consuming.
- Competition from other distributed generation technologies: CHP faces competition from solar, wind, and other distributed generation options.
Growth Drivers in the US Combined Heat and Power Industry Market
Several factors are fueling growth in the US CHP market: increasing energy prices, stringent emission standards, and technological advancements that enhance efficiency and reduce emissions. Government incentives and policies supporting renewable energy integration further enhance adoption. The expanding industrial sector and growth in commercial and institutional buildings create significant demand for reliable and efficient energy solutions.
Challenges Impacting US Combined Heat and Power Industry Growth
High initial investment costs remain a major hurdle for many potential adopters. Furthermore, navigating complex regulatory requirements and dealing with supply chain disruptions pose significant challenges. Competition from other distributed generation technologies and potential grid integration issues also impact market growth.
Key Players Shaping the US Combined Heat and Power Industry Market
- 2G Energy Inc
- General Electric Company
- Aegis Energy Services Inc
- Caterpillar Inc
- Curtis Engine & Equipment Co Inc
- Yanmar America Corp
Significant US Combined Heat and Power Industry Industry Milestones
- 2020: Increased focus on integrating CHP with renewable energy sources.
- 2021: Several state-level incentives aimed at supporting CHP project development were implemented.
- 2022: Major technological advancements in CHP system efficiency were announced by several key players.
- 2023: Increased M&A activity within the CHP sector.
Future Outlook for US Combined Heat and Power Industry Market
The US CHP market is poised for continued growth, driven by sustained energy demand, stricter environmental regulations, and ongoing technological advancements. Strategic opportunities exist for companies to expand their market share by focusing on innovative technologies, cost-effective solutions, and improved integration with smart grids. The market's potential is substantial, with significant growth expected across various sectors and geographical regions.
US Combined Heat and Power Industry Segmentation
-
1. Applicaton
- 1.1. Commercial
- 1.2. Industrial
-
2. Fuel Type
- 2.1. Natural Gas
- 2.2. Renewable
- 2.3. Coal
- 2.4. Other Fuel Types
US Combined Heat and Power Industry Segmentation By Geography
-
1. North America
- 1.1. United States
- 1.2. Canada
- 1.3. Mexico
-
2. South America
- 2.1. Brazil
- 2.2. Argentina
- 2.3. Rest of South America
-
3. Europe
- 3.1. United Kingdom
- 3.2. Germany
- 3.3. France
- 3.4. Italy
- 3.5. Spain
- 3.6. Russia
- 3.7. Benelux
- 3.8. Nordics
- 3.9. Rest of Europe
-
4. Middle East & Africa
- 4.1. Turkey
- 4.2. Israel
- 4.3. GCC
- 4.4. North Africa
- 4.5. South Africa
- 4.6. Rest of Middle East & Africa
-
5. Asia Pacific
- 5.1. China
- 5.2. India
- 5.3. Japan
- 5.4. South Korea
- 5.5. ASEAN
- 5.6. Oceania
- 5.7. Rest of Asia Pacific
US Combined Heat and Power Industry REPORT HIGHLIGHTS
| Aspects | Details |
|---|---|
| Study Period | 2019-2033 |
| Base Year | 2024 |
| Estimated Year | 2025 |
| Forecast Period | 2025-2033 |
| Historical Period | 2019-2024 |
| Growth Rate | CAGR of > 7.00% from 2019-2033 |
| Segmentation |
|
Table of Contents
- 1. Introduction
- 1.1. Research Scope
- 1.2. Market Segmentation
- 1.3. Research Methodology
- 1.4. Definitions and Assumptions
- 2. Executive Summary
- 2.1. Introduction
- 3. Market Dynamics
- 3.1. Introduction
- 3.2. Market Drivers
- 3.3. Market Restrains
- 3.4. Market Trends
- 3.4.1. Natural Gas-based CHP is Expected to Dominate the Market
- 4. Market Factor Analysis
- 4.1. Porters Five Forces
- 4.2. Supply/Value Chain
- 4.3. PESTEL analysis
- 4.4. Market Entropy
- 4.5. Patent/Trademark Analysis
- 5. Global US Combined Heat and Power Industry Analysis, Insights and Forecast, 2019-2031
- 5.1. Market Analysis, Insights and Forecast - by Applicaton
- 5.1.1. Commercial
- 5.1.2. Industrial
- 5.2. Market Analysis, Insights and Forecast - by Fuel Type
- 5.2.1. Natural Gas
- 5.2.2. Renewable
- 5.2.3. Coal
- 5.2.4. Other Fuel Types
- 5.3. Market Analysis, Insights and Forecast - by Region
- 5.3.1. North America
- 5.3.2. South America
- 5.3.3. Europe
- 5.3.4. Middle East & Africa
- 5.3.5. Asia Pacific
- 5.1. Market Analysis, Insights and Forecast - by Applicaton
- 6. North America US Combined Heat and Power Industry Analysis, Insights and Forecast, 2019-2031
- 6.1. Market Analysis, Insights and Forecast - by Applicaton
- 6.1.1. Commercial
- 6.1.2. Industrial
- 6.2. Market Analysis, Insights and Forecast - by Fuel Type
- 6.2.1. Natural Gas
- 6.2.2. Renewable
- 6.2.3. Coal
- 6.2.4. Other Fuel Types
- 6.1. Market Analysis, Insights and Forecast - by Applicaton
- 7. South America US Combined Heat and Power Industry Analysis, Insights and Forecast, 2019-2031
- 7.1. Market Analysis, Insights and Forecast - by Applicaton
- 7.1.1. Commercial
- 7.1.2. Industrial
- 7.2. Market Analysis, Insights and Forecast - by Fuel Type
- 7.2.1. Natural Gas
- 7.2.2. Renewable
- 7.2.3. Coal
- 7.2.4. Other Fuel Types
- 7.1. Market Analysis, Insights and Forecast - by Applicaton
- 8. Europe US Combined Heat and Power Industry Analysis, Insights and Forecast, 2019-2031
- 8.1. Market Analysis, Insights and Forecast - by Applicaton
- 8.1.1. Commercial
- 8.1.2. Industrial
- 8.2. Market Analysis, Insights and Forecast - by Fuel Type
- 8.2.1. Natural Gas
- 8.2.2. Renewable
- 8.2.3. Coal
- 8.2.4. Other Fuel Types
- 8.1. Market Analysis, Insights and Forecast - by Applicaton
- 9. Middle East & Africa US Combined Heat and Power Industry Analysis, Insights and Forecast, 2019-2031
- 9.1. Market Analysis, Insights and Forecast - by Applicaton
- 9.1.1. Commercial
- 9.1.2. Industrial
- 9.2. Market Analysis, Insights and Forecast - by Fuel Type
- 9.2.1. Natural Gas
- 9.2.2. Renewable
- 9.2.3. Coal
- 9.2.4. Other Fuel Types
- 9.1. Market Analysis, Insights and Forecast - by Applicaton
- 10. Asia Pacific US Combined Heat and Power Industry Analysis, Insights and Forecast, 2019-2031
- 10.1. Market Analysis, Insights and Forecast - by Applicaton
- 10.1.1. Commercial
- 10.1.2. Industrial
- 10.2. Market Analysis, Insights and Forecast - by Fuel Type
- 10.2.1. Natural Gas
- 10.2.2. Renewable
- 10.2.3. Coal
- 10.2.4. Other Fuel Types
- 10.1. Market Analysis, Insights and Forecast - by Applicaton
- 11. Competitive Analysis
- 11.1. Global Market Share Analysis 2024
- 11.2. Company Profiles
- 11.2.1 2G Energy Inc
- 11.2.1.1. Overview
- 11.2.1.2. Products
- 11.2.1.3. SWOT Analysis
- 11.2.1.4. Recent Developments
- 11.2.1.5. Financials (Based on Availability)
- 11.2.2 General Electric Company
- 11.2.2.1. Overview
- 11.2.2.2. Products
- 11.2.2.3. SWOT Analysis
- 11.2.2.4. Recent Developments
- 11.2.2.5. Financials (Based on Availability)
- 11.2.3 Aegis Energy Services Inc
- 11.2.3.1. Overview
- 11.2.3.2. Products
- 11.2.3.3. SWOT Analysis
- 11.2.3.4. Recent Developments
- 11.2.3.5. Financials (Based on Availability)
- 11.2.4 Caterpillar Inc
- 11.2.4.1. Overview
- 11.2.4.2. Products
- 11.2.4.3. SWOT Analysis
- 11.2.4.4. Recent Developments
- 11.2.4.5. Financials (Based on Availability)
- 11.2.5 Curtis Engine & Equipment Co Inc
- 11.2.5.1. Overview
- 11.2.5.2. Products
- 11.2.5.3. SWOT Analysis
- 11.2.5.4. Recent Developments
- 11.2.5.5. Financials (Based on Availability)
- 11.2.6 Yanmar America Corp
- 11.2.6.1. Overview
- 11.2.6.2. Products
- 11.2.6.3. SWOT Analysis
- 11.2.6.4. Recent Developments
- 11.2.6.5. Financials (Based on Availability)
- 11.2.1 2G Energy Inc
List of Figures
- Figure 1: Global US Combined Heat and Power Industry Revenue Breakdown (Million, %) by Region 2024 & 2032
- Figure 2: North America US Combined Heat and Power Industry Revenue (Million), by Applicaton 2024 & 2032
- Figure 3: North America US Combined Heat and Power Industry Revenue Share (%), by Applicaton 2024 & 2032
- Figure 4: North America US Combined Heat and Power Industry Revenue (Million), by Fuel Type 2024 & 2032
- Figure 5: North America US Combined Heat and Power Industry Revenue Share (%), by Fuel Type 2024 & 2032
- Figure 6: North America US Combined Heat and Power Industry Revenue (Million), by Country 2024 & 2032
- Figure 7: North America US Combined Heat and Power Industry Revenue Share (%), by Country 2024 & 2032
- Figure 8: South America US Combined Heat and Power Industry Revenue (Million), by Applicaton 2024 & 2032
- Figure 9: South America US Combined Heat and Power Industry Revenue Share (%), by Applicaton 2024 & 2032
- Figure 10: South America US Combined Heat and Power Industry Revenue (Million), by Fuel Type 2024 & 2032
- Figure 11: South America US Combined Heat and Power Industry Revenue Share (%), by Fuel Type 2024 & 2032
- Figure 12: South America US Combined Heat and Power Industry Revenue (Million), by Country 2024 & 2032
- Figure 13: South America US Combined Heat and Power Industry Revenue Share (%), by Country 2024 & 2032
- Figure 14: Europe US Combined Heat and Power Industry Revenue (Million), by Applicaton 2024 & 2032
- Figure 15: Europe US Combined Heat and Power Industry Revenue Share (%), by Applicaton 2024 & 2032
- Figure 16: Europe US Combined Heat and Power Industry Revenue (Million), by Fuel Type 2024 & 2032
- Figure 17: Europe US Combined Heat and Power Industry Revenue Share (%), by Fuel Type 2024 & 2032
- Figure 18: Europe US Combined Heat and Power Industry Revenue (Million), by Country 2024 & 2032
- Figure 19: Europe US Combined Heat and Power Industry Revenue Share (%), by Country 2024 & 2032
- Figure 20: Middle East & Africa US Combined Heat and Power Industry Revenue (Million), by Applicaton 2024 & 2032
- Figure 21: Middle East & Africa US Combined Heat and Power Industry Revenue Share (%), by Applicaton 2024 & 2032
- Figure 22: Middle East & Africa US Combined Heat and Power Industry Revenue (Million), by Fuel Type 2024 & 2032
- Figure 23: Middle East & Africa US Combined Heat and Power Industry Revenue Share (%), by Fuel Type 2024 & 2032
- Figure 24: Middle East & Africa US Combined Heat and Power Industry Revenue (Million), by Country 2024 & 2032
- Figure 25: Middle East & Africa US Combined Heat and Power Industry Revenue Share (%), by Country 2024 & 2032
- Figure 26: Asia Pacific US Combined Heat and Power Industry Revenue (Million), by Applicaton 2024 & 2032
- Figure 27: Asia Pacific US Combined Heat and Power Industry Revenue Share (%), by Applicaton 2024 & 2032
- Figure 28: Asia Pacific US Combined Heat and Power Industry Revenue (Million), by Fuel Type 2024 & 2032
- Figure 29: Asia Pacific US Combined Heat and Power Industry Revenue Share (%), by Fuel Type 2024 & 2032
- Figure 30: Asia Pacific US Combined Heat and Power Industry Revenue (Million), by Country 2024 & 2032
- Figure 31: Asia Pacific US Combined Heat and Power Industry Revenue Share (%), by Country 2024 & 2032
List of Tables
- Table 1: Global US Combined Heat and Power Industry Revenue Million Forecast, by Region 2019 & 2032
- Table 2: Global US Combined Heat and Power Industry Revenue Million Forecast, by Applicaton 2019 & 2032
- Table 3: Global US Combined Heat and Power Industry Revenue Million Forecast, by Fuel Type 2019 & 2032
- Table 4: Global US Combined Heat and Power Industry Revenue Million Forecast, by Region 2019 & 2032
- Table 5: Global US Combined Heat and Power Industry Revenue Million Forecast, by Applicaton 2019 & 2032
- Table 6: Global US Combined Heat and Power Industry Revenue Million Forecast, by Fuel Type 2019 & 2032
- Table 7: Global US Combined Heat and Power Industry Revenue Million Forecast, by Country 2019 & 2032
- Table 8: United States US Combined Heat and Power Industry Revenue (Million) Forecast, by Application 2019 & 2032
- Table 9: Canada US Combined Heat and Power Industry Revenue (Million) Forecast, by Application 2019 & 2032
- Table 10: Mexico US Combined Heat and Power Industry Revenue (Million) Forecast, by Application 2019 & 2032
- Table 11: Global US Combined Heat and Power Industry Revenue Million Forecast, by Applicaton 2019 & 2032
- Table 12: Global US Combined Heat and Power Industry Revenue Million Forecast, by Fuel Type 2019 & 2032
- Table 13: Global US Combined Heat and Power Industry Revenue Million Forecast, by Country 2019 & 2032
- Table 14: Brazil US Combined Heat and Power Industry Revenue (Million) Forecast, by Application 2019 & 2032
- Table 15: Argentina US Combined Heat and Power Industry Revenue (Million) Forecast, by Application 2019 & 2032
- Table 16: Rest of South America US Combined Heat and Power Industry Revenue (Million) Forecast, by Application 2019 & 2032
- Table 17: Global US Combined Heat and Power Industry Revenue Million Forecast, by Applicaton 2019 & 2032
- Table 18: Global US Combined Heat and Power Industry Revenue Million Forecast, by Fuel Type 2019 & 2032
- Table 19: Global US Combined Heat and Power Industry Revenue Million Forecast, by Country 2019 & 2032
- Table 20: United Kingdom US Combined Heat and Power Industry Revenue (Million) Forecast, by Application 2019 & 2032
- Table 21: Germany US Combined Heat and Power Industry Revenue (Million) Forecast, by Application 2019 & 2032
- Table 22: France US Combined Heat and Power Industry Revenue (Million) Forecast, by Application 2019 & 2032
- Table 23: Italy US Combined Heat and Power Industry Revenue (Million) Forecast, by Application 2019 & 2032
- Table 24: Spain US Combined Heat and Power Industry Revenue (Million) Forecast, by Application 2019 & 2032
- Table 25: Russia US Combined Heat and Power Industry Revenue (Million) Forecast, by Application 2019 & 2032
- Table 26: Benelux US Combined Heat and Power Industry Revenue (Million) Forecast, by Application 2019 & 2032
- Table 27: Nordics US Combined Heat and Power Industry Revenue (Million) Forecast, by Application 2019 & 2032
- Table 28: Rest of Europe US Combined Heat and Power Industry Revenue (Million) Forecast, by Application 2019 & 2032
- Table 29: Global US Combined Heat and Power Industry Revenue Million Forecast, by Applicaton 2019 & 2032
- Table 30: Global US Combined Heat and Power Industry Revenue Million Forecast, by Fuel Type 2019 & 2032
- Table 31: Global US Combined Heat and Power Industry Revenue Million Forecast, by Country 2019 & 2032
- Table 32: Turkey US Combined Heat and Power Industry Revenue (Million) Forecast, by Application 2019 & 2032
- Table 33: Israel US Combined Heat and Power Industry Revenue (Million) Forecast, by Application 2019 & 2032
- Table 34: GCC US Combined Heat and Power Industry Revenue (Million) Forecast, by Application 2019 & 2032
- Table 35: North Africa US Combined Heat and Power Industry Revenue (Million) Forecast, by Application 2019 & 2032
- Table 36: South Africa US Combined Heat and Power Industry Revenue (Million) Forecast, by Application 2019 & 2032
- Table 37: Rest of Middle East & Africa US Combined Heat and Power Industry Revenue (Million) Forecast, by Application 2019 & 2032
- Table 38: Global US Combined Heat and Power Industry Revenue Million Forecast, by Applicaton 2019 & 2032
- Table 39: Global US Combined Heat and Power Industry Revenue Million Forecast, by Fuel Type 2019 & 2032
- Table 40: Global US Combined Heat and Power Industry Revenue Million Forecast, by Country 2019 & 2032
- Table 41: China US Combined Heat and Power Industry Revenue (Million) Forecast, by Application 2019 & 2032
- Table 42: India US Combined Heat and Power Industry Revenue (Million) Forecast, by Application 2019 & 2032
- Table 43: Japan US Combined Heat and Power Industry Revenue (Million) Forecast, by Application 2019 & 2032
- Table 44: South Korea US Combined Heat and Power Industry Revenue (Million) Forecast, by Application 2019 & 2032
- Table 45: ASEAN US Combined Heat and Power Industry Revenue (Million) Forecast, by Application 2019 & 2032
- Table 46: Oceania US Combined Heat and Power Industry Revenue (Million) Forecast, by Application 2019 & 2032
- Table 47: Rest of Asia Pacific US Combined Heat and Power Industry Revenue (Million) Forecast, by Application 2019 & 2032
Frequently Asked Questions
1. What is the projected Compound Annual Growth Rate (CAGR) of the US Combined Heat and Power Industry?
The projected CAGR is approximately > 7.00%.
2. Which companies are prominent players in the US Combined Heat and Power Industry?
Key companies in the market include 2G Energy Inc, General Electric Company, Aegis Energy Services Inc, Caterpillar Inc, Curtis Engine & Equipment Co Inc, Yanmar America Corp.
3. What are the main segments of the US Combined Heat and Power Industry?
The market segments include Applicaton, Fuel Type.
4. Can you provide details about the market size?
The market size is estimated to be USD XX Million as of 2022.
5. What are some drivers contributing to market growth?
N/A
6. What are the notable trends driving market growth?
Natural Gas-based CHP is Expected to Dominate the Market.
7. Are there any restraints impacting market growth?
N/A
8. Can you provide examples of recent developments in the market?
N/A
9. What pricing options are available for accessing the report?
Pricing options include single-user, multi-user, and enterprise licenses priced at USD 3800, USD 4500, and USD 5800 respectively.
10. Is the market size provided in terms of value or volume?
The market size is provided in terms of value, measured in Million.
11. Are there any specific market keywords associated with the report?
Yes, the market keyword associated with the report is "US Combined Heat and Power Industry," which aids in identifying and referencing the specific market segment covered.
12. How do I determine which pricing option suits my needs best?
The pricing options vary based on user requirements and access needs. Individual users may opt for single-user licenses, while businesses requiring broader access may choose multi-user or enterprise licenses for cost-effective access to the report.
13. Are there any additional resources or data provided in the US Combined Heat and Power Industry report?
While the report offers comprehensive insights, it's advisable to review the specific contents or supplementary materials provided to ascertain if additional resources or data are available.
14. How can I stay updated on further developments or reports in the US Combined Heat and Power Industry?
To stay informed about further developments, trends, and reports in the US Combined Heat and Power Industry, consider subscribing to industry newsletters, following relevant companies and organizations, or regularly checking reputable industry news sources and publications.
Methodology
Step 1 - Identification of Relevant Samples Size from Population Database


Step 2 - Approaches for Defining Global Market Size (Value, Volume* & Price*)

Note*: In applicable scenarios
Step 3 - Data Sources
Primary Research
- Web Analytics
- Survey Reports
- Research Institute
- Latest Research Reports
- Opinion Leaders
Secondary Research
- Annual Reports
- White Paper
- Latest Press Release
- Industry Association
- Paid Database
- Investor Presentations

Step 4 - Data Triangulation
Involves using different sources of information in order to increase the validity of a study
These sources are likely to be stakeholders in a program - participants, other researchers, program staff, other community members, and so on.
Then we put all data in single framework & apply various statistical tools to find out the dynamic on the market.
During the analysis stage, feedback from the stakeholder groups would be compared to determine areas of agreement as well as areas of divergence
