

Key Insights
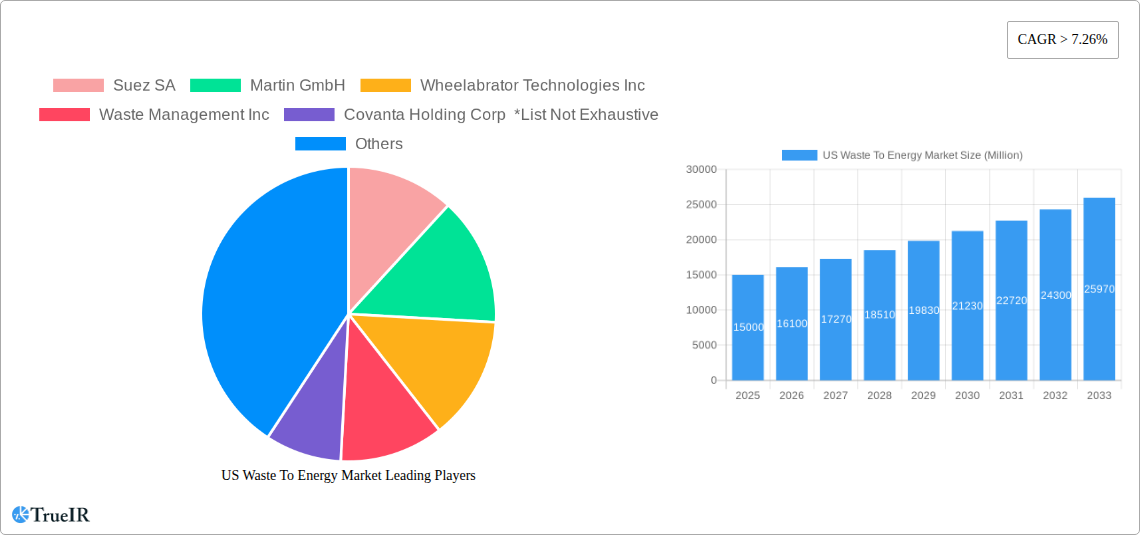
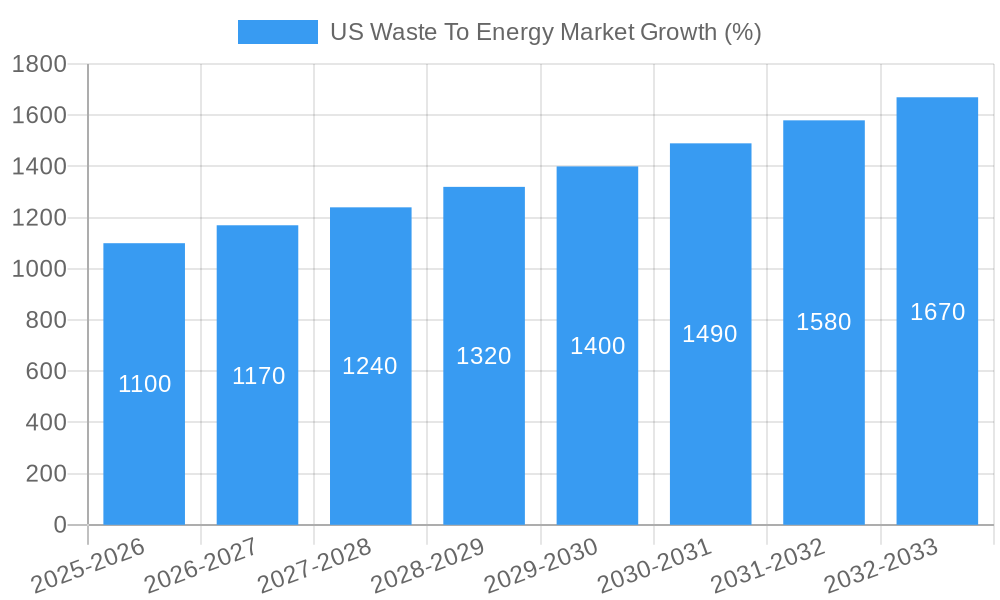
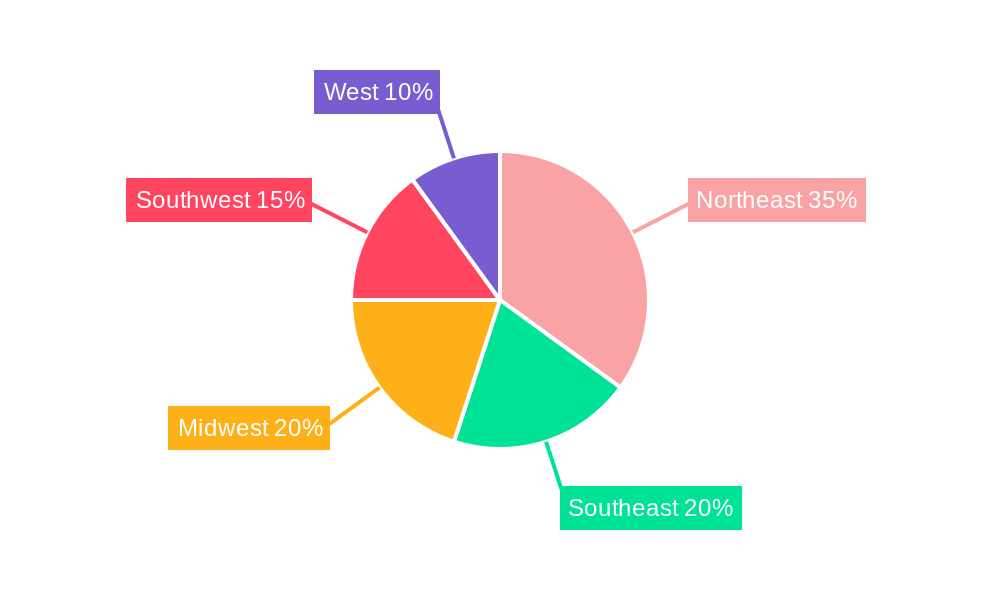
The US waste-to-energy market is experiencing robust growth, projected to maintain a CAGR exceeding 7.26% from 2025 to 2033. This expansion is fueled by several key drivers. Stringent environmental regulations aimed at reducing landfill waste and promoting sustainable waste management practices are significantly impacting market growth. Furthermore, the increasing awareness of climate change and the urgent need to decrease greenhouse gas emissions are creating a favorable environment for waste-to-energy technologies. Technological advancements in waste-to-energy conversion, including improvements in efficiency and reduced environmental impact, are also contributing to market expansion. The market is segmented by technology (physical, thermal, biological) and application (municipal solid waste, industrial waste, agricultural waste). The thermal conversion segment currently dominates due to its established infrastructure and relatively high efficiency, though biological technologies are witnessing rapid growth due to their potential for creating biofuels and compost. Significant regional variations exist within the US market, with the Northeast, driven by high population density and stringent environmental policies, currently holding a substantial market share. However, growth is anticipated across all regions, particularly in the Southeast and Southwest, as these areas increasingly adopt sustainable waste management strategies. The major players, such as Suez SA, Martin GmbH, Wheelabrator Technologies Inc, Waste Management Inc, and Covanta Holding Corp, are actively investing in capacity expansion and technological innovation to capitalize on this growing market. Competition is intense, leading to continuous improvement in technology and service offerings.
The forecast period of 2025-2033 presents significant opportunities for market participants. Continued investment in research and development will be crucial to further enhance the efficiency and environmental sustainability of waste-to-energy technologies. Addressing public concerns regarding potential environmental impacts, particularly emissions and ash management, will be vital for sustaining market growth. Successful market expansion will depend on collaborations between governments, private sector companies, and research institutions to create comprehensive waste management infrastructure and promote public awareness of the benefits of waste-to-energy. The market will also continue to see the integration of smart technologies, data analytics, and automation to improve operational efficiency and reduce costs, fostering growth and further investment in the sector.
US Waste-to-Energy Market Report: 2019-2033
This comprehensive report provides a detailed analysis of the US waste-to-energy market, offering invaluable insights for investors, industry professionals, and policymakers. Covering the period from 2019 to 2033, with a focus on 2025, this report unveils the market's structure, competitive landscape, dominant segments, and future outlook. The market is projected to reach xx Million by 2033, exhibiting a CAGR of xx% during the forecast period (2025-2033).
US Waste To Energy Market Market Structure & Competitive Landscape
The US waste-to-energy market is characterized by a moderately concentrated structure, with several key players vying for market share. The Herfindahl-Hirschman Index (HHI) is estimated at xx, indicating a moderately consolidated market. Key players, including Suez SA, Martin GmbH, Wheelabrator Technologies Inc, Waste Management Inc, and Covanta Holding Corp (list not exhaustive), compete primarily based on technology offerings, geographic reach, and project development capabilities. Innovation is a major driver, with ongoing advancements in thermal, biological, and physical waste-to-energy technologies. Regulatory pressures, particularly concerning environmental compliance and emissions standards, significantly influence market dynamics. Product substitution, primarily from landfills and other waste management methods, presents a continuous competitive challenge. The market witnesses consistent end-user segmentation, with municipal solid waste currently dominating, followed by industrial and agricultural waste. Mergers and acquisitions (M&A) activity has been moderate in recent years, with xx M&A deals recorded between 2019 and 2024, primarily focused on expanding geographic reach and technological capabilities. Future M&A activity is anticipated to increase driven by the need for scale and technological expertise in this growing market.
US Waste To Energy Market Market Trends & Opportunities
The US waste-to-energy market exhibits robust growth potential, driven by several key factors. The market size is projected to expand from xx Million in 2025 to xx Million by 2033, fueled by increasing volumes of municipal solid waste, stringent landfill regulations, rising energy costs, and growing awareness of environmental sustainability. Technological advancements, particularly in advanced thermal and biological treatment methods, are enhancing efficiency, reducing emissions, and unlocking new revenue streams. Consumer preferences are shifting towards sustainable waste management solutions, creating strong demand for waste-to-energy technologies. Competitive dynamics are shaped by ongoing technological innovation, strategic partnerships, and M&A activity. Market penetration rates for waste-to-energy are projected to increase from xx% in 2025 to xx% by 2033, driven by government incentives and favorable regulatory frameworks in certain states. The increasing adoption of renewable energy mandates and carbon reduction targets further accelerate the market growth. Opportunities abound in optimizing existing facilities, exploring new waste streams (e.g., agricultural residues), and integrating waste-to-energy with other renewable energy sources.
Dominant Markets & Segments in US Waste To Energy Market
The Northeast and West Coast regions currently dominate the US waste-to-energy market due to existing infrastructure, favorable policies, and higher waste generation rates. Within technology segments, thermal conversion technologies, particularly incineration with energy recovery, hold the largest market share, reflecting established infrastructure and economies of scale. Municipal solid waste remains the largest application segment, driven by the massive volume of waste generated by urban areas.
- Key Growth Drivers for Northeast & West Coast Regions:
- Existing waste-to-energy infrastructure.
- Stringent landfill regulations.
- Supportive state-level policies and incentives.
- Higher population density and waste generation.
- Key Growth Drivers for Thermal Conversion Technology:
- Mature technology with proven efficiency.
- Economies of scale in large-scale facilities.
- Established supply chains and expertise.
- Key Growth Drivers for Municipal Solid Waste Application:
- High volume of waste generated in urban areas.
- Growing awareness of environmental sustainability.
- Increasing landfill costs and capacity constraints.
The market is poised for significant growth in the South and Midwest regions as policies and infrastructure development catch up with the more developed areas. Biological and physical technologies are expected to gain traction as innovation improves their competitiveness and address specific waste streams effectively. Industrial and agricultural waste segments will see increasing adoption as waste-to-energy technology becomes more specialized and economical for these sectors.
US Waste To Energy Market Product Analysis
The US waste-to-energy market features a diverse range of technologies, including incineration with energy recovery, anaerobic digestion, gasification, and pyrolysis. These technologies cater to various waste streams and offer varying levels of efficiency, energy output, and emissions reduction. Competitive advantages are derived from technological innovation, operational efficiency, and strategic partnerships. Recent advancements focus on improving energy recovery, reducing emissions, and creating valuable byproducts from waste processing. The market is witnessing increasing demand for modular and smaller-scale systems, particularly for remote areas or specific waste streams. The market is also focusing on improved waste sorting technologies to streamline the processing and maximize the efficiency of waste-to-energy conversion.
Key Drivers, Barriers & Challenges in US Waste To Energy Market
Key Drivers:
Increasing volumes of municipal solid waste, stricter environmental regulations, rising energy costs, growing public awareness of environmental sustainability, and technological advancements drive market expansion. Government incentives such as tax credits and grants further encourage investment in waste-to-energy projects. Recent state-level initiatives such as the Florida financial assistance program for power purchase agreements are a clear example of policy-driven growth.
Challenges:
High capital costs associated with establishing waste-to-energy facilities are a significant barrier. Public perception and concerns about potential environmental impacts (e.g., emissions and ash disposal) remain a hurdle. Complex regulatory processes and permitting requirements can delay project development and increase costs. Competition from other waste management methods (e.g., landfills) and fluctuating energy prices also impact market growth. Supply chain disruptions can lead to project delays and increased costs. This has been evidenced in recent years with the impact of the COVID-19 pandemic.
Growth Drivers in the US Waste To Energy Market Market
Technological advancements, coupled with supportive government policies and rising energy prices, are key growth drivers. The increasing volume of waste generated in densely populated urban areas is a key contributing factor.
Challenges Impacting US Waste To Energy Market Growth
High capital expenditure, stringent environmental regulations, potential community opposition, and competition from alternative waste management technologies are primary challenges. Supply chain constraints, especially regarding specialized equipment, can also hinder growth.
Key Players Shaping the US Waste To Energy Market Market
- Suez SA
- Martin GmbH
- Wheelabrator Technologies Inc
- Waste Management Inc
- Covanta Holding Corp
- List Not Exhaustive
Significant US Waste To Energy Market Industry Milestones
- June 2022: Florida establishes a financial assistance program for power purchase agreements at municipally-owned solid waste combustion facilities and provides grants for capacity expansion. This significantly boosted investment in the sector.
- October 2022: Kore Infrastructure successfully demonstrates its modular waste-to-energy system in Los Angeles, showcasing a carbon-negative approach to waste management and energy production. This marked a significant advancement in the technology and broadened the range of potential applications.
Future Outlook for US Waste To Energy Market Market
The US waste-to-energy market is poised for continued growth, driven by technological advancements, supportive government policies, and the increasing urgency to address waste management challenges and carbon reduction targets. Strategic partnerships and investments in innovative technologies will be vital for future success in the market. The expanding focus on circular economy principles and the potential to recover valuable resources from waste streams present further opportunities. The market is anticipated to expand at a robust pace, particularly in states that offer incentives and have stricter regulations on landfill disposal.
US Waste To Energy Market Segmentation
-
1. Technology
- 1.1. Physical
- 1.2. Thermal
- 1.3. Biological
US Waste To Energy Market Segmentation By Geography
-
1. North America
- 1.1. United States
- 1.2. Canada
- 1.3. Mexico
-
2. South America
- 2.1. Brazil
- 2.2. Argentina
- 2.3. Rest of South America
-
3. Europe
- 3.1. United Kingdom
- 3.2. Germany
- 3.3. France
- 3.4. Italy
- 3.5. Spain
- 3.6. Russia
- 3.7. Benelux
- 3.8. Nordics
- 3.9. Rest of Europe
-
4. Middle East & Africa
- 4.1. Turkey
- 4.2. Israel
- 4.3. GCC
- 4.4. North Africa
- 4.5. South Africa
- 4.6. Rest of Middle East & Africa
-
5. Asia Pacific
- 5.1. China
- 5.2. India
- 5.3. Japan
- 5.4. South Korea
- 5.5. ASEAN
- 5.6. Oceania
- 5.7. Rest of Asia Pacific
US Waste To Energy Market REPORT HIGHLIGHTS
| Aspects | Details |
|---|---|
| Study Period | 2019-2033 |
| Base Year | 2024 |
| Estimated Year | 2025 |
| Forecast Period | 2025-2033 |
| Historical Period | 2019-2024 |
| Growth Rate | CAGR of > 7.26% from 2019-2033 |
| Segmentation |
|
Table of Contents
- 1. Introduction
- 1.1. Research Scope
- 1.2. Market Segmentation
- 1.3. Research Methodology
- 1.4. Definitions and Assumptions
- 2. Executive Summary
- 2.1. Introduction
- 3. Market Dynamics
- 3.1. Introduction
- 3.2. Market Drivers
- 3.2.1. 4.; Global Inclination toward Renewable-based Power Generation4.; Increased Power Demand in Line with the Increasing Population
- 3.3. Market Restrains
- 3.3.1. 4.; High Initial Cost
- 3.4. Market Trends
- 3.4.1. Thermal Based Waste to Energy Conversion to Dominate the Market
- 4. Market Factor Analysis
- 4.1. Porters Five Forces
- 4.2. Supply/Value Chain
- 4.3. PESTEL analysis
- 4.4. Market Entropy
- 4.5. Patent/Trademark Analysis
- 5. Global US Waste To Energy Market Analysis, Insights and Forecast, 2019-2031
- 5.1. Market Analysis, Insights and Forecast - by Technology
- 5.1.1. Physical
- 5.1.2. Thermal
- 5.1.3. Biological
- 5.2. Market Analysis, Insights and Forecast - by Region
- 5.2.1. North America
- 5.2.2. South America
- 5.2.3. Europe
- 5.2.4. Middle East & Africa
- 5.2.5. Asia Pacific
- 5.1. Market Analysis, Insights and Forecast - by Technology
- 6. North America US Waste To Energy Market Analysis, Insights and Forecast, 2019-2031
- 6.1. Market Analysis, Insights and Forecast - by Technology
- 6.1.1. Physical
- 6.1.2. Thermal
- 6.1.3. Biological
- 6.1. Market Analysis, Insights and Forecast - by Technology
- 7. South America US Waste To Energy Market Analysis, Insights and Forecast, 2019-2031
- 7.1. Market Analysis, Insights and Forecast - by Technology
- 7.1.1. Physical
- 7.1.2. Thermal
- 7.1.3. Biological
- 7.1. Market Analysis, Insights and Forecast - by Technology
- 8. Europe US Waste To Energy Market Analysis, Insights and Forecast, 2019-2031
- 8.1. Market Analysis, Insights and Forecast - by Technology
- 8.1.1. Physical
- 8.1.2. Thermal
- 8.1.3. Biological
- 8.1. Market Analysis, Insights and Forecast - by Technology
- 9. Middle East & Africa US Waste To Energy Market Analysis, Insights and Forecast, 2019-2031
- 9.1. Market Analysis, Insights and Forecast - by Technology
- 9.1.1. Physical
- 9.1.2. Thermal
- 9.1.3. Biological
- 9.1. Market Analysis, Insights and Forecast - by Technology
- 10. Asia Pacific US Waste To Energy Market Analysis, Insights and Forecast, 2019-2031
- 10.1. Market Analysis, Insights and Forecast - by Technology
- 10.1.1. Physical
- 10.1.2. Thermal
- 10.1.3. Biological
- 10.1. Market Analysis, Insights and Forecast - by Technology
- 11. Northeast US Waste To Energy Market Analysis, Insights and Forecast, 2019-2031
- 12. Southeast US Waste To Energy Market Analysis, Insights and Forecast, 2019-2031
- 13. Midwest US Waste To Energy Market Analysis, Insights and Forecast, 2019-2031
- 14. Southwest US Waste To Energy Market Analysis, Insights and Forecast, 2019-2031
- 15. West US Waste To Energy Market Analysis, Insights and Forecast, 2019-2031
- 16. Competitive Analysis
- 16.1. Global Market Share Analysis 2024
- 16.2. Company Profiles
- 16.2.1 Suez SA
- 16.2.1.1. Overview
- 16.2.1.2. Products
- 16.2.1.3. SWOT Analysis
- 16.2.1.4. Recent Developments
- 16.2.1.5. Financials (Based on Availability)
- 16.2.2 Martin GmbH
- 16.2.2.1. Overview
- 16.2.2.2. Products
- 16.2.2.3. SWOT Analysis
- 16.2.2.4. Recent Developments
- 16.2.2.5. Financials (Based on Availability)
- 16.2.3 Wheelabrator Technologies Inc
- 16.2.3.1. Overview
- 16.2.3.2. Products
- 16.2.3.3. SWOT Analysis
- 16.2.3.4. Recent Developments
- 16.2.3.5. Financials (Based on Availability)
- 16.2.4 Waste Management Inc
- 16.2.4.1. Overview
- 16.2.4.2. Products
- 16.2.4.3. SWOT Analysis
- 16.2.4.4. Recent Developments
- 16.2.4.5. Financials (Based on Availability)
- 16.2.5 Covanta Holding Corp *List Not Exhaustive
- 16.2.5.1. Overview
- 16.2.5.2. Products
- 16.2.5.3. SWOT Analysis
- 16.2.5.4. Recent Developments
- 16.2.5.5. Financials (Based on Availability)
- 16.2.1 Suez SA
List of Figures
- Figure 1: Global US Waste To Energy Market Revenue Breakdown (Million, %) by Region 2024 & 2032
- Figure 2: United states US Waste To Energy Market Revenue (Million), by Country 2024 & 2032
- Figure 3: United states US Waste To Energy Market Revenue Share (%), by Country 2024 & 2032
- Figure 4: North America US Waste To Energy Market Revenue (Million), by Technology 2024 & 2032
- Figure 5: North America US Waste To Energy Market Revenue Share (%), by Technology 2024 & 2032
- Figure 6: North America US Waste To Energy Market Revenue (Million), by Country 2024 & 2032
- Figure 7: North America US Waste To Energy Market Revenue Share (%), by Country 2024 & 2032
- Figure 8: South America US Waste To Energy Market Revenue (Million), by Technology 2024 & 2032
- Figure 9: South America US Waste To Energy Market Revenue Share (%), by Technology 2024 & 2032
- Figure 10: South America US Waste To Energy Market Revenue (Million), by Country 2024 & 2032
- Figure 11: South America US Waste To Energy Market Revenue Share (%), by Country 2024 & 2032
- Figure 12: Europe US Waste To Energy Market Revenue (Million), by Technology 2024 & 2032
- Figure 13: Europe US Waste To Energy Market Revenue Share (%), by Technology 2024 & 2032
- Figure 14: Europe US Waste To Energy Market Revenue (Million), by Country 2024 & 2032
- Figure 15: Europe US Waste To Energy Market Revenue Share (%), by Country 2024 & 2032
- Figure 16: Middle East & Africa US Waste To Energy Market Revenue (Million), by Technology 2024 & 2032
- Figure 17: Middle East & Africa US Waste To Energy Market Revenue Share (%), by Technology 2024 & 2032
- Figure 18: Middle East & Africa US Waste To Energy Market Revenue (Million), by Country 2024 & 2032
- Figure 19: Middle East & Africa US Waste To Energy Market Revenue Share (%), by Country 2024 & 2032
- Figure 20: Asia Pacific US Waste To Energy Market Revenue (Million), by Technology 2024 & 2032
- Figure 21: Asia Pacific US Waste To Energy Market Revenue Share (%), by Technology 2024 & 2032
- Figure 22: Asia Pacific US Waste To Energy Market Revenue (Million), by Country 2024 & 2032
- Figure 23: Asia Pacific US Waste To Energy Market Revenue Share (%), by Country 2024 & 2032
List of Tables
- Table 1: Global US Waste To Energy Market Revenue Million Forecast, by Region 2019 & 2032
- Table 2: Global US Waste To Energy Market Revenue Million Forecast, by Technology 2019 & 2032
- Table 3: Global US Waste To Energy Market Revenue Million Forecast, by Region 2019 & 2032
- Table 4: Global US Waste To Energy Market Revenue Million Forecast, by Country 2019 & 2032
- Table 5: Northeast US Waste To Energy Market Revenue (Million) Forecast, by Application 2019 & 2032
- Table 6: Southeast US Waste To Energy Market Revenue (Million) Forecast, by Application 2019 & 2032
- Table 7: Midwest US Waste To Energy Market Revenue (Million) Forecast, by Application 2019 & 2032
- Table 8: Southwest US Waste To Energy Market Revenue (Million) Forecast, by Application 2019 & 2032
- Table 9: West US Waste To Energy Market Revenue (Million) Forecast, by Application 2019 & 2032
- Table 10: Global US Waste To Energy Market Revenue Million Forecast, by Technology 2019 & 2032
- Table 11: Global US Waste To Energy Market Revenue Million Forecast, by Country 2019 & 2032
- Table 12: United States US Waste To Energy Market Revenue (Million) Forecast, by Application 2019 & 2032
- Table 13: Canada US Waste To Energy Market Revenue (Million) Forecast, by Application 2019 & 2032
- Table 14: Mexico US Waste To Energy Market Revenue (Million) Forecast, by Application 2019 & 2032
- Table 15: Global US Waste To Energy Market Revenue Million Forecast, by Technology 2019 & 2032
- Table 16: Global US Waste To Energy Market Revenue Million Forecast, by Country 2019 & 2032
- Table 17: Brazil US Waste To Energy Market Revenue (Million) Forecast, by Application 2019 & 2032
- Table 18: Argentina US Waste To Energy Market Revenue (Million) Forecast, by Application 2019 & 2032
- Table 19: Rest of South America US Waste To Energy Market Revenue (Million) Forecast, by Application 2019 & 2032
- Table 20: Global US Waste To Energy Market Revenue Million Forecast, by Technology 2019 & 2032
- Table 21: Global US Waste To Energy Market Revenue Million Forecast, by Country 2019 & 2032
- Table 22: United Kingdom US Waste To Energy Market Revenue (Million) Forecast, by Application 2019 & 2032
- Table 23: Germany US Waste To Energy Market Revenue (Million) Forecast, by Application 2019 & 2032
- Table 24: France US Waste To Energy Market Revenue (Million) Forecast, by Application 2019 & 2032
- Table 25: Italy US Waste To Energy Market Revenue (Million) Forecast, by Application 2019 & 2032
- Table 26: Spain US Waste To Energy Market Revenue (Million) Forecast, by Application 2019 & 2032
- Table 27: Russia US Waste To Energy Market Revenue (Million) Forecast, by Application 2019 & 2032
- Table 28: Benelux US Waste To Energy Market Revenue (Million) Forecast, by Application 2019 & 2032
- Table 29: Nordics US Waste To Energy Market Revenue (Million) Forecast, by Application 2019 & 2032
- Table 30: Rest of Europe US Waste To Energy Market Revenue (Million) Forecast, by Application 2019 & 2032
- Table 31: Global US Waste To Energy Market Revenue Million Forecast, by Technology 2019 & 2032
- Table 32: Global US Waste To Energy Market Revenue Million Forecast, by Country 2019 & 2032
- Table 33: Turkey US Waste To Energy Market Revenue (Million) Forecast, by Application 2019 & 2032
- Table 34: Israel US Waste To Energy Market Revenue (Million) Forecast, by Application 2019 & 2032
- Table 35: GCC US Waste To Energy Market Revenue (Million) Forecast, by Application 2019 & 2032
- Table 36: North Africa US Waste To Energy Market Revenue (Million) Forecast, by Application 2019 & 2032
- Table 37: South Africa US Waste To Energy Market Revenue (Million) Forecast, by Application 2019 & 2032
- Table 38: Rest of Middle East & Africa US Waste To Energy Market Revenue (Million) Forecast, by Application 2019 & 2032
- Table 39: Global US Waste To Energy Market Revenue Million Forecast, by Technology 2019 & 2032
- Table 40: Global US Waste To Energy Market Revenue Million Forecast, by Country 2019 & 2032
- Table 41: China US Waste To Energy Market Revenue (Million) Forecast, by Application 2019 & 2032
- Table 42: India US Waste To Energy Market Revenue (Million) Forecast, by Application 2019 & 2032
- Table 43: Japan US Waste To Energy Market Revenue (Million) Forecast, by Application 2019 & 2032
- Table 44: South Korea US Waste To Energy Market Revenue (Million) Forecast, by Application 2019 & 2032
- Table 45: ASEAN US Waste To Energy Market Revenue (Million) Forecast, by Application 2019 & 2032
- Table 46: Oceania US Waste To Energy Market Revenue (Million) Forecast, by Application 2019 & 2032
- Table 47: Rest of Asia Pacific US Waste To Energy Market Revenue (Million) Forecast, by Application 2019 & 2032
Frequently Asked Questions
1. What is the projected Compound Annual Growth Rate (CAGR) of the US Waste To Energy Market?
The projected CAGR is approximately > 7.26%.
2. Which companies are prominent players in the US Waste To Energy Market?
Key companies in the market include Suez SA, Martin GmbH, Wheelabrator Technologies Inc, Waste Management Inc, Covanta Holding Corp *List Not Exhaustive.
3. What are the main segments of the US Waste To Energy Market?
The market segments include Technology.
4. Can you provide details about the market size?
The market size is estimated to be USD XX Million as of 2022.
5. What are some drivers contributing to market growth?
4.; Global Inclination toward Renewable-based Power Generation4.; Increased Power Demand in Line with the Increasing Population.
6. What are the notable trends driving market growth?
Thermal Based Waste to Energy Conversion to Dominate the Market.
7. Are there any restraints impacting market growth?
4.; High Initial Cost.
8. Can you provide examples of recent developments in the market?
October 2022: Kore Infrastructure announced the successful one-year demonstration of its waste-to-energy modular system in Los Angeles, California. The company's technology can produce 100% renewable energy from organic waste using a closed-loop, carbon-negative process.
9. What pricing options are available for accessing the report?
Pricing options include single-user, multi-user, and enterprise licenses priced at USD 3800, USD 4500, and USD 5800 respectively.
10. Is the market size provided in terms of value or volume?
The market size is provided in terms of value, measured in Million.
11. Are there any specific market keywords associated with the report?
Yes, the market keyword associated with the report is "US Waste To Energy Market," which aids in identifying and referencing the specific market segment covered.
12. How do I determine which pricing option suits my needs best?
The pricing options vary based on user requirements and access needs. Individual users may opt for single-user licenses, while businesses requiring broader access may choose multi-user or enterprise licenses for cost-effective access to the report.
13. Are there any additional resources or data provided in the US Waste To Energy Market report?
While the report offers comprehensive insights, it's advisable to review the specific contents or supplementary materials provided to ascertain if additional resources or data are available.
14. How can I stay updated on further developments or reports in the US Waste To Energy Market?
To stay informed about further developments, trends, and reports in the US Waste To Energy Market, consider subscribing to industry newsletters, following relevant companies and organizations, or regularly checking reputable industry news sources and publications.
Methodology
Step 1 - Identification of Relevant Samples Size from Population Database


Step 2 - Approaches for Defining Global Market Size (Value, Volume* & Price*)

Note*: In applicable scenarios
Step 3 - Data Sources
Primary Research
- Web Analytics
- Survey Reports
- Research Institute
- Latest Research Reports
- Opinion Leaders
Secondary Research
- Annual Reports
- White Paper
- Latest Press Release
- Industry Association
- Paid Database
- Investor Presentations

Step 4 - Data Triangulation
Involves using different sources of information in order to increase the validity of a study
These sources are likely to be stakeholders in a program - participants, other researchers, program staff, other community members, and so on.
Then we put all data in single framework & apply various statistical tools to find out the dynamic on the market.
During the analysis stage, feedback from the stakeholder groups would be compared to determine areas of agreement as well as areas of divergence
