

Key Insights
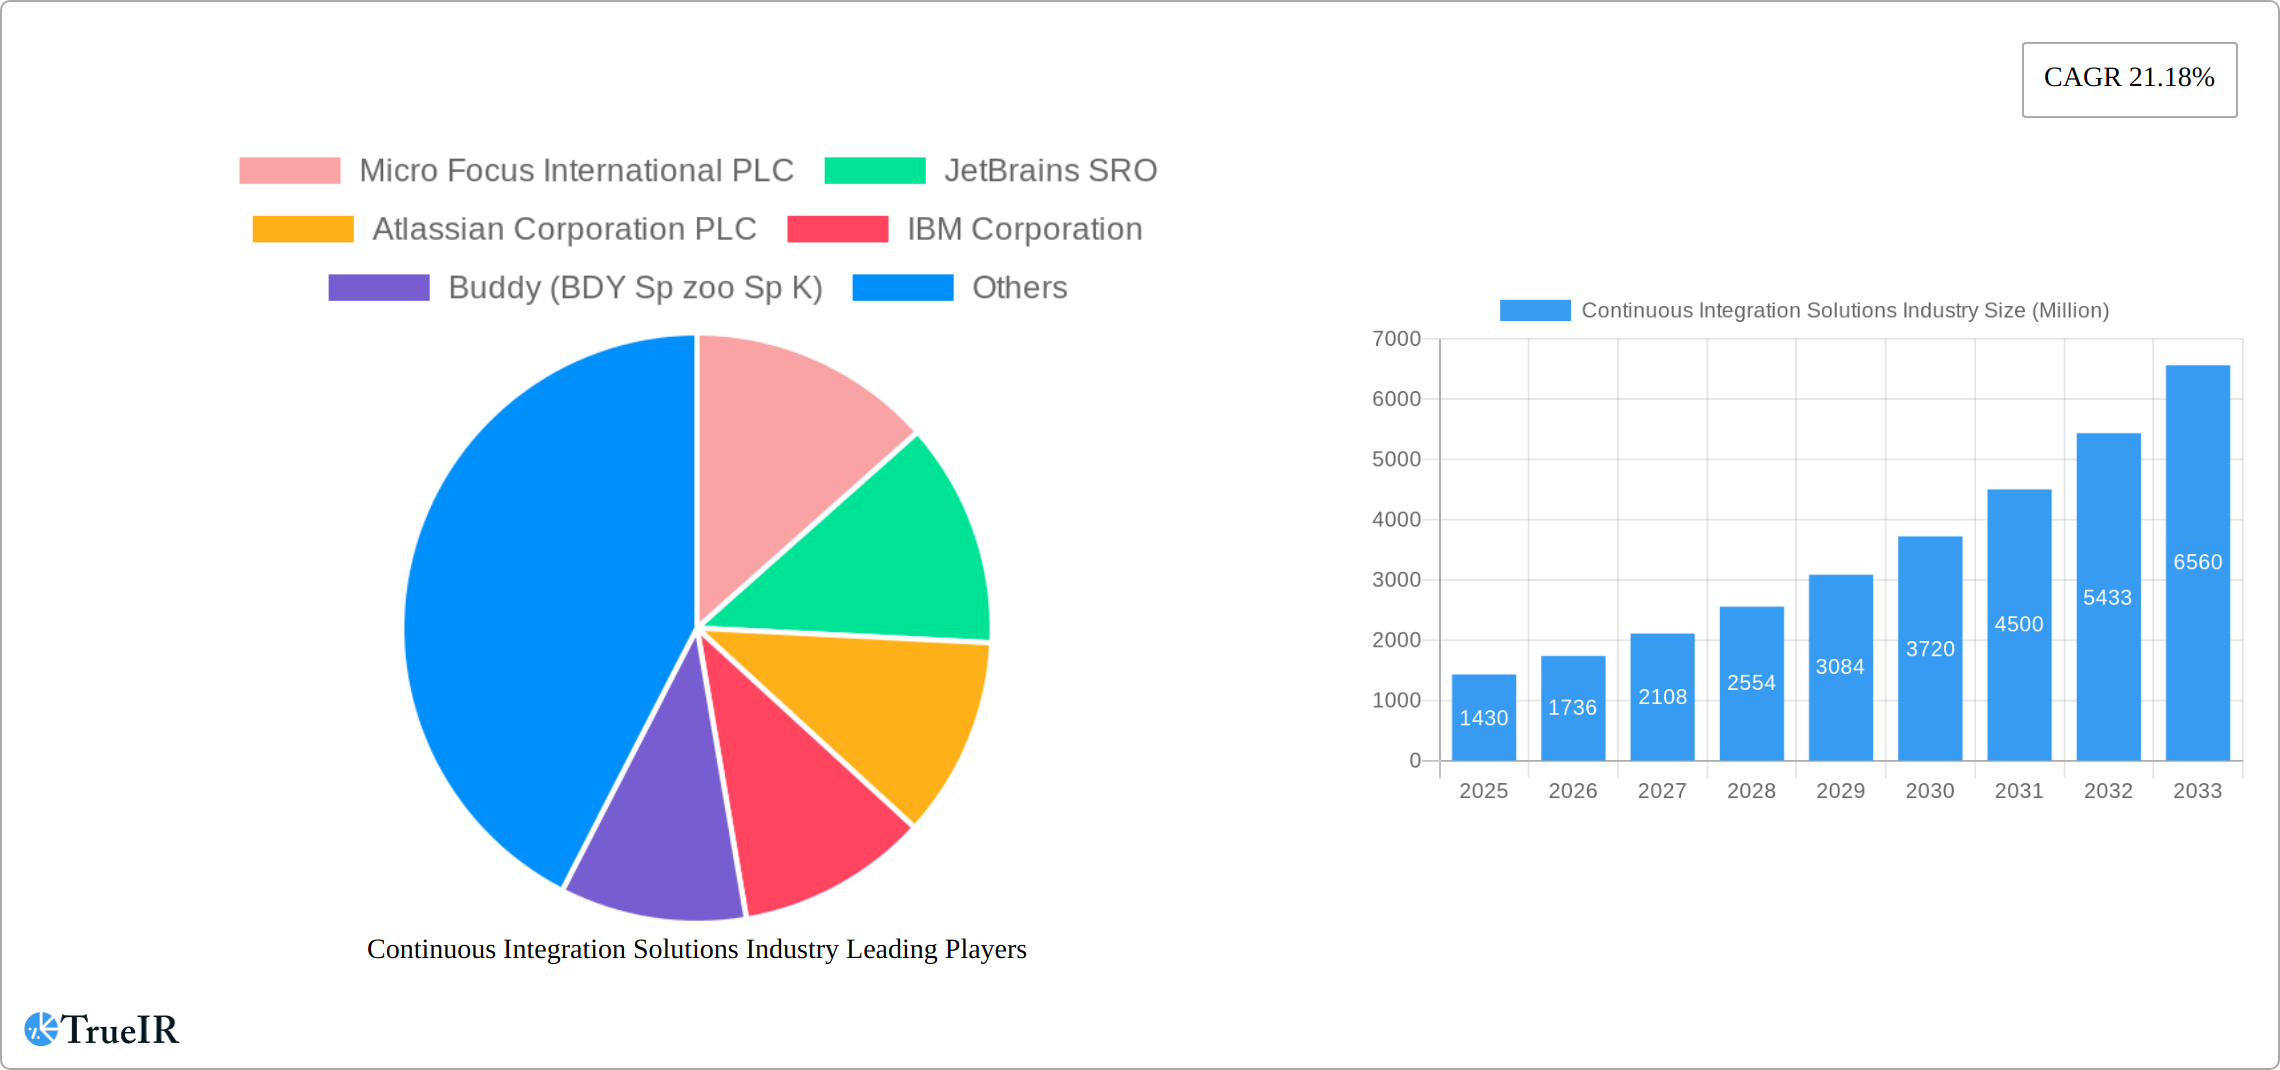
The Continuous Integration (CI) Solutions market is experiencing robust growth, projected to reach $1.43 billion in 2025 and maintain a Compound Annual Growth Rate (CAGR) of 21.18% from 2025 to 2033. This expansion is driven by several key factors. The increasing adoption of DevOps methodologies across various industries, including IT and Telecom, Retail and E-commerce, Healthcare and Life Sciences, BFSI, and Media and Entertainment, necessitates efficient and automated software development processes. CI solutions play a crucial role in streamlining these processes, accelerating software delivery cycles, and improving software quality. Furthermore, the rising complexity of software applications and the growing demand for faster time-to-market are fueling the demand for sophisticated CI/CD pipelines. The shift towards cloud-based deployments is also a significant driver, offering scalability, cost-effectiveness, and enhanced accessibility. However, challenges such as integration complexities with legacy systems, security concerns related to cloud-based CI/CD pipelines, and the need for skilled professionals to manage and maintain these systems represent potential restraints to market growth.
The market segmentation reveals a strong preference for cloud-based deployments, reflecting the broader industry trend towards cloud adoption. Among end-user industries, IT and Telecom currently hold the largest market share, followed by Retail and E-commerce. However, the Healthcare and Life Sciences sector is expected to witness significant growth in the coming years due to increasing digitalization and the adoption of advanced technologies in this sector. Geographically, North America currently dominates the market, but the Asia-Pacific region is poised for rapid expansion, driven by factors such as increasing digital adoption and a large pool of software developers. Competition in the market is intense, with major players such as Micro Focus, JetBrains, Atlassian, IBM, and Microsoft competing alongside emerging agile companies. The market's future trajectory indicates continued high growth, propelled by technological advancements and increasing demand for seamless software delivery across industries.
Continuous Integration Solutions Industry Market Report: 2019-2033
This comprehensive report provides a detailed analysis of the Continuous Integration (CI) Solutions industry, projecting a market size exceeding $XX Million by 2033. The study covers the historical period (2019-2024), the base year (2025), and forecasts until 2033, offering invaluable insights for businesses and investors navigating this dynamic sector. Leveraging extensive market research and data analysis, this report identifies key trends, opportunities, and challenges shaping the future of CI solutions.
Continuous Integration Solutions Industry Market Structure & Competitive Landscape
The Continuous Integration Solutions market exhibits a moderately consolidated structure, with a handful of major players commanding significant market share. While precise concentration ratios require further data analysis, estimates suggest a Herfindahl-Hirschman Index (HHI) in the range of xx, indicating a moderately competitive environment. However, the market is characterized by strong innovation drivers, such as the increasing adoption of DevOps methodologies and the rise of cloud-native applications. This fuels a competitive landscape characterized by frequent product releases and technological advancements, fostering a dynamic evolution.
Regulatory impacts, particularly concerning data privacy and security compliance, play a crucial role in shaping market dynamics. The emergence of open-source CI/CD tools and their increasing maturity presents a strong substitute threat to proprietary solutions. The end-user segmentation is diverse, encompassing IT & Telecom, Retail & E-commerce, Healthcare & Life Sciences, BFSI, Media & Entertainment, and other sectors, each with unique requirements and deployment preferences.
Mergers and acquisitions (M&A) activity has been relatively moderate in recent years, with a total volume of approximately xx M&A deals between 2019 and 2024. These activities have primarily focused on strengthening capabilities in specific areas like cloud integration, AI-powered automation, and enhanced security features. This suggests ongoing consolidation and expansion by key players seeking to broaden their market reach and product offerings.
Continuous Integration Solutions Industry Market Trends & Opportunities
The Continuous Integration Solutions market is experiencing robust growth, with a projected Compound Annual Growth Rate (CAGR) of xx% during the forecast period (2025-2033). This growth is primarily driven by the increasing demand for faster software delivery cycles, the rising adoption of DevOps practices, and the growing preference for cloud-based CI/CD solutions. Market penetration rates for CI/CD tools are increasing across various industries, with particularly strong adoption in sectors like IT & Telecom and Retail & E-commerce, which are early adopters of digital transformation initiatives. Technological advancements, including the integration of AI/ML for improved testing and automation, are significantly enhancing CI/CD capabilities and driving further market expansion. The competitive landscape remains fiercely competitive, with established players constantly vying for market share and new entrants introducing innovative solutions. The industry is marked by ongoing innovation in areas like AI-powered testing, serverless CI/CD pipelines, and improved integration with other DevOps tools. This innovation contributes to the overall growth of the market and ensures a dynamic competitive landscape.

Dominant Markets & Segments in Continuous Integration Solutions Industry
The Cloud segment dominates the Continuous Integration Solutions market, representing an estimated xx% of the total market revenue in 2025. The shift towards cloud-based deployments is fueled by increased scalability, cost-effectiveness, and ease of management, compared to on-premise solutions. The IT and Telecom sector is the leading end-user industry, accounting for a significant portion of market demand, given its focus on rapid software development and deployment.
Key Growth Drivers:
- Robust Cloud Infrastructure: The widespread availability of robust and scalable cloud computing infrastructure is a major catalyst for cloud-based CI/CD adoption.
- Government Initiatives: Government initiatives promoting digital transformation in various sectors are indirectly boosting the demand for CI/CD solutions.
- Focus on Agility: The growing emphasis on business agility and faster time-to-market is driving the adoption of CI/CD pipelines.
Market Dominance Analysis: The dominance of the Cloud segment and the IT & Telecom end-user industry highlights the growing importance of cloud-native development and the continuous need for faster software deployment in these sectors. This trend is expected to continue throughout the forecast period.
Continuous Integration Solutions Industry Product Analysis
The Continuous Integration Solutions market offers a range of products, from basic CI/CD tools to comprehensive DevOps platforms. Key product innovations include AI-powered test automation, improved integration with cloud platforms, and enhanced security features. The competitive advantage hinges on factors such as ease of use, scalability, integration capabilities, and security features. Advanced functionalities like intelligent test splitting and automated rollbacks are increasingly becoming crucial differentiators in this space. The market fit is strong across various industries given the universal need for faster and more reliable software releases.
Key Drivers, Barriers & Challenges in Continuous Integration Solutions Industry
Key Drivers:
- Accelerated Software Delivery Demands: Businesses face immense pressure to rapidly deploy software updates and new features. This fuels the demand for CI/CD solutions that streamline release cycles and enhance efficiency. The need for faster time-to-market is a significant driver across all industries.
- Widespread DevOps Adoption: The growing prevalence of DevOps methodologies, emphasizing collaboration, automation, and continuous improvement, necessitates the integration of CI/CD tools. These tools are fundamental for optimizing the entire software development lifecycle.
- Cloud Infrastructure Expansion: The widespread adoption of cloud computing provides a cost-effective and scalable foundation for implementing and managing CI/CD pipelines. Cloud-native CI/CD solutions offer greater flexibility and ease of deployment.
- Enhanced Agility and Innovation: CI/CD enables organizations to respond quickly to market changes, customer feedback, and emerging technological advancements. This agility fosters continuous innovation and a competitive advantage.
Challenges and Restraints:
- Integration Complexity: Integrating CI/CD tools into existing development environments can be intricate and time-consuming, especially for organizations with legacy systems. This necessitates skilled professionals and careful planning for a smooth transition.
- Security Risks and Vulnerabilities: Ensuring the security of CI/CD pipelines is paramount. Addressing potential vulnerabilities and mitigating risks associated with data breaches and unauthorized access is crucial for maintaining data integrity and compliance.
- Skills Gap and Talent Acquisition: A significant challenge is the scarcity of skilled professionals proficient in implementing and managing CI/CD tools. This talent shortage hinders adoption and slows down the implementation process in many organizations. Addressing this requires targeted training and development initiatives.
- Maintaining Pipeline Stability and Reliability: Ensuring the consistent and reliable performance of CI/CD pipelines is essential. Addressing issues such as pipeline failures, build errors, and deployment setbacks requires robust monitoring and troubleshooting capabilities.
Growth Drivers in the Continuous Integration Solutions Industry Market
The Continuous Integration Solutions market is propelled by several key drivers. The increasing demand for faster software delivery cycles and the widespread adoption of DevOps practices are primary factors. Technological advancements, such as the integration of AI/ML in CI/CD tools, are enhancing efficiency and driving market growth. Government initiatives promoting digital transformation in various sectors also contribute significantly. Furthermore, the increasing availability of cloud-based infrastructure makes it easier and more cost-effective to implement CI/CD pipelines.
Challenges Impacting Continuous Integration Solutions Industry Growth
Despite the significant growth potential, several challenges hinder the expansion of the Continuous Integration Solutions market. The complexity of integrating CI/CD tools with existing systems, particularly in organizations with legacy infrastructure, remains a significant barrier. Security concerns related to data breaches also pose a considerable challenge. The shortage of skilled professionals capable of implementing and managing CI/CD tools further restricts market expansion. These issues need to be addressed to fully unlock the market's growth potential.
Key Players Shaping the Continuous Integration Solutions Industry Market
- Micro Focus International PLC
- JetBrains SRO
- Atlassian Corporation PLC
- IBM Corporation
- Buddy (BDY Sp zoo Sp K)
- Circle Internet Services Inc
- Thoughtworks Inc
- Microsoft Corporation
- Amazon Web Services Inc
- Travis CI GmbH
- GitLab Inc
- CodeShip Inc
Significant Continuous Integration Solutions Industry Industry Milestones
- July 2022: CircleCI announced general availability of support for GitLab SaaS users, enhancing interoperability and offering GitLab users access to CircleCI’s advanced features. This strategic partnership significantly broadened CircleCI's reach and cemented its position as a leading CI/CD platform.
- December 2022: Amazon launched Amazon CodeCatalyst, a unified platform for software development and delivery on AWS. This comprehensive solution simplified the development lifecycle, including CI/CD pipelines, issue management, and collaborative tools, driving further adoption of AWS services within the CI/CD ecosystem.
Future Outlook for Continuous Integration Solutions Industry Market
The future of the Continuous Integration Solutions market is bright, driven by ongoing technological advancements, increased adoption of DevOps practices, and the growing demand for faster software delivery. The market will witness continued innovation in areas such as AI-powered test automation, serverless CI/CD, and improved integration with other DevOps tools. Strategic partnerships and acquisitions will likely shape the competitive landscape. The increasing focus on cloud-native development and the continued shift towards cloud-based deployments present significant opportunities for market expansion. The market is poised for continued robust growth throughout the forecast period.
Continuous Integration Solutions Industry Segmentation
-
1. Deployment
- 1.1. On-premise
- 1.2. Cloud
-
2. End-User Industry
- 2.1. IT and Telecom
- 2.2. Retail and E-commerce
- 2.3. Healthcare and Life Sciences
Continuous Integration Solutions Industry Segmentation By Geography
- 1. North America
- 2. Europe
- 3. Asia Pacific
- 4. Latin America
- 5. Middle East and Africa

Continuous Integration Solutions Industry REPORT HIGHLIGHTS
| Aspects | Details |
|---|---|
| Study Period | 2019-2033 |
| Base Year | 2024 |
| Estimated Year | 2025 |
| Forecast Period | 2025-2033 |
| Historical Period | 2019-2024 |
| Growth Rate | CAGR of 21.18% from 2019-2033 |
| Segmentation |
|
Table of Contents
- 1. Introduction
- 1.1. Research Scope
- 1.2. Market Segmentation
- 1.3. Research Methodology
- 1.4. Definitions and Assumptions
- 2. Executive Summary
- 2.1. Introduction
- 3. Market Dynamics
- 3.1. Introduction
- 3.2. Market Drivers
- 3.2.1. Increasing Adoption of Software-based Business Processes; Increasing Demand for Reduced Complexities in Software Development and Cost Optimization
- 3.3. Market Restrains
- 3.3.1. Environmental and Safe Use Concerns
- 3.4. Market Trends
- 3.4.1. Retail and E-commerce Industry Expected to Exhibit Significant Growth
- 4. Market Factor Analysis
- 4.1. Porters Five Forces
- 4.2. Supply/Value Chain
- 4.3. PESTEL analysis
- 4.4. Market Entropy
- 4.5. Patent/Trademark Analysis
- 5. Global Continuous Integration Solutions Industry Analysis, Insights and Forecast, 2019-2031
- 5.1. Market Analysis, Insights and Forecast - by Deployment
- 5.1.1. On-premise
- 5.1.2. Cloud
- 5.2. Market Analysis, Insights and Forecast - by End-User Industry
- 5.2.1. IT and Telecom
- 5.2.2. Retail and E-commerce
- 5.2.3. Healthcare and Life Sciences
- 5.3. Market Analysis, Insights and Forecast - by Region
- 5.3.1. North America
- 5.3.2. Europe
- 5.3.3. Asia Pacific
- 5.3.4. Latin America
- 5.3.5. Middle East and Africa
- 5.1. Market Analysis, Insights and Forecast - by Deployment
- 6. North America Continuous Integration Solutions Industry Analysis, Insights and Forecast, 2019-2031
- 6.1. Market Analysis, Insights and Forecast - by Deployment
- 6.1.1. On-premise
- 6.1.2. Cloud
- 6.2. Market Analysis, Insights and Forecast - by End-User Industry
- 6.2.1. IT and Telecom
- 6.2.2. Retail and E-commerce
- 6.2.3. Healthcare and Life Sciences
- 6.1. Market Analysis, Insights and Forecast - by Deployment
- 7. Europe Continuous Integration Solutions Industry Analysis, Insights and Forecast, 2019-2031
- 7.1. Market Analysis, Insights and Forecast - by Deployment
- 7.1.1. On-premise
- 7.1.2. Cloud
- 7.2. Market Analysis, Insights and Forecast - by End-User Industry
- 7.2.1. IT and Telecom
- 7.2.2. Retail and E-commerce
- 7.2.3. Healthcare and Life Sciences
- 7.1. Market Analysis, Insights and Forecast - by Deployment
- 8. Asia Pacific Continuous Integration Solutions Industry Analysis, Insights and Forecast, 2019-2031
- 8.1. Market Analysis, Insights and Forecast - by Deployment
- 8.1.1. On-premise
- 8.1.2. Cloud
- 8.2. Market Analysis, Insights and Forecast - by End-User Industry
- 8.2.1. IT and Telecom
- 8.2.2. Retail and E-commerce
- 8.2.3. Healthcare and Life Sciences
- 8.1. Market Analysis, Insights and Forecast - by Deployment
- 9. Latin America Continuous Integration Solutions Industry Analysis, Insights and Forecast, 2019-2031
- 9.1. Market Analysis, Insights and Forecast - by Deployment
- 9.1.1. On-premise
- 9.1.2. Cloud
- 9.2. Market Analysis, Insights and Forecast - by End-User Industry
- 9.2.1. IT and Telecom
- 9.2.2. Retail and E-commerce
- 9.2.3. Healthcare and Life Sciences
- 9.1. Market Analysis, Insights and Forecast - by Deployment
- 10. Middle East and Africa Continuous Integration Solutions Industry Analysis, Insights and Forecast, 2019-2031
- 10.1. Market Analysis, Insights and Forecast - by Deployment
- 10.1.1. On-premise
- 10.1.2. Cloud
- 10.2. Market Analysis, Insights and Forecast - by End-User Industry
- 10.2.1. IT and Telecom
- 10.2.2. Retail and E-commerce
- 10.2.3. Healthcare and Life Sciences
- 10.1. Market Analysis, Insights and Forecast - by Deployment
- 11. North America Continuous Integration Solutions Industry Analysis, Insights and Forecast, 2019-2031
- 11.1. Market Analysis, Insights and Forecast - By Country/Sub-region
- 11.1.1 United States
- 11.1.2 Canada
- 11.1.3 Mexico
- 12. Europe Continuous Integration Solutions Industry Analysis, Insights and Forecast, 2019-2031
- 12.1. Market Analysis, Insights and Forecast - By Country/Sub-region
- 12.1.1 Germany
- 12.1.2 United Kingdom
- 12.1.3 France
- 12.1.4 Spain
- 12.1.5 Italy
- 12.1.6 Spain
- 12.1.7 Belgium
- 12.1.8 Netherland
- 12.1.9 Nordics
- 12.1.10 Rest of Europe
- 13. Asia Pacific Continuous Integration Solutions Industry Analysis, Insights and Forecast, 2019-2031
- 13.1. Market Analysis, Insights and Forecast - By Country/Sub-region
- 13.1.1 China
- 13.1.2 Japan
- 13.1.3 India
- 13.1.4 South Korea
- 13.1.5 Southeast Asia
- 13.1.6 Australia
- 13.1.7 Indonesia
- 13.1.8 Phillipes
- 13.1.9 Singapore
- 13.1.10 Thailandc
- 13.1.11 Rest of Asia Pacific
- 14. South America Continuous Integration Solutions Industry Analysis, Insights and Forecast, 2019-2031
- 14.1. Market Analysis, Insights and Forecast - By Country/Sub-region
- 14.1.1 Brazil
- 14.1.2 Argentina
- 14.1.3 Peru
- 14.1.4 Chile
- 14.1.5 Colombia
- 14.1.6 Ecuador
- 14.1.7 Venezuela
- 14.1.8 Rest of South America
- 15. North America Continuous Integration Solutions Industry Analysis, Insights and Forecast, 2019-2031
- 15.1. Market Analysis, Insights and Forecast - By Country/Sub-region
- 15.1.1 United States
- 15.1.2 Canada
- 15.1.3 Mexico
- 16. MEA Continuous Integration Solutions Industry Analysis, Insights and Forecast, 2019-2031
- 16.1. Market Analysis, Insights and Forecast - By Country/Sub-region
- 16.1.1 United Arab Emirates
- 16.1.2 Saudi Arabia
- 16.1.3 South Africa
- 16.1.4 Rest of Middle East and Africa
- 17. Competitive Analysis
- 17.1. Global Market Share Analysis 2024
- 17.2. Company Profiles
- 17.2.1 Micro Focus International PLC
- 17.2.1.1. Overview
- 17.2.1.2. Products
- 17.2.1.3. SWOT Analysis
- 17.2.1.4. Recent Developments
- 17.2.1.5. Financials (Based on Availability)
- 17.2.2 JetBrains SRO
- 17.2.2.1. Overview
- 17.2.2.2. Products
- 17.2.2.3. SWOT Analysis
- 17.2.2.4. Recent Developments
- 17.2.2.5. Financials (Based on Availability)
- 17.2.3 Atlassian Corporation PLC
- 17.2.3.1. Overview
- 17.2.3.2. Products
- 17.2.3.3. SWOT Analysis
- 17.2.3.4. Recent Developments
- 17.2.3.5. Financials (Based on Availability)
- 17.2.4 IBM Corporation
- 17.2.4.1. Overview
- 17.2.4.2. Products
- 17.2.4.3. SWOT Analysis
- 17.2.4.4. Recent Developments
- 17.2.4.5. Financials (Based on Availability)
- 17.2.5 Buddy (BDY Sp zoo Sp K)
- 17.2.5.1. Overview
- 17.2.5.2. Products
- 17.2.5.3. SWOT Analysis
- 17.2.5.4. Recent Developments
- 17.2.5.5. Financials (Based on Availability)
- 17.2.6 Circle Internet Services Inc
- 17.2.6.1. Overview
- 17.2.6.2. Products
- 17.2.6.3. SWOT Analysis
- 17.2.6.4. Recent Developments
- 17.2.6.5. Financials (Based on Availability)
- 17.2.7 Thoughtworks Inc
- 17.2.7.1. Overview
- 17.2.7.2. Products
- 17.2.7.3. SWOT Analysis
- 17.2.7.4. Recent Developments
- 17.2.7.5. Financials (Based on Availability)
- 17.2.8 Microsoft Corporation
- 17.2.8.1. Overview
- 17.2.8.2. Products
- 17.2.8.3. SWOT Analysis
- 17.2.8.4. Recent Developments
- 17.2.8.5. Financials (Based on Availability)
- 17.2.9 Amazon Web Services Inc
- 17.2.9.1. Overview
- 17.2.9.2. Products
- 17.2.9.3. SWOT Analysis
- 17.2.9.4. Recent Developments
- 17.2.9.5. Financials (Based on Availability)
- 17.2.10 Travis CI GmbH
- 17.2.10.1. Overview
- 17.2.10.2. Products
- 17.2.10.3. SWOT Analysis
- 17.2.10.4. Recent Developments
- 17.2.10.5. Financials (Based on Availability)
- 17.2.11 GitLab Inc
- 17.2.11.1. Overview
- 17.2.11.2. Products
- 17.2.11.3. SWOT Analysis
- 17.2.11.4. Recent Developments
- 17.2.11.5. Financials (Based on Availability)
- 17.2.12 CodeShip Inc
- 17.2.12.1. Overview
- 17.2.12.2. Products
- 17.2.12.3. SWOT Analysis
- 17.2.12.4. Recent Developments
- 17.2.12.5. Financials (Based on Availability)
- 17.2.1 Micro Focus International PLC
List of Figures
- Figure 1: Global Continuous Integration Solutions Industry Revenue Breakdown (Million, %) by Region 2024 & 2032
- Figure 2: Global Continuous Integration Solutions Industry Volume Breakdown (K Unit, %) by Region 2024 & 2032
- Figure 3: North America Continuous Integration Solutions Industry Revenue (Million), by Country 2024 & 2032
- Figure 4: North America Continuous Integration Solutions Industry Volume (K Unit), by Country 2024 & 2032
- Figure 5: North America Continuous Integration Solutions Industry Revenue Share (%), by Country 2024 & 2032
- Figure 6: North America Continuous Integration Solutions Industry Volume Share (%), by Country 2024 & 2032
- Figure 7: Europe Continuous Integration Solutions Industry Revenue (Million), by Country 2024 & 2032
- Figure 8: Europe Continuous Integration Solutions Industry Volume (K Unit), by Country 2024 & 2032
- Figure 9: Europe Continuous Integration Solutions Industry Revenue Share (%), by Country 2024 & 2032
- Figure 10: Europe Continuous Integration Solutions Industry Volume Share (%), by Country 2024 & 2032
- Figure 11: Asia Pacific Continuous Integration Solutions Industry Revenue (Million), by Country 2024 & 2032
- Figure 12: Asia Pacific Continuous Integration Solutions Industry Volume (K Unit), by Country 2024 & 2032
- Figure 13: Asia Pacific Continuous Integration Solutions Industry Revenue Share (%), by Country 2024 & 2032
- Figure 14: Asia Pacific Continuous Integration Solutions Industry Volume Share (%), by Country 2024 & 2032
- Figure 15: South America Continuous Integration Solutions Industry Revenue (Million), by Country 2024 & 2032
- Figure 16: South America Continuous Integration Solutions Industry Volume (K Unit), by Country 2024 & 2032
- Figure 17: South America Continuous Integration Solutions Industry Revenue Share (%), by Country 2024 & 2032
- Figure 18: South America Continuous Integration Solutions Industry Volume Share (%), by Country 2024 & 2032
- Figure 19: North America Continuous Integration Solutions Industry Revenue (Million), by Country 2024 & 2032
- Figure 20: North America Continuous Integration Solutions Industry Volume (K Unit), by Country 2024 & 2032
- Figure 21: North America Continuous Integration Solutions Industry Revenue Share (%), by Country 2024 & 2032
- Figure 22: North America Continuous Integration Solutions Industry Volume Share (%), by Country 2024 & 2032
- Figure 23: MEA Continuous Integration Solutions Industry Revenue (Million), by Country 2024 & 2032
- Figure 24: MEA Continuous Integration Solutions Industry Volume (K Unit), by Country 2024 & 2032
- Figure 25: MEA Continuous Integration Solutions Industry Revenue Share (%), by Country 2024 & 2032
- Figure 26: MEA Continuous Integration Solutions Industry Volume Share (%), by Country 2024 & 2032
- Figure 27: North America Continuous Integration Solutions Industry Revenue (Million), by Deployment 2024 & 2032
- Figure 28: North America Continuous Integration Solutions Industry Volume (K Unit), by Deployment 2024 & 2032
- Figure 29: North America Continuous Integration Solutions Industry Revenue Share (%), by Deployment 2024 & 2032
- Figure 30: North America Continuous Integration Solutions Industry Volume Share (%), by Deployment 2024 & 2032
- Figure 31: North America Continuous Integration Solutions Industry Revenue (Million), by End-User Industry 2024 & 2032
- Figure 32: North America Continuous Integration Solutions Industry Volume (K Unit), by End-User Industry 2024 & 2032
- Figure 33: North America Continuous Integration Solutions Industry Revenue Share (%), by End-User Industry 2024 & 2032
- Figure 34: North America Continuous Integration Solutions Industry Volume Share (%), by End-User Industry 2024 & 2032
- Figure 35: North America Continuous Integration Solutions Industry Revenue (Million), by Country 2024 & 2032
- Figure 36: North America Continuous Integration Solutions Industry Volume (K Unit), by Country 2024 & 2032
- Figure 37: North America Continuous Integration Solutions Industry Revenue Share (%), by Country 2024 & 2032
- Figure 38: North America Continuous Integration Solutions Industry Volume Share (%), by Country 2024 & 2032
- Figure 39: Europe Continuous Integration Solutions Industry Revenue (Million), by Deployment 2024 & 2032
- Figure 40: Europe Continuous Integration Solutions Industry Volume (K Unit), by Deployment 2024 & 2032
- Figure 41: Europe Continuous Integration Solutions Industry Revenue Share (%), by Deployment 2024 & 2032
- Figure 42: Europe Continuous Integration Solutions Industry Volume Share (%), by Deployment 2024 & 2032
- Figure 43: Europe Continuous Integration Solutions Industry Revenue (Million), by End-User Industry 2024 & 2032
- Figure 44: Europe Continuous Integration Solutions Industry Volume (K Unit), by End-User Industry 2024 & 2032
- Figure 45: Europe Continuous Integration Solutions Industry Revenue Share (%), by End-User Industry 2024 & 2032
- Figure 46: Europe Continuous Integration Solutions Industry Volume Share (%), by End-User Industry 2024 & 2032
- Figure 47: Europe Continuous Integration Solutions Industry Revenue (Million), by Country 2024 & 2032
- Figure 48: Europe Continuous Integration Solutions Industry Volume (K Unit), by Country 2024 & 2032
- Figure 49: Europe Continuous Integration Solutions Industry Revenue Share (%), by Country 2024 & 2032
- Figure 50: Europe Continuous Integration Solutions Industry Volume Share (%), by Country 2024 & 2032
- Figure 51: Asia Pacific Continuous Integration Solutions Industry Revenue (Million), by Deployment 2024 & 2032
- Figure 52: Asia Pacific Continuous Integration Solutions Industry Volume (K Unit), by Deployment 2024 & 2032
- Figure 53: Asia Pacific Continuous Integration Solutions Industry Revenue Share (%), by Deployment 2024 & 2032
- Figure 54: Asia Pacific Continuous Integration Solutions Industry Volume Share (%), by Deployment 2024 & 2032
- Figure 55: Asia Pacific Continuous Integration Solutions Industry Revenue (Million), by End-User Industry 2024 & 2032
- Figure 56: Asia Pacific Continuous Integration Solutions Industry Volume (K Unit), by End-User Industry 2024 & 2032
- Figure 57: Asia Pacific Continuous Integration Solutions Industry Revenue Share (%), by End-User Industry 2024 & 2032
- Figure 58: Asia Pacific Continuous Integration Solutions Industry Volume Share (%), by End-User Industry 2024 & 2032
- Figure 59: Asia Pacific Continuous Integration Solutions Industry Revenue (Million), by Country 2024 & 2032
- Figure 60: Asia Pacific Continuous Integration Solutions Industry Volume (K Unit), by Country 2024 & 2032
- Figure 61: Asia Pacific Continuous Integration Solutions Industry Revenue Share (%), by Country 2024 & 2032
- Figure 62: Asia Pacific Continuous Integration Solutions Industry Volume Share (%), by Country 2024 & 2032
- Figure 63: Latin America Continuous Integration Solutions Industry Revenue (Million), by Deployment 2024 & 2032
- Figure 64: Latin America Continuous Integration Solutions Industry Volume (K Unit), by Deployment 2024 & 2032
- Figure 65: Latin America Continuous Integration Solutions Industry Revenue Share (%), by Deployment 2024 & 2032
- Figure 66: Latin America Continuous Integration Solutions Industry Volume Share (%), by Deployment 2024 & 2032
- Figure 67: Latin America Continuous Integration Solutions Industry Revenue (Million), by End-User Industry 2024 & 2032
- Figure 68: Latin America Continuous Integration Solutions Industry Volume (K Unit), by End-User Industry 2024 & 2032
- Figure 69: Latin America Continuous Integration Solutions Industry Revenue Share (%), by End-User Industry 2024 & 2032
- Figure 70: Latin America Continuous Integration Solutions Industry Volume Share (%), by End-User Industry 2024 & 2032
- Figure 71: Latin America Continuous Integration Solutions Industry Revenue (Million), by Country 2024 & 2032
- Figure 72: Latin America Continuous Integration Solutions Industry Volume (K Unit), by Country 2024 & 2032
- Figure 73: Latin America Continuous Integration Solutions Industry Revenue Share (%), by Country 2024 & 2032
- Figure 74: Latin America Continuous Integration Solutions Industry Volume Share (%), by Country 2024 & 2032
- Figure 75: Middle East and Africa Continuous Integration Solutions Industry Revenue (Million), by Deployment 2024 & 2032
- Figure 76: Middle East and Africa Continuous Integration Solutions Industry Volume (K Unit), by Deployment 2024 & 2032
- Figure 77: Middle East and Africa Continuous Integration Solutions Industry Revenue Share (%), by Deployment 2024 & 2032
- Figure 78: Middle East and Africa Continuous Integration Solutions Industry Volume Share (%), by Deployment 2024 & 2032
- Figure 79: Middle East and Africa Continuous Integration Solutions Industry Revenue (Million), by End-User Industry 2024 & 2032
- Figure 80: Middle East and Africa Continuous Integration Solutions Industry Volume (K Unit), by End-User Industry 2024 & 2032
- Figure 81: Middle East and Africa Continuous Integration Solutions Industry Revenue Share (%), by End-User Industry 2024 & 2032
- Figure 82: Middle East and Africa Continuous Integration Solutions Industry Volume Share (%), by End-User Industry 2024 & 2032
- Figure 83: Middle East and Africa Continuous Integration Solutions Industry Revenue (Million), by Country 2024 & 2032
- Figure 84: Middle East and Africa Continuous Integration Solutions Industry Volume (K Unit), by Country 2024 & 2032
- Figure 85: Middle East and Africa Continuous Integration Solutions Industry Revenue Share (%), by Country 2024 & 2032
- Figure 86: Middle East and Africa Continuous Integration Solutions Industry Volume Share (%), by Country 2024 & 2032
List of Tables
- Table 1: Global Continuous Integration Solutions Industry Revenue Million Forecast, by Region 2019 & 2032
- Table 2: Global Continuous Integration Solutions Industry Volume K Unit Forecast, by Region 2019 & 2032
- Table 3: Global Continuous Integration Solutions Industry Revenue Million Forecast, by Deployment 2019 & 2032
- Table 4: Global Continuous Integration Solutions Industry Volume K Unit Forecast, by Deployment 2019 & 2032
- Table 5: Global Continuous Integration Solutions Industry Revenue Million Forecast, by End-User Industry 2019 & 2032
- Table 6: Global Continuous Integration Solutions Industry Volume K Unit Forecast, by End-User Industry 2019 & 2032
- Table 7: Global Continuous Integration Solutions Industry Revenue Million Forecast, by Region 2019 & 2032
- Table 8: Global Continuous Integration Solutions Industry Volume K Unit Forecast, by Region 2019 & 2032
- Table 9: Global Continuous Integration Solutions Industry Revenue Million Forecast, by Country 2019 & 2032
- Table 10: Global Continuous Integration Solutions Industry Volume K Unit Forecast, by Country 2019 & 2032
- Table 11: United States Continuous Integration Solutions Industry Revenue (Million) Forecast, by Application 2019 & 2032
- Table 12: United States Continuous Integration Solutions Industry Volume (K Unit) Forecast, by Application 2019 & 2032
- Table 13: Canada Continuous Integration Solutions Industry Revenue (Million) Forecast, by Application 2019 & 2032
- Table 14: Canada Continuous Integration Solutions Industry Volume (K Unit) Forecast, by Application 2019 & 2032
- Table 15: Mexico Continuous Integration Solutions Industry Revenue (Million) Forecast, by Application 2019 & 2032
- Table 16: Mexico Continuous Integration Solutions Industry Volume (K Unit) Forecast, by Application 2019 & 2032
- Table 17: Global Continuous Integration Solutions Industry Revenue Million Forecast, by Country 2019 & 2032
- Table 18: Global Continuous Integration Solutions Industry Volume K Unit Forecast, by Country 2019 & 2032
- Table 19: Germany Continuous Integration Solutions Industry Revenue (Million) Forecast, by Application 2019 & 2032
- Table 20: Germany Continuous Integration Solutions Industry Volume (K Unit) Forecast, by Application 2019 & 2032
- Table 21: United Kingdom Continuous Integration Solutions Industry Revenue (Million) Forecast, by Application 2019 & 2032
- Table 22: United Kingdom Continuous Integration Solutions Industry Volume (K Unit) Forecast, by Application 2019 & 2032
- Table 23: France Continuous Integration Solutions Industry Revenue (Million) Forecast, by Application 2019 & 2032
- Table 24: France Continuous Integration Solutions Industry Volume (K Unit) Forecast, by Application 2019 & 2032
- Table 25: Spain Continuous Integration Solutions Industry Revenue (Million) Forecast, by Application 2019 & 2032
- Table 26: Spain Continuous Integration Solutions Industry Volume (K Unit) Forecast, by Application 2019 & 2032
- Table 27: Italy Continuous Integration Solutions Industry Revenue (Million) Forecast, by Application 2019 & 2032
- Table 28: Italy Continuous Integration Solutions Industry Volume (K Unit) Forecast, by Application 2019 & 2032
- Table 29: Spain Continuous Integration Solutions Industry Revenue (Million) Forecast, by Application 2019 & 2032
- Table 30: Spain Continuous Integration Solutions Industry Volume (K Unit) Forecast, by Application 2019 & 2032
- Table 31: Belgium Continuous Integration Solutions Industry Revenue (Million) Forecast, by Application 2019 & 2032
- Table 32: Belgium Continuous Integration Solutions Industry Volume (K Unit) Forecast, by Application 2019 & 2032
- Table 33: Netherland Continuous Integration Solutions Industry Revenue (Million) Forecast, by Application 2019 & 2032
- Table 34: Netherland Continuous Integration Solutions Industry Volume (K Unit) Forecast, by Application 2019 & 2032
- Table 35: Nordics Continuous Integration Solutions Industry Revenue (Million) Forecast, by Application 2019 & 2032
- Table 36: Nordics Continuous Integration Solutions Industry Volume (K Unit) Forecast, by Application 2019 & 2032
- Table 37: Rest of Europe Continuous Integration Solutions Industry Revenue (Million) Forecast, by Application 2019 & 2032
- Table 38: Rest of Europe Continuous Integration Solutions Industry Volume (K Unit) Forecast, by Application 2019 & 2032
- Table 39: Global Continuous Integration Solutions Industry Revenue Million Forecast, by Country 2019 & 2032
- Table 40: Global Continuous Integration Solutions Industry Volume K Unit Forecast, by Country 2019 & 2032
- Table 41: China Continuous Integration Solutions Industry Revenue (Million) Forecast, by Application 2019 & 2032
- Table 42: China Continuous Integration Solutions Industry Volume (K Unit) Forecast, by Application 2019 & 2032
- Table 43: Japan Continuous Integration Solutions Industry Revenue (Million) Forecast, by Application 2019 & 2032
- Table 44: Japan Continuous Integration Solutions Industry Volume (K Unit) Forecast, by Application 2019 & 2032
- Table 45: India Continuous Integration Solutions Industry Revenue (Million) Forecast, by Application 2019 & 2032
- Table 46: India Continuous Integration Solutions Industry Volume (K Unit) Forecast, by Application 2019 & 2032
- Table 47: South Korea Continuous Integration Solutions Industry Revenue (Million) Forecast, by Application 2019 & 2032
- Table 48: South Korea Continuous Integration Solutions Industry Volume (K Unit) Forecast, by Application 2019 & 2032
- Table 49: Southeast Asia Continuous Integration Solutions Industry Revenue (Million) Forecast, by Application 2019 & 2032
- Table 50: Southeast Asia Continuous Integration Solutions Industry Volume (K Unit) Forecast, by Application 2019 & 2032
- Table 51: Australia Continuous Integration Solutions Industry Revenue (Million) Forecast, by Application 2019 & 2032
- Table 52: Australia Continuous Integration Solutions Industry Volume (K Unit) Forecast, by Application 2019 & 2032
- Table 53: Indonesia Continuous Integration Solutions Industry Revenue (Million) Forecast, by Application 2019 & 2032
- Table 54: Indonesia Continuous Integration Solutions Industry Volume (K Unit) Forecast, by Application 2019 & 2032
- Table 55: Phillipes Continuous Integration Solutions Industry Revenue (Million) Forecast, by Application 2019 & 2032
- Table 56: Phillipes Continuous Integration Solutions Industry Volume (K Unit) Forecast, by Application 2019 & 2032
- Table 57: Singapore Continuous Integration Solutions Industry Revenue (Million) Forecast, by Application 2019 & 2032
- Table 58: Singapore Continuous Integration Solutions Industry Volume (K Unit) Forecast, by Application 2019 & 2032
- Table 59: Thailandc Continuous Integration Solutions Industry Revenue (Million) Forecast, by Application 2019 & 2032
- Table 60: Thailandc Continuous Integration Solutions Industry Volume (K Unit) Forecast, by Application 2019 & 2032
- Table 61: Rest of Asia Pacific Continuous Integration Solutions Industry Revenue (Million) Forecast, by Application 2019 & 2032
- Table 62: Rest of Asia Pacific Continuous Integration Solutions Industry Volume (K Unit) Forecast, by Application 2019 & 2032
- Table 63: Global Continuous Integration Solutions Industry Revenue Million Forecast, by Country 2019 & 2032
- Table 64: Global Continuous Integration Solutions Industry Volume K Unit Forecast, by Country 2019 & 2032
- Table 65: Brazil Continuous Integration Solutions Industry Revenue (Million) Forecast, by Application 2019 & 2032
- Table 66: Brazil Continuous Integration Solutions Industry Volume (K Unit) Forecast, by Application 2019 & 2032
- Table 67: Argentina Continuous Integration Solutions Industry Revenue (Million) Forecast, by Application 2019 & 2032
- Table 68: Argentina Continuous Integration Solutions Industry Volume (K Unit) Forecast, by Application 2019 & 2032
- Table 69: Peru Continuous Integration Solutions Industry Revenue (Million) Forecast, by Application 2019 & 2032
- Table 70: Peru Continuous Integration Solutions Industry Volume (K Unit) Forecast, by Application 2019 & 2032
- Table 71: Chile Continuous Integration Solutions Industry Revenue (Million) Forecast, by Application 2019 & 2032
- Table 72: Chile Continuous Integration Solutions Industry Volume (K Unit) Forecast, by Application 2019 & 2032
- Table 73: Colombia Continuous Integration Solutions Industry Revenue (Million) Forecast, by Application 2019 & 2032
- Table 74: Colombia Continuous Integration Solutions Industry Volume (K Unit) Forecast, by Application 2019 & 2032
- Table 75: Ecuador Continuous Integration Solutions Industry Revenue (Million) Forecast, by Application 2019 & 2032
- Table 76: Ecuador Continuous Integration Solutions Industry Volume (K Unit) Forecast, by Application 2019 & 2032
- Table 77: Venezuela Continuous Integration Solutions Industry Revenue (Million) Forecast, by Application 2019 & 2032
- Table 78: Venezuela Continuous Integration Solutions Industry Volume (K Unit) Forecast, by Application 2019 & 2032
- Table 79: Rest of South America Continuous Integration Solutions Industry Revenue (Million) Forecast, by Application 2019 & 2032
- Table 80: Rest of South America Continuous Integration Solutions Industry Volume (K Unit) Forecast, by Application 2019 & 2032
- Table 81: Global Continuous Integration Solutions Industry Revenue Million Forecast, by Country 2019 & 2032
- Table 82: Global Continuous Integration Solutions Industry Volume K Unit Forecast, by Country 2019 & 2032
- Table 83: United States Continuous Integration Solutions Industry Revenue (Million) Forecast, by Application 2019 & 2032
- Table 84: United States Continuous Integration Solutions Industry Volume (K Unit) Forecast, by Application 2019 & 2032
- Table 85: Canada Continuous Integration Solutions Industry Revenue (Million) Forecast, by Application 2019 & 2032
- Table 86: Canada Continuous Integration Solutions Industry Volume (K Unit) Forecast, by Application 2019 & 2032
- Table 87: Mexico Continuous Integration Solutions Industry Revenue (Million) Forecast, by Application 2019 & 2032
- Table 88: Mexico Continuous Integration Solutions Industry Volume (K Unit) Forecast, by Application 2019 & 2032
- Table 89: Global Continuous Integration Solutions Industry Revenue Million Forecast, by Country 2019 & 2032
- Table 90: Global Continuous Integration Solutions Industry Volume K Unit Forecast, by Country 2019 & 2032
- Table 91: United Arab Emirates Continuous Integration Solutions Industry Revenue (Million) Forecast, by Application 2019 & 2032
- Table 92: United Arab Emirates Continuous Integration Solutions Industry Volume (K Unit) Forecast, by Application 2019 & 2032
- Table 93: Saudi Arabia Continuous Integration Solutions Industry Revenue (Million) Forecast, by Application 2019 & 2032
- Table 94: Saudi Arabia Continuous Integration Solutions Industry Volume (K Unit) Forecast, by Application 2019 & 2032
- Table 95: South Africa Continuous Integration Solutions Industry Revenue (Million) Forecast, by Application 2019 & 2032
- Table 96: South Africa Continuous Integration Solutions Industry Volume (K Unit) Forecast, by Application 2019 & 2032
- Table 97: Rest of Middle East and Africa Continuous Integration Solutions Industry Revenue (Million) Forecast, by Application 2019 & 2032
- Table 98: Rest of Middle East and Africa Continuous Integration Solutions Industry Volume (K Unit) Forecast, by Application 2019 & 2032
- Table 99: Global Continuous Integration Solutions Industry Revenue Million Forecast, by Deployment 2019 & 2032
- Table 100: Global Continuous Integration Solutions Industry Volume K Unit Forecast, by Deployment 2019 & 2032
- Table 101: Global Continuous Integration Solutions Industry Revenue Million Forecast, by End-User Industry 2019 & 2032
- Table 102: Global Continuous Integration Solutions Industry Volume K Unit Forecast, by End-User Industry 2019 & 2032
- Table 103: Global Continuous Integration Solutions Industry Revenue Million Forecast, by Country 2019 & 2032
- Table 104: Global Continuous Integration Solutions Industry Volume K Unit Forecast, by Country 2019 & 2032
- Table 105: Global Continuous Integration Solutions Industry Revenue Million Forecast, by Deployment 2019 & 2032
- Table 106: Global Continuous Integration Solutions Industry Volume K Unit Forecast, by Deployment 2019 & 2032
- Table 107: Global Continuous Integration Solutions Industry Revenue Million Forecast, by End-User Industry 2019 & 2032
- Table 108: Global Continuous Integration Solutions Industry Volume K Unit Forecast, by End-User Industry 2019 & 2032
- Table 109: Global Continuous Integration Solutions Industry Revenue Million Forecast, by Country 2019 & 2032
- Table 110: Global Continuous Integration Solutions Industry Volume K Unit Forecast, by Country 2019 & 2032
- Table 111: Global Continuous Integration Solutions Industry Revenue Million Forecast, by Deployment 2019 & 2032
- Table 112: Global Continuous Integration Solutions Industry Volume K Unit Forecast, by Deployment 2019 & 2032
- Table 113: Global Continuous Integration Solutions Industry Revenue Million Forecast, by End-User Industry 2019 & 2032
- Table 114: Global Continuous Integration Solutions Industry Volume K Unit Forecast, by End-User Industry 2019 & 2032
- Table 115: Global Continuous Integration Solutions Industry Revenue Million Forecast, by Country 2019 & 2032
- Table 116: Global Continuous Integration Solutions Industry Volume K Unit Forecast, by Country 2019 & 2032
- Table 117: Global Continuous Integration Solutions Industry Revenue Million Forecast, by Deployment 2019 & 2032
- Table 118: Global Continuous Integration Solutions Industry Volume K Unit Forecast, by Deployment 2019 & 2032
- Table 119: Global Continuous Integration Solutions Industry Revenue Million Forecast, by End-User Industry 2019 & 2032
- Table 120: Global Continuous Integration Solutions Industry Volume K Unit Forecast, by End-User Industry 2019 & 2032
- Table 121: Global Continuous Integration Solutions Industry Revenue Million Forecast, by Country 2019 & 2032
- Table 122: Global Continuous Integration Solutions Industry Volume K Unit Forecast, by Country 2019 & 2032
- Table 123: Global Continuous Integration Solutions Industry Revenue Million Forecast, by Deployment 2019 & 2032
- Table 124: Global Continuous Integration Solutions Industry Volume K Unit Forecast, by Deployment 2019 & 2032
- Table 125: Global Continuous Integration Solutions Industry Revenue Million Forecast, by End-User Industry 2019 & 2032
- Table 126: Global Continuous Integration Solutions Industry Volume K Unit Forecast, by End-User Industry 2019 & 2032
- Table 127: Global Continuous Integration Solutions Industry Revenue Million Forecast, by Country 2019 & 2032
- Table 128: Global Continuous Integration Solutions Industry Volume K Unit Forecast, by Country 2019 & 2032
Frequently Asked Questions
1. What is the projected Compound Annual Growth Rate (CAGR) of the Continuous Integration Solutions Industry?
The projected CAGR is approximately 21.18%.
2. Which companies are prominent players in the Continuous Integration Solutions Industry?
Key companies in the market include Micro Focus International PLC, JetBrains SRO, Atlassian Corporation PLC, IBM Corporation, Buddy (BDY Sp zoo Sp K), Circle Internet Services Inc, Thoughtworks Inc, Microsoft Corporation, Amazon Web Services Inc, Travis CI GmbH, GitLab Inc, CodeShip Inc.
3. What are the main segments of the Continuous Integration Solutions Industry?
The market segments include Deployment, End-User Industry.
4. Can you provide details about the market size?
The market size is estimated to be USD 1.43 Million as of 2022.
5. What are some drivers contributing to market growth?
Increasing Adoption of Software-based Business Processes; Increasing Demand for Reduced Complexities in Software Development and Cost Optimization.
6. What are the notable trends driving market growth?
Retail and E-commerce Industry Expected to Exhibit Significant Growth.
7. Are there any restraints impacting market growth?
Environmental and Safe Use Concerns.
8. Can you provide examples of recent developments in the market?
July 2022: The top continuous integration and continuous delivery (CI/CD) platform, CircleCI, declared support for GitLab SaaS users to be generally available. Joint customers can now utilize the interoperability between CircleCI, The One DevOps Platform for Software Innovation, and GitLab Inc. technologies. GitLab-based software development teams now have access to CircleCI's industry-leading speed, intelligent test splitting, and the broadest selection of resource classes and compute options.
9. What pricing options are available for accessing the report?
Pricing options include single-user, multi-user, and enterprise licenses priced at USD 4750, USD 5250, and USD 8750 respectively.
10. Is the market size provided in terms of value or volume?
The market size is provided in terms of value, measured in Million and volume, measured in K Unit.
11. Are there any specific market keywords associated with the report?
Yes, the market keyword associated with the report is "Continuous Integration Solutions Industry," which aids in identifying and referencing the specific market segment covered.
12. How do I determine which pricing option suits my needs best?
The pricing options vary based on user requirements and access needs. Individual users may opt for single-user licenses, while businesses requiring broader access may choose multi-user or enterprise licenses for cost-effective access to the report.
13. Are there any additional resources or data provided in the Continuous Integration Solutions Industry report?
While the report offers comprehensive insights, it's advisable to review the specific contents or supplementary materials provided to ascertain if additional resources or data are available.
14. How can I stay updated on further developments or reports in the Continuous Integration Solutions Industry?
To stay informed about further developments, trends, and reports in the Continuous Integration Solutions Industry, consider subscribing to industry newsletters, following relevant companies and organizations, or regularly checking reputable industry news sources and publications.
Methodology
Step 1 - Identification of Relevant Samples Size from Population Database


Step 2 - Approaches for Defining Global Market Size (Value, Volume* & Price*)

Note*: In applicable scenarios
Step 3 - Data Sources
Primary Research
- Web Analytics
- Survey Reports
- Research Institute
- Latest Research Reports
- Opinion Leaders
Secondary Research
- Annual Reports
- White Paper
- Latest Press Release
- Industry Association
- Paid Database
- Investor Presentations

Step 4 - Data Triangulation
Involves using different sources of information in order to increase the validity of a study
These sources are likely to be stakeholders in a program - participants, other researchers, program staff, other community members, and so on.
Then we put all data in single framework & apply various statistical tools to find out the dynamic on the market.
During the analysis stage, feedback from the stakeholder groups would be compared to determine areas of agreement as well as areas of divergence
