

Key Insights
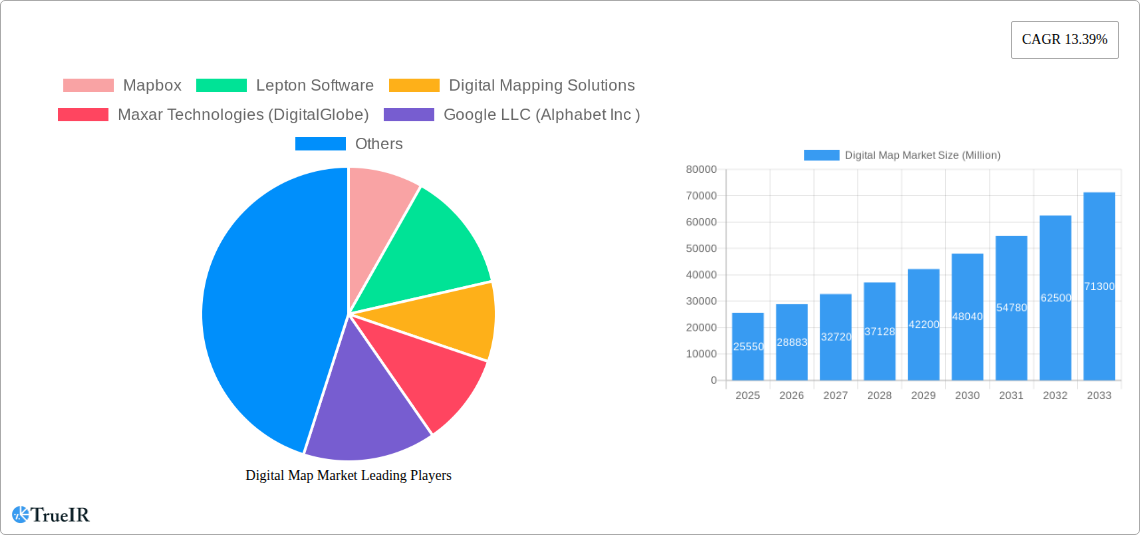
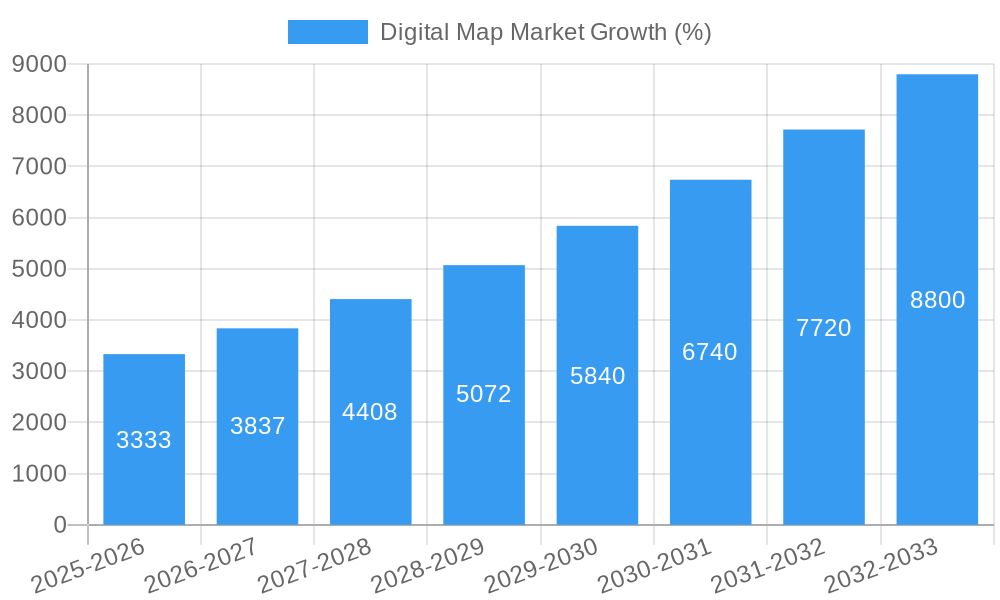
The digital map market, valued at $25.55 billion in 2025, is experiencing robust growth, projected to expand at a Compound Annual Growth Rate (CAGR) of 13.39% from 2025 to 2033. This significant expansion is driven by the increasing adoption of location-based services (LBS) across diverse industries, the surging demand for real-time navigation and mapping solutions, and the proliferation of connected devices and autonomous vehicles. The cloud-based deployment model is gaining traction due to its scalability, cost-effectiveness, and accessibility, while the software segment holds a dominant share, fueled by continuous innovation in mapping technologies and data analytics capabilities. Key industry verticals driving market growth include automotive, engineering & construction, logistics & transportation, and energy & utilities, leveraging digital maps for optimized route planning, asset tracking, infrastructure management, and improved operational efficiency. The market faces challenges like data accuracy and security concerns, and the need for continuous map updates to maintain accuracy in a rapidly changing world.
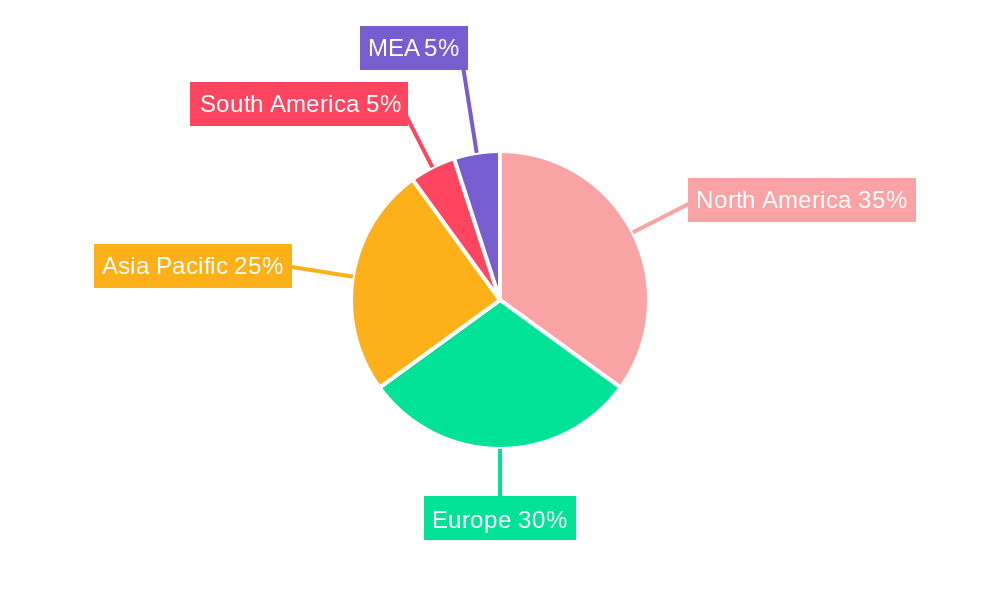
Competition in the digital map market is intense, with established players like Google, TomTom, and HERE Technologies competing with specialized providers such as Mapbox and DigitalGlobe. The market is witnessing significant mergers and acquisitions, strategic partnerships, and technological advancements such as the integration of AI and machine learning for enhanced map creation and analysis. Geographical expansion, particularly in rapidly developing economies in Asia-Pacific and South America, presents significant opportunities for growth. Furthermore, increasing government initiatives promoting digital infrastructure development and smart city projects are further bolstering market expansion. The integration of augmented reality (AR) and virtual reality (VR) technologies into mapping applications is also expected to fuel future growth, opening new possibilities for immersive location-based experiences.
Digital Map Market Report: 2019-2033 Forecast
This comprehensive report provides an in-depth analysis of the global Digital Map Market, projecting robust growth from 2025 to 2033. Valued at xx Million in 2025, the market is poised for significant expansion, driven by technological advancements and increasing adoption across diverse industries. This report covers market sizing, competitive landscape, segment analysis, key players, and future outlook, providing valuable insights for businesses, investors, and stakeholders. The study period spans 2019-2033, with 2025 serving as the base and estimated year.
Digital Map Market Structure & Competitive Landscape
The global Digital Map Market exhibits a moderately concentrated structure, with several key players holding significant market share. The market concentration ratio (CR5) is estimated at xx%, indicating a presence of both large multinational corporations and specialized niche players. Innovation is a major driver, with companies constantly developing advanced mapping technologies, such as AI-powered navigation and 3D mapping. Regulatory environments, particularly concerning data privacy and security, significantly impact market dynamics. Product substitutes, such as simpler navigation apps or traditional paper maps, exert limited pressure due to the superior functionalities and data richness of digital maps. End-user segmentation spans across numerous industries including Automotive, Engineering & Construction, Logistics & Transportation, Energy & Utilities, and Telecommunication. M&A activity in the past five years shows a steady increase with approximately xx Million in deals closed annually, indicating a consolidating trend within the market.
- High Concentration: The top 5 players account for xx% of the market.
- Innovation Drivers: AI-powered navigation, 3D mapping, and real-time data integration.
- Regulatory Impacts: Data privacy and security regulations shape market practices.
- Limited Substitutes: Traditional mapping methods face significant competitive disadvantage.
- Active M&A Landscape: Annual M&A activity exceeding xx Million.
Digital Map Market Market Trends & Opportunities
The Digital Map Market is experiencing rapid growth, with a projected Compound Annual Growth Rate (CAGR) of xx% during the forecast period (2025-2033). This growth is fueled by several factors: the increasing penetration of smartphones and connected devices, expanding adoption of location-based services (LBS), the growing demand for precise navigation and mapping solutions across diverse industries (Automotive, Logistics, and Utilities). Technological advancements like the integration of AI, machine learning, and high-resolution imagery significantly enhance map accuracy and functionality, further propelling market expansion. Furthermore, consumer preference is shifting towards user-friendly, real-time map applications with advanced features, driving demand. The competitive landscape remains dynamic, with major players investing heavily in R&D and strategic partnerships to maintain a competitive edge and capture market share. Market penetration rates are high in developed economies; however, significant growth opportunities remain in emerging markets due to rising smartphone usage and infrastructural development.
Dominant Markets & Segments in Digital Map Market
The North American region currently dominates the Digital Map Market, driven by substantial investments in infrastructure development, strong government support for technological advancements, and high demand from industries such as automotive and logistics. Within segments, the cloud-based deployment model is experiencing rapid growth, surpassing on-premise solutions due to cost-effectiveness, scalability, and ease of access. The Software segment dominates the solutions market in terms of revenue and is poised for continued expansion due to increasing software integration into various devices and applications. The Automotive industry remains the leading consumer of Digital Map products, accounting for xx% of the market, largely driven by the advancements in autonomous driving technology.
- Leading Region: North America (xx% market share)
- Fastest Growing Segment (Deployment): Cloud-based solutions
- Dominant Segment (Solution): Software solutions
- Largest Industry Vertical: Automotive
Key Growth Drivers:
- Robust investments in infrastructure development in several countries.
- Supportive government policies promoting technological advancements in the GIS sector.
- High demand for precise and real-time navigation across industries.
Digital Map Market Product Analysis
Recent advancements in digital mapping technology have resulted in increasingly sophisticated and accurate map products. These innovations include the integration of AI and machine learning algorithms to improve map data processing, enhance real-time updates, and enable the development of hyper-localized map features. High-resolution satellite imagery and 3D modeling techniques contribute to more realistic and detailed maps. This improved accuracy and detail are driving increased adoption across various sectors, enhancing applications ranging from route optimization in logistics to precision agriculture and environmental monitoring. The market fit for these advanced products is excellent, as they cater to the growing need for real-time, accurate data across many industries.
Key Drivers, Barriers & Challenges in Digital Map Market
Key Drivers:
The Digital Map Market is experiencing strong growth driven by several key factors. Technological advancements such as AI, machine learning, and high-resolution satellite imagery are improving map accuracy and real-time data integration. Increased smartphone adoption is expanding access to LBS and digital mapping apps. Rising demand for precise navigation across various industries, including logistics, autonomous driving, and smart cities, further fuels market growth.
Challenges:
Data privacy and security concerns present significant challenges, necessitating robust security measures and compliance with evolving regulations. The high cost of data acquisition, processing, and maintenance can be a barrier to entry for smaller players. Competitive pressures from established players with substantial resources can hinder market entry and growth for new entrants. Supply chain disruptions affecting hardware components and data providers can also impact product availability and delivery timelines.
Growth Drivers in the Digital Map Market Market
Technological advancements, increasing demand for location-based services (LBS) from various industries, government initiatives promoting infrastructure development, and the rising penetration of smartphones are key drivers for market growth. The integration of AI and ML is enhancing map accuracy, while the expansion of 5G networks facilitates real-time data transmission and improved functionalities of digital mapping technologies. Economic factors such as increasing disposable incomes and investments in infrastructure are further propelling market expansion.
Challenges Impacting Digital Map Market Growth
Regulatory complexities around data privacy and security pose major challenges. High initial investment costs for data acquisition and infrastructure development can create entry barriers. Intense competition from established players with deep pockets and extensive resources creates significant pressure. Supply chain disruptions can impede timely access to essential hardware components and data, affecting production and delivery. These factors can collectively restrain market growth.
Key Players Shaping the Digital Map Market Market
- Mapbox
- Lepton Software
- Digital Mapping Solutions
- Maxar Technologies (DigitalGlobe)
- Google LLC (Alphabet Inc)
- Collins Bartholomew Ltd
- DMTI Spatial
- Digital Map Products Inc
- ThinkGeo LLC
- MapData Services Pty Ltd
- ESRI Business Information Solutions Inc
- TomTom International B.V.
- HERE Technologies
Significant Digital Map Market Industry Milestones
- July 27, 2022: Google launched its Street View experience in India, expanding its reach and market presence.
- December 2022: The launch of the Overture Maps Foundation signifies a collaborative effort towards creating open and interoperable map data, potentially transforming the industry's landscape.
Future Outlook for Digital Map Market Market
The Digital Map Market is expected to witness sustained growth, driven by continuous technological advancements, increasing adoption of LBS, and expansion into new applications. Strategic partnerships and acquisitions will likely shape the competitive landscape, while the focus on data security and privacy will continue to influence market regulations. Opportunities exist in emerging markets and in the development of innovative applications like autonomous driving and smart city management. The market's overall outlook remains positive, promising significant growth and expansion in the coming years.
Digital Map Market Segmentation
-
1. Solution
- 1.1. Software
- 1.2. Services
-
2. Deployment
- 2.1. On-Premise
- 2.2. Cloud
-
3. Industry
- 3.1. Automotive
- 3.2. Engineering & Construction
- 3.3. Logistics & Transportation
- 3.4. Energy & Utilities
- 3.5. Telecommunication
- 3.6. Other Industries
Digital Map Market Segmentation By Geography
-
1. North America
- 1.1. United States
- 1.2. Canada
-
2. Europe
- 2.1. United Kingdom
- 2.2. Germany
- 2.3. France
- 2.4. Rest of Europe
-
3. Asia Pacific
- 3.1. China
- 3.2. Japan
- 3.3. India
- 3.4. Rest of Asia Pacific
- 4. Rest of the World
Digital Map Market REPORT HIGHLIGHTS
| Aspects | Details |
|---|---|
| Study Period | 2019-2033 |
| Base Year | 2024 |
| Estimated Year | 2025 |
| Forecast Period | 2025-2033 |
| Historical Period | 2019-2024 |
| Growth Rate | CAGR of 13.39% from 2019-2033 |
| Segmentation |
|
Table of Contents
- 1. Introduction
- 1.1. Research Scope
- 1.2. Market Segmentation
- 1.3. Research Methodology
- 1.4. Definitions and Assumptions
- 2. Executive Summary
- 2.1. Introduction
- 3. Market Dynamics
- 3.1. Introduction
- 3.2. Market Drivers
- 3.2.1. Growth in Application for Advanced Navigation System in Automotive Industry; Surge in Demand for Geographic Information System (GIS); Increased Adoption of Connected Devices and Internet
- 3.3. Market Restrains
- 3.3.1. Complexity in Integration of Traditional Maps with Modern GIS System
- 3.4. Market Trends
- 3.4.1. Surge in Demand for GIS and GNSS to Influence the Adoption of Digital Map Technology
- 4. Market Factor Analysis
- 4.1. Porters Five Forces
- 4.2. Supply/Value Chain
- 4.3. PESTEL analysis
- 4.4. Market Entropy
- 4.5. Patent/Trademark Analysis
- 5. Global Digital Map Market Analysis, Insights and Forecast, 2019-2031
- 5.1. Market Analysis, Insights and Forecast - by Solution
- 5.1.1. Software
- 5.1.2. Services
- 5.2. Market Analysis, Insights and Forecast - by Deployment
- 5.2.1. On-Premise
- 5.2.2. Cloud
- 5.3. Market Analysis, Insights and Forecast - by Industry
- 5.3.1. Automotive
- 5.3.2. Engineering & Construction
- 5.3.3. Logistics & Transportation
- 5.3.4. Energy & Utilities
- 5.3.5. Telecommunication
- 5.3.6. Other Industries
- 5.4. Market Analysis, Insights and Forecast - by Region
- 5.4.1. North America
- 5.4.2. Europe
- 5.4.3. Asia Pacific
- 5.4.4. Rest of the World
- 5.1. Market Analysis, Insights and Forecast - by Solution
- 6. North America Digital Map Market Analysis, Insights and Forecast, 2019-2031
- 6.1. Market Analysis, Insights and Forecast - by Solution
- 6.1.1. Software
- 6.1.2. Services
- 6.2. Market Analysis, Insights and Forecast - by Deployment
- 6.2.1. On-Premise
- 6.2.2. Cloud
- 6.3. Market Analysis, Insights and Forecast - by Industry
- 6.3.1. Automotive
- 6.3.2. Engineering & Construction
- 6.3.3. Logistics & Transportation
- 6.3.4. Energy & Utilities
- 6.3.5. Telecommunication
- 6.3.6. Other Industries
- 6.1. Market Analysis, Insights and Forecast - by Solution
- 7. Europe Digital Map Market Analysis, Insights and Forecast, 2019-2031
- 7.1. Market Analysis, Insights and Forecast - by Solution
- 7.1.1. Software
- 7.1.2. Services
- 7.2. Market Analysis, Insights and Forecast - by Deployment
- 7.2.1. On-Premise
- 7.2.2. Cloud
- 7.3. Market Analysis, Insights and Forecast - by Industry
- 7.3.1. Automotive
- 7.3.2. Engineering & Construction
- 7.3.3. Logistics & Transportation
- 7.3.4. Energy & Utilities
- 7.3.5. Telecommunication
- 7.3.6. Other Industries
- 7.1. Market Analysis, Insights and Forecast - by Solution
- 8. Asia Pacific Digital Map Market Analysis, Insights and Forecast, 2019-2031
- 8.1. Market Analysis, Insights and Forecast - by Solution
- 8.1.1. Software
- 8.1.2. Services
- 8.2. Market Analysis, Insights and Forecast - by Deployment
- 8.2.1. On-Premise
- 8.2.2. Cloud
- 8.3. Market Analysis, Insights and Forecast - by Industry
- 8.3.1. Automotive
- 8.3.2. Engineering & Construction
- 8.3.3. Logistics & Transportation
- 8.3.4. Energy & Utilities
- 8.3.5. Telecommunication
- 8.3.6. Other Industries
- 8.1. Market Analysis, Insights and Forecast - by Solution
- 9. Rest of the World Digital Map Market Analysis, Insights and Forecast, 2019-2031
- 9.1. Market Analysis, Insights and Forecast - by Solution
- 9.1.1. Software
- 9.1.2. Services
- 9.2. Market Analysis, Insights and Forecast - by Deployment
- 9.2.1. On-Premise
- 9.2.2. Cloud
- 9.3. Market Analysis, Insights and Forecast - by Industry
- 9.3.1. Automotive
- 9.3.2. Engineering & Construction
- 9.3.3. Logistics & Transportation
- 9.3.4. Energy & Utilities
- 9.3.5. Telecommunication
- 9.3.6. Other Industries
- 9.1. Market Analysis, Insights and Forecast - by Solution
- 10. North America Digital Map Market Analysis, Insights and Forecast, 2019-2031
- 10.1. Market Analysis, Insights and Forecast - By Country/Sub-region
- 10.1.1 United States
- 10.1.2 Canada
- 10.1.3 Mexico
- 11. Europe Digital Map Market Analysis, Insights and Forecast, 2019-2031
- 11.1. Market Analysis, Insights and Forecast - By Country/Sub-region
- 11.1.1 Germany
- 11.1.2 United Kingdom
- 11.1.3 France
- 11.1.4 Spain
- 11.1.5 Italy
- 11.1.6 Spain
- 11.1.7 Belgium
- 11.1.8 Netherland
- 11.1.9 Nordics
- 11.1.10 Rest of Europe
- 12. Asia Pacific Digital Map Market Analysis, Insights and Forecast, 2019-2031
- 12.1. Market Analysis, Insights and Forecast - By Country/Sub-region
- 12.1.1 China
- 12.1.2 Japan
- 12.1.3 India
- 12.1.4 South Korea
- 12.1.5 Southeast Asia
- 12.1.6 Australia
- 12.1.7 Indonesia
- 12.1.8 Phillipes
- 12.1.9 Singapore
- 12.1.10 Thailandc
- 12.1.11 Rest of Asia Pacific
- 13. South America Digital Map Market Analysis, Insights and Forecast, 2019-2031
- 13.1. Market Analysis, Insights and Forecast - By Country/Sub-region
- 13.1.1 Brazil
- 13.1.2 Argentina
- 13.1.3 Peru
- 13.1.4 Chile
- 13.1.5 Colombia
- 13.1.6 Ecuador
- 13.1.7 Venezuela
- 13.1.8 Rest of South America
- 14. North America Digital Map Market Analysis, Insights and Forecast, 2019-2031
- 14.1. Market Analysis, Insights and Forecast - By Country/Sub-region
- 14.1.1 United States
- 14.1.2 Canada
- 14.1.3 Mexico
- 15. MEA Digital Map Market Analysis, Insights and Forecast, 2019-2031
- 15.1. Market Analysis, Insights and Forecast - By Country/Sub-region
- 15.1.1 United Arab Emirates
- 15.1.2 Saudi Arabia
- 15.1.3 South Africa
- 15.1.4 Rest of Middle East and Africa
- 16. Competitive Analysis
- 16.1. Global Market Share Analysis 2024
- 16.2. Company Profiles
- 16.2.1 Mapbox
- 16.2.1.1. Overview
- 16.2.1.2. Products
- 16.2.1.3. SWOT Analysis
- 16.2.1.4. Recent Developments
- 16.2.1.5. Financials (Based on Availability)
- 16.2.2 Lepton Software
- 16.2.2.1. Overview
- 16.2.2.2. Products
- 16.2.2.3. SWOT Analysis
- 16.2.2.4. Recent Developments
- 16.2.2.5. Financials (Based on Availability)
- 16.2.3 Digital Mapping Solutions
- 16.2.3.1. Overview
- 16.2.3.2. Products
- 16.2.3.3. SWOT Analysis
- 16.2.3.4. Recent Developments
- 16.2.3.5. Financials (Based on Availability)
- 16.2.4 Maxar Technologies (DigitalGlobe)
- 16.2.4.1. Overview
- 16.2.4.2. Products
- 16.2.4.3. SWOT Analysis
- 16.2.4.4. Recent Developments
- 16.2.4.5. Financials (Based on Availability)
- 16.2.5 Google LLC (Alphabet Inc )
- 16.2.5.1. Overview
- 16.2.5.2. Products
- 16.2.5.3. SWOT Analysis
- 16.2.5.4. Recent Developments
- 16.2.5.5. Financials (Based on Availability)
- 16.2.6 Collins Bartholomew Ltd
- 16.2.6.1. Overview
- 16.2.6.2. Products
- 16.2.6.3. SWOT Analysis
- 16.2.6.4. Recent Developments
- 16.2.6.5. Financials (Based on Availability)
- 16.2.7 DMTI Spatial
- 16.2.7.1. Overview
- 16.2.7.2. Products
- 16.2.7.3. SWOT Analysis
- 16.2.7.4. Recent Developments
- 16.2.7.5. Financials (Based on Availability)
- 16.2.8 Digital Map Products Inc
- 16.2.8.1. Overview
- 16.2.8.2. Products
- 16.2.8.3. SWOT Analysis
- 16.2.8.4. Recent Developments
- 16.2.8.5. Financials (Based on Availability)
- 16.2.9 ThinkGeo LLC
- 16.2.9.1. Overview
- 16.2.9.2. Products
- 16.2.9.3. SWOT Analysis
- 16.2.9.4. Recent Developments
- 16.2.9.5. Financials (Based on Availability)
- 16.2.10 MapData Services Pty Ltd
- 16.2.10.1. Overview
- 16.2.10.2. Products
- 16.2.10.3. SWOT Analysis
- 16.2.10.4. Recent Developments
- 16.2.10.5. Financials (Based on Availability)
- 16.2.11 ESRI Business Information Solutions Inc
- 16.2.11.1. Overview
- 16.2.11.2. Products
- 16.2.11.3. SWOT Analysis
- 16.2.11.4. Recent Developments
- 16.2.11.5. Financials (Based on Availability)
- 16.2.12 TomTom International B V *List Not Exhaustive
- 16.2.12.1. Overview
- 16.2.12.2. Products
- 16.2.12.3. SWOT Analysis
- 16.2.12.4. Recent Developments
- 16.2.12.5. Financials (Based on Availability)
- 16.2.13 HERE Technologies
- 16.2.13.1. Overview
- 16.2.13.2. Products
- 16.2.13.3. SWOT Analysis
- 16.2.13.4. Recent Developments
- 16.2.13.5. Financials (Based on Availability)
- 16.2.1 Mapbox
List of Figures
- Figure 1: Global Digital Map Market Revenue Breakdown (Million, %) by Region 2024 & 2032
- Figure 2: North America Digital Map Market Revenue (Million), by Country 2024 & 2032
- Figure 3: North America Digital Map Market Revenue Share (%), by Country 2024 & 2032
- Figure 4: Europe Digital Map Market Revenue (Million), by Country 2024 & 2032
- Figure 5: Europe Digital Map Market Revenue Share (%), by Country 2024 & 2032
- Figure 6: Asia Pacific Digital Map Market Revenue (Million), by Country 2024 & 2032
- Figure 7: Asia Pacific Digital Map Market Revenue Share (%), by Country 2024 & 2032
- Figure 8: South America Digital Map Market Revenue (Million), by Country 2024 & 2032
- Figure 9: South America Digital Map Market Revenue Share (%), by Country 2024 & 2032
- Figure 10: North America Digital Map Market Revenue (Million), by Country 2024 & 2032
- Figure 11: North America Digital Map Market Revenue Share (%), by Country 2024 & 2032
- Figure 12: MEA Digital Map Market Revenue (Million), by Country 2024 & 2032
- Figure 13: MEA Digital Map Market Revenue Share (%), by Country 2024 & 2032
- Figure 14: North America Digital Map Market Revenue (Million), by Solution 2024 & 2032
- Figure 15: North America Digital Map Market Revenue Share (%), by Solution 2024 & 2032
- Figure 16: North America Digital Map Market Revenue (Million), by Deployment 2024 & 2032
- Figure 17: North America Digital Map Market Revenue Share (%), by Deployment 2024 & 2032
- Figure 18: North America Digital Map Market Revenue (Million), by Industry 2024 & 2032
- Figure 19: North America Digital Map Market Revenue Share (%), by Industry 2024 & 2032
- Figure 20: North America Digital Map Market Revenue (Million), by Country 2024 & 2032
- Figure 21: North America Digital Map Market Revenue Share (%), by Country 2024 & 2032
- Figure 22: Europe Digital Map Market Revenue (Million), by Solution 2024 & 2032
- Figure 23: Europe Digital Map Market Revenue Share (%), by Solution 2024 & 2032
- Figure 24: Europe Digital Map Market Revenue (Million), by Deployment 2024 & 2032
- Figure 25: Europe Digital Map Market Revenue Share (%), by Deployment 2024 & 2032
- Figure 26: Europe Digital Map Market Revenue (Million), by Industry 2024 & 2032
- Figure 27: Europe Digital Map Market Revenue Share (%), by Industry 2024 & 2032
- Figure 28: Europe Digital Map Market Revenue (Million), by Country 2024 & 2032
- Figure 29: Europe Digital Map Market Revenue Share (%), by Country 2024 & 2032
- Figure 30: Asia Pacific Digital Map Market Revenue (Million), by Solution 2024 & 2032
- Figure 31: Asia Pacific Digital Map Market Revenue Share (%), by Solution 2024 & 2032
- Figure 32: Asia Pacific Digital Map Market Revenue (Million), by Deployment 2024 & 2032
- Figure 33: Asia Pacific Digital Map Market Revenue Share (%), by Deployment 2024 & 2032
- Figure 34: Asia Pacific Digital Map Market Revenue (Million), by Industry 2024 & 2032
- Figure 35: Asia Pacific Digital Map Market Revenue Share (%), by Industry 2024 & 2032
- Figure 36: Asia Pacific Digital Map Market Revenue (Million), by Country 2024 & 2032
- Figure 37: Asia Pacific Digital Map Market Revenue Share (%), by Country 2024 & 2032
- Figure 38: Rest of the World Digital Map Market Revenue (Million), by Solution 2024 & 2032
- Figure 39: Rest of the World Digital Map Market Revenue Share (%), by Solution 2024 & 2032
- Figure 40: Rest of the World Digital Map Market Revenue (Million), by Deployment 2024 & 2032
- Figure 41: Rest of the World Digital Map Market Revenue Share (%), by Deployment 2024 & 2032
- Figure 42: Rest of the World Digital Map Market Revenue (Million), by Industry 2024 & 2032
- Figure 43: Rest of the World Digital Map Market Revenue Share (%), by Industry 2024 & 2032
- Figure 44: Rest of the World Digital Map Market Revenue (Million), by Country 2024 & 2032
- Figure 45: Rest of the World Digital Map Market Revenue Share (%), by Country 2024 & 2032
List of Tables
- Table 1: Global Digital Map Market Revenue Million Forecast, by Region 2019 & 2032
- Table 2: Global Digital Map Market Revenue Million Forecast, by Solution 2019 & 2032
- Table 3: Global Digital Map Market Revenue Million Forecast, by Deployment 2019 & 2032
- Table 4: Global Digital Map Market Revenue Million Forecast, by Industry 2019 & 2032
- Table 5: Global Digital Map Market Revenue Million Forecast, by Region 2019 & 2032
- Table 6: Global Digital Map Market Revenue Million Forecast, by Country 2019 & 2032
- Table 7: United States Digital Map Market Revenue (Million) Forecast, by Application 2019 & 2032
- Table 8: Canada Digital Map Market Revenue (Million) Forecast, by Application 2019 & 2032
- Table 9: Mexico Digital Map Market Revenue (Million) Forecast, by Application 2019 & 2032
- Table 10: Global Digital Map Market Revenue Million Forecast, by Country 2019 & 2032
- Table 11: Germany Digital Map Market Revenue (Million) Forecast, by Application 2019 & 2032
- Table 12: United Kingdom Digital Map Market Revenue (Million) Forecast, by Application 2019 & 2032
- Table 13: France Digital Map Market Revenue (Million) Forecast, by Application 2019 & 2032
- Table 14: Spain Digital Map Market Revenue (Million) Forecast, by Application 2019 & 2032
- Table 15: Italy Digital Map Market Revenue (Million) Forecast, by Application 2019 & 2032
- Table 16: Spain Digital Map Market Revenue (Million) Forecast, by Application 2019 & 2032
- Table 17: Belgium Digital Map Market Revenue (Million) Forecast, by Application 2019 & 2032
- Table 18: Netherland Digital Map Market Revenue (Million) Forecast, by Application 2019 & 2032
- Table 19: Nordics Digital Map Market Revenue (Million) Forecast, by Application 2019 & 2032
- Table 20: Rest of Europe Digital Map Market Revenue (Million) Forecast, by Application 2019 & 2032
- Table 21: Global Digital Map Market Revenue Million Forecast, by Country 2019 & 2032
- Table 22: China Digital Map Market Revenue (Million) Forecast, by Application 2019 & 2032
- Table 23: Japan Digital Map Market Revenue (Million) Forecast, by Application 2019 & 2032
- Table 24: India Digital Map Market Revenue (Million) Forecast, by Application 2019 & 2032
- Table 25: South Korea Digital Map Market Revenue (Million) Forecast, by Application 2019 & 2032
- Table 26: Southeast Asia Digital Map Market Revenue (Million) Forecast, by Application 2019 & 2032
- Table 27: Australia Digital Map Market Revenue (Million) Forecast, by Application 2019 & 2032
- Table 28: Indonesia Digital Map Market Revenue (Million) Forecast, by Application 2019 & 2032
- Table 29: Phillipes Digital Map Market Revenue (Million) Forecast, by Application 2019 & 2032
- Table 30: Singapore Digital Map Market Revenue (Million) Forecast, by Application 2019 & 2032
- Table 31: Thailandc Digital Map Market Revenue (Million) Forecast, by Application 2019 & 2032
- Table 32: Rest of Asia Pacific Digital Map Market Revenue (Million) Forecast, by Application 2019 & 2032
- Table 33: Global Digital Map Market Revenue Million Forecast, by Country 2019 & 2032
- Table 34: Brazil Digital Map Market Revenue (Million) Forecast, by Application 2019 & 2032
- Table 35: Argentina Digital Map Market Revenue (Million) Forecast, by Application 2019 & 2032
- Table 36: Peru Digital Map Market Revenue (Million) Forecast, by Application 2019 & 2032
- Table 37: Chile Digital Map Market Revenue (Million) Forecast, by Application 2019 & 2032
- Table 38: Colombia Digital Map Market Revenue (Million) Forecast, by Application 2019 & 2032
- Table 39: Ecuador Digital Map Market Revenue (Million) Forecast, by Application 2019 & 2032
- Table 40: Venezuela Digital Map Market Revenue (Million) Forecast, by Application 2019 & 2032
- Table 41: Rest of South America Digital Map Market Revenue (Million) Forecast, by Application 2019 & 2032
- Table 42: Global Digital Map Market Revenue Million Forecast, by Country 2019 & 2032
- Table 43: United States Digital Map Market Revenue (Million) Forecast, by Application 2019 & 2032
- Table 44: Canada Digital Map Market Revenue (Million) Forecast, by Application 2019 & 2032
- Table 45: Mexico Digital Map Market Revenue (Million) Forecast, by Application 2019 & 2032
- Table 46: Global Digital Map Market Revenue Million Forecast, by Country 2019 & 2032
- Table 47: United Arab Emirates Digital Map Market Revenue (Million) Forecast, by Application 2019 & 2032
- Table 48: Saudi Arabia Digital Map Market Revenue (Million) Forecast, by Application 2019 & 2032
- Table 49: South Africa Digital Map Market Revenue (Million) Forecast, by Application 2019 & 2032
- Table 50: Rest of Middle East and Africa Digital Map Market Revenue (Million) Forecast, by Application 2019 & 2032
- Table 51: Global Digital Map Market Revenue Million Forecast, by Solution 2019 & 2032
- Table 52: Global Digital Map Market Revenue Million Forecast, by Deployment 2019 & 2032
- Table 53: Global Digital Map Market Revenue Million Forecast, by Industry 2019 & 2032
- Table 54: Global Digital Map Market Revenue Million Forecast, by Country 2019 & 2032
- Table 55: United States Digital Map Market Revenue (Million) Forecast, by Application 2019 & 2032
- Table 56: Canada Digital Map Market Revenue (Million) Forecast, by Application 2019 & 2032
- Table 57: Global Digital Map Market Revenue Million Forecast, by Solution 2019 & 2032
- Table 58: Global Digital Map Market Revenue Million Forecast, by Deployment 2019 & 2032
- Table 59: Global Digital Map Market Revenue Million Forecast, by Industry 2019 & 2032
- Table 60: Global Digital Map Market Revenue Million Forecast, by Country 2019 & 2032
- Table 61: United Kingdom Digital Map Market Revenue (Million) Forecast, by Application 2019 & 2032
- Table 62: Germany Digital Map Market Revenue (Million) Forecast, by Application 2019 & 2032
- Table 63: France Digital Map Market Revenue (Million) Forecast, by Application 2019 & 2032
- Table 64: Rest of Europe Digital Map Market Revenue (Million) Forecast, by Application 2019 & 2032
- Table 65: Global Digital Map Market Revenue Million Forecast, by Solution 2019 & 2032
- Table 66: Global Digital Map Market Revenue Million Forecast, by Deployment 2019 & 2032
- Table 67: Global Digital Map Market Revenue Million Forecast, by Industry 2019 & 2032
- Table 68: Global Digital Map Market Revenue Million Forecast, by Country 2019 & 2032
- Table 69: China Digital Map Market Revenue (Million) Forecast, by Application 2019 & 2032
- Table 70: Japan Digital Map Market Revenue (Million) Forecast, by Application 2019 & 2032
- Table 71: India Digital Map Market Revenue (Million) Forecast, by Application 2019 & 2032
- Table 72: Rest of Asia Pacific Digital Map Market Revenue (Million) Forecast, by Application 2019 & 2032
- Table 73: Global Digital Map Market Revenue Million Forecast, by Solution 2019 & 2032
- Table 74: Global Digital Map Market Revenue Million Forecast, by Deployment 2019 & 2032
- Table 75: Global Digital Map Market Revenue Million Forecast, by Industry 2019 & 2032
- Table 76: Global Digital Map Market Revenue Million Forecast, by Country 2019 & 2032
Frequently Asked Questions
1. What is the projected Compound Annual Growth Rate (CAGR) of the Digital Map Market?
The projected CAGR is approximately 13.39%.
2. Which companies are prominent players in the Digital Map Market?
Key companies in the market include Mapbox, Lepton Software, Digital Mapping Solutions, Maxar Technologies (DigitalGlobe), Google LLC (Alphabet Inc ), Collins Bartholomew Ltd, DMTI Spatial, Digital Map Products Inc, ThinkGeo LLC, MapData Services Pty Ltd, ESRI Business Information Solutions Inc, TomTom International B V *List Not Exhaustive, HERE Technologies.
3. What are the main segments of the Digital Map Market?
The market segments include Solution, Deployment, Industry.
4. Can you provide details about the market size?
The market size is estimated to be USD 25.55 Million as of 2022.
5. What are some drivers contributing to market growth?
Growth in Application for Advanced Navigation System in Automotive Industry; Surge in Demand for Geographic Information System (GIS); Increased Adoption of Connected Devices and Internet.
6. What are the notable trends driving market growth?
Surge in Demand for GIS and GNSS to Influence the Adoption of Digital Map Technology.
7. Are there any restraints impacting market growth?
Complexity in Integration of Traditional Maps with Modern GIS System.
8. Can you provide examples of recent developments in the market?
December 2022 - The Linux Foundation has partnered with some of the biggest technology companies in the world to build interoperable and open map data in what is an apparent move t. The Overture Maps Foundation, as the new effort is called, is officially hosted by the Linux Foundation. The ultimate aim of the Overture Maps Foundation is to power new map products through openly available datasets that can be used and reused across applications and businesses, with each member throwing their data and resources into the mix.
9. What pricing options are available for accessing the report?
Pricing options include single-user, multi-user, and enterprise licenses priced at USD 4750, USD 5250, and USD 8750 respectively.
10. Is the market size provided in terms of value or volume?
The market size is provided in terms of value, measured in Million.
11. Are there any specific market keywords associated with the report?
Yes, the market keyword associated with the report is "Digital Map Market," which aids in identifying and referencing the specific market segment covered.
12. How do I determine which pricing option suits my needs best?
The pricing options vary based on user requirements and access needs. Individual users may opt for single-user licenses, while businesses requiring broader access may choose multi-user or enterprise licenses for cost-effective access to the report.
13. Are there any additional resources or data provided in the Digital Map Market report?
While the report offers comprehensive insights, it's advisable to review the specific contents or supplementary materials provided to ascertain if additional resources or data are available.
14. How can I stay updated on further developments or reports in the Digital Map Market?
To stay informed about further developments, trends, and reports in the Digital Map Market, consider subscribing to industry newsletters, following relevant companies and organizations, or regularly checking reputable industry news sources and publications.
Methodology
Step 1 - Identification of Relevant Samples Size from Population Database


Step 2 - Approaches for Defining Global Market Size (Value, Volume* & Price*)

Note*: In applicable scenarios
Step 3 - Data Sources
Primary Research
- Web Analytics
- Survey Reports
- Research Institute
- Latest Research Reports
- Opinion Leaders
Secondary Research
- Annual Reports
- White Paper
- Latest Press Release
- Industry Association
- Paid Database
- Investor Presentations

Step 4 - Data Triangulation
Involves using different sources of information in order to increase the validity of a study
These sources are likely to be stakeholders in a program - participants, other researchers, program staff, other community members, and so on.
Then we put all data in single framework & apply various statistical tools to find out the dynamic on the market.
During the analysis stage, feedback from the stakeholder groups would be compared to determine areas of agreement as well as areas of divergence
