

Key Insights
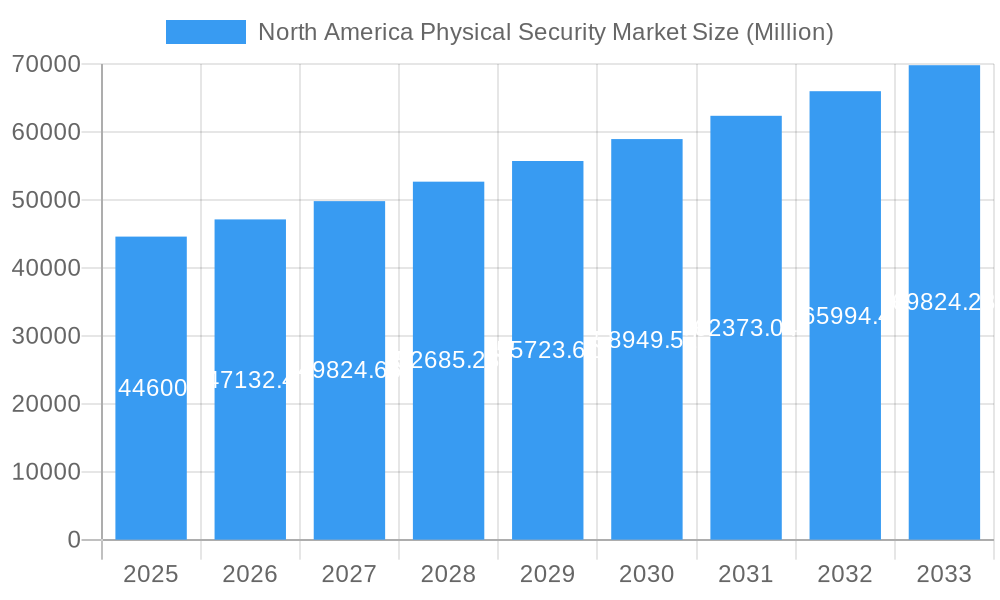
The North America physical security market, valued at approximately $44.60 billion in 2025, is projected to experience robust growth, fueled by a Compound Annual Growth Rate (CAGR) of 5.40% from 2025 to 2033. This expansion is driven by several key factors. Increasing concerns about terrorism and crime, coupled with the rising adoption of advanced technologies like artificial intelligence (AI) and Internet of Things (IoT) devices for enhanced surveillance and security systems, are significant catalysts. The demand for integrated security solutions that combine various technologies, such as video surveillance, access control, and intrusion detection, is also a major driver. Furthermore, the growing need for robust cybersecurity measures to protect critical infrastructure and sensitive data is pushing market growth. The market's strong performance is also being bolstered by increasing government initiatives to improve public safety and the expanding adoption of cloud-based security solutions, offering greater scalability and cost-effectiveness.
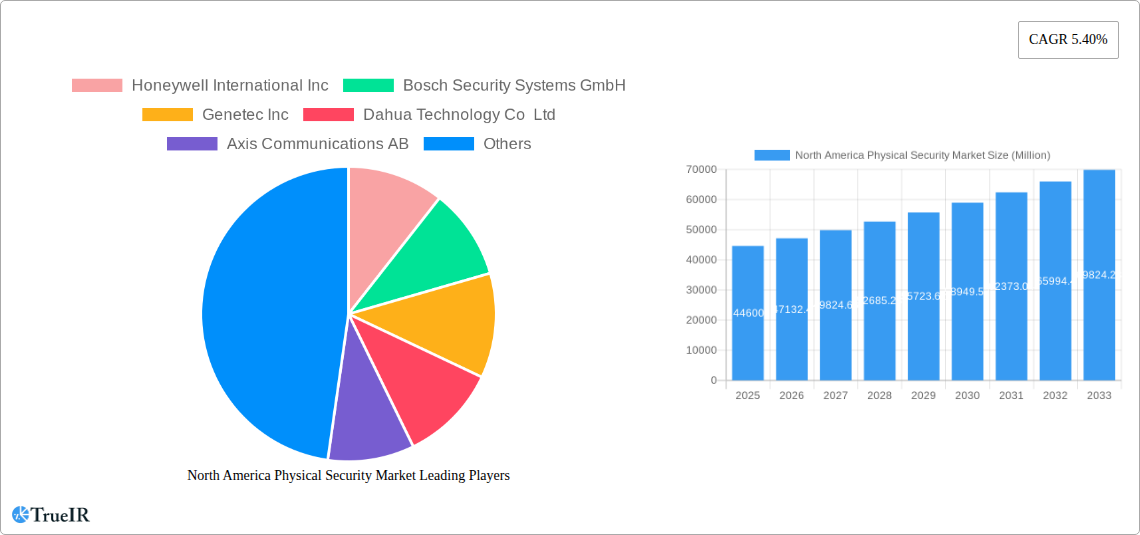
North America Physical Security Market Market Size (In Billion)
However, certain challenges hinder the market's growth trajectory. High initial investment costs associated with implementing advanced security systems can be a barrier for smaller businesses. Furthermore, concerns regarding data privacy and the potential misuse of surveillance technologies are creating regulatory hurdles and influencing consumer sentiment. Despite these restraints, the market is expected to remain largely robust, driven by technological innovation, increasing security awareness, and a growing preference for integrated and proactive security measures. Key players like Honeywell, Bosch, Genetec, and Dahua are actively shaping the market landscape through continuous product development and strategic partnerships, further contributing to its anticipated expansion over the forecast period.
North America Physical Security Market Company Market Share
North America Physical Security Market Report: 2019-2033
This comprehensive report provides an in-depth analysis of the North America physical security market, offering invaluable insights for businesses, investors, and industry professionals. The study covers the period from 2019 to 2033, with a focus on the forecast period of 2025-2033 and a base year of 2025. Expect detailed market sizing, segmentation, competitive analysis, and future growth projections, all underpinned by rigorous research methodology. This report is essential for understanding the dynamics of this rapidly evolving market and making informed strategic decisions.
North America Physical Security Market Structure & Competitive Landscape
The North American physical security market is characterized by a moderately concentrated landscape with several major players holding significant market share. While precise concentration ratios are proprietary to the full report, analysis reveals a dynamic interplay of established players and emerging innovators. The market exhibits high innovation, driven by technological advancements such as AI-powered surveillance, biometric authentication, and cloud-based security solutions. Stringent regulatory compliance requirements, particularly concerning data privacy and cybersecurity, significantly influence market dynamics. The presence of substitute products, such as software-based security solutions, adds to competitive pressure.
End-user segmentation is a crucial aspect, with key verticals including government and defense, commercial real estate, critical infrastructure, and transportation showing significant demand. The past five years (Historical Period: 2019-2024) have witnessed a moderate level of mergers and acquisitions (M&A) activity, approximately xx Million USD annually, driven by strategic expansions and technological integration. Larger players are increasingly consolidating their positions to enhance their technological capabilities and expand their service offerings.
- Market Concentration: Moderately concentrated, with top players commanding significant shares (specific figures in full report).
- Innovation Drivers: AI, Biometrics, Cloud Computing, IoT integration.
- Regulatory Impacts: Data privacy regulations (e.g., CCPA, GDPR implications), cybersecurity standards.
- Product Substitutes: Software-defined security solutions, virtual security systems.
- End-User Segmentation: Government & Defense, Commercial Real Estate, Critical Infrastructure, Transportation.
- M&A Trends: Moderate activity, driven by strategic expansion and technological integration (approx xx Million USD annually in 2019-2024).
North America Physical Security Market Trends & Opportunities
The North America physical security market is projected to experience robust growth during the forecast period (2025-2033). The market size in 2025 is estimated at xx Million USD and is expected to reach xx Million USD by 2033, exhibiting a compound annual growth rate (CAGR) of xx%. This growth is fueled by several factors. The increasing adoption of advanced security technologies, driven by rising concerns about terrorism, crime, and data breaches, plays a crucial role. Technological advancements, such as AI-powered video analytics and predictive security systems, are driving market expansion. Shifting consumer preferences towards more integrated and user-friendly security solutions also contribute significantly. The heightened focus on cybersecurity within organizations is another key driver. The market penetration rate for advanced security systems is steadily increasing, particularly in urban areas and high-security locations. Competitive dynamics are characterized by both intense competition among established players and the emergence of innovative startups offering niche solutions. This dynamic landscape presents numerous growth opportunities for companies that can effectively adapt to the changing technological landscape and satisfy evolving customer needs.
Dominant Markets & Segments in North America Physical Security Market
The United States dominates the North America physical security market, owing to its large and diverse economy, high levels of investment in security infrastructure, and robust technological advancements. Significant growth is also anticipated from Canada, driven by increasing infrastructure spending and heightened security concerns across various sectors. Within the market segmentation, access control systems continue to dominate due to their widespread adoption across various industries. Video surveillance, however, exhibits the highest growth potential due to ongoing technological improvements and the increasing adoption of AI-powered analytics.
- Key Growth Drivers in the US: Large market size, high security investment, advanced technology adoption, robust regulatory environment.
- Key Growth Drivers in Canada: Infrastructure development, security concerns across various sectors, government initiatives.
- Dominant Segments: Access control, video surveillance, intrusion detection. Video Surveillance shows highest growth potential.
North America Physical Security Market Product Analysis
Product innovations are largely driven by technological advancements in areas such as AI, cloud computing, and IoT. This has led to the development of integrated security solutions that offer enhanced functionality and improved efficiency. These solutions provide features such as advanced video analytics, biometric authentication, and centralized management capabilities. The market also witnesses the rise of specialized solutions tailored to specific industry needs, such as perimeter security for critical infrastructure or access control for large enterprises. The competitive landscape is shaped by the ability of companies to offer robust, scalable, and cost-effective solutions. The integration of cloud technology is significantly impacting the market, offering enhanced scalability, remote management, and data analytics capabilities.
Key Drivers, Barriers & Challenges in North America Physical Security Market
Key Drivers:
- Growing concerns over security threats and cybercrime.
- Rising adoption of advanced technologies like AI and IoT.
- Increased government spending on security infrastructure.
- Stringent regulatory requirements emphasizing security and data protection.
Key Barriers & Challenges:
- High initial investment costs for advanced security systems.
- Complexity of integrating diverse security solutions.
- Concerns regarding data privacy and cybersecurity vulnerabilities.
- Supply chain disruptions impacting the availability of components.
- Intense competition and price pressure, leading to reduced profit margins. This has a quantifiable impact, reducing overall market growth by an estimated xx% annually.
Growth Drivers in the North America Physical Security Market
The market's growth is largely driven by increased security concerns, particularly in response to rising crime rates and terrorist threats. Technological advancements, such as AI-powered video analytics and improved biometric authentication, contribute significantly to this growth. Government initiatives and regulatory mandates promoting improved security and data protection also play a vital role. Economic growth and rising disposable incomes further enhance the demand for advanced security systems, especially in the commercial and residential sectors. Finally, the increasing adoption of cloud-based security solutions offers enhanced scalability, remote management capabilities, and cost efficiency.
Challenges Impacting North America Physical Security Market Growth
Several factors hinder the market's growth. The high cost of implementing advanced security systems, especially for smaller businesses, poses a significant barrier. Complex integration challenges when deploying multiple security solutions across an enterprise can be time-consuming and expensive. Furthermore, concerns about data privacy and potential cybersecurity vulnerabilities may deter adoption. Supply chain disruptions also create uncertainty in the availability and cost of essential components.
Key Players Shaping the North America Physical Security Market
Significant North America Physical Security Market Industry Milestones
October 2023: IDEMIA announced a secure, standards-based converged access card for enterprise access, leveraging HYPR's passwordless authentication and Wavelynx's reader solutions. This innovation significantly simplifies access management and enhances security.
March 2023: Genetec Inc. partnered with Axis Communications to launch "Axis Powered by Genetec," a unified access control solution integrating Genetec software with Axis controllers. This strengthens the market's move towards integrated security platforms.
Future Outlook for North America Physical Security Market
The North America physical security market is poised for continued growth driven by ongoing technological advancements, escalating security concerns, and favorable government regulations. Strategic opportunities abound for companies that can successfully innovate, integrate, and offer comprehensive, user-friendly security solutions. The market's expansion is projected to remain robust throughout the forecast period, fueled by factors such as increasing urbanization, expanding critical infrastructure, and the heightened need for robust cybersecurity measures. The integration of AI, IoT, and cloud computing will be pivotal in shaping future market dynamics, offering opportunities for enhanced security, greater efficiency, and improved cost-effectiveness.
North America Physical Security Market Segmentation
-
1. System Type
-
1.1. Video Surveillance System
- 1.1.1. IP Surveillance
- 1.1.2. Analog Surveillance
- 1.1.3. Hybrid Surveillance
- 1.2. Physical Access Control System (PACS)
- 1.3. Biometric System
- 1.4. Perimeter Security
- 1.5. Intrusion Detection
-
1.1. Video Surveillance System
-
2. Service Type
- 2.1. Access Control as a Service (ACaaS)
- 2.2. Video Surveillance as a Service (VSaaS)
-
3. Type of Deployment
- 3.1. On-Premises
- 3.2. Cloud
-
4. Organization Size
- 4.1. SMEs
- 4.2. Large Enterprises
-
5. End-user Industry
- 5.1. Government Services
- 5.2. Banking and Financial Services
- 5.3. IT and Telecommunications
- 5.4. Transportation and Logistics
- 5.5. Retail
- 5.6. Healthcare
- 5.7. Residential
- 5.8. Other End-user Industries
North America Physical Security Market Segmentation By Geography
-
1. North America
- 1.1. United States
- 1.2. Canada
- 1.3. Mexico
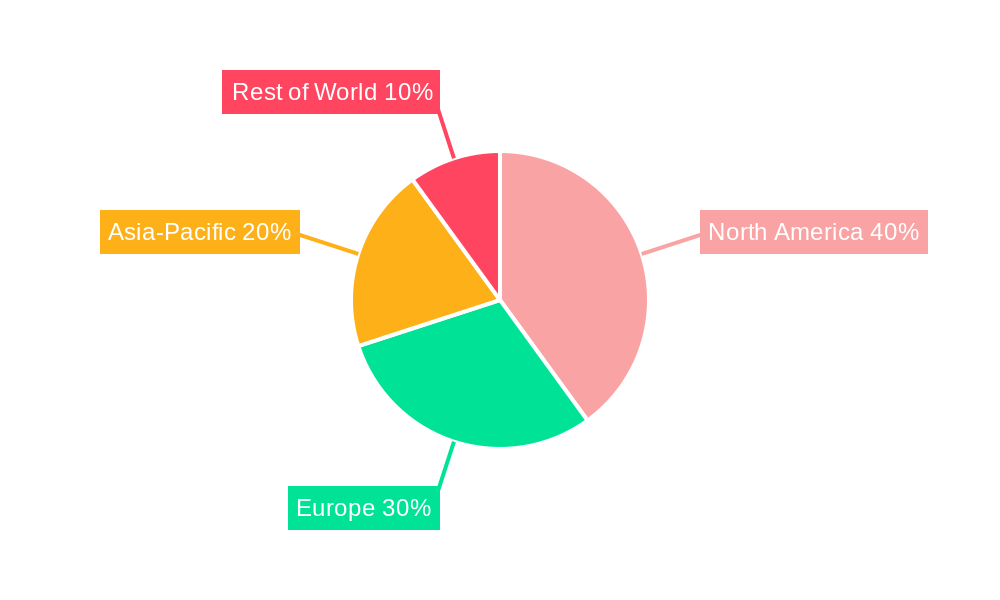
North America Physical Security Market Regional Market Share
Geographic Coverage of North America Physical Security Market
North America Physical Security Market REPORT HIGHLIGHTS
| Aspects | Details |
|---|---|
| Study Period | 2020-2034 |
| Base Year | 2025 |
| Estimated Year | 2026 |
| Forecast Period | 2026-2034 |
| Historical Period | 2020-2025 |
| Growth Rate | CAGR of 5.40% from 2020-2034 |
| Segmentation |
|
Table of Contents
- 1. Introduction
- 1.1. Research Scope
- 1.2. Market Segmentation
- 1.3. Research Objective
- 1.4. Definitions and Assumptions
- 2. Executive Summary
- 2.1. Market Snapshot
- 3. Market Dynamics
- 3.1. Market Drivers
- 3.2. Market Restrains
- 3.3. Market Trends
- 3.4. Market Opportunities
- 4. Market Factor Analysis
- 4.1. Porters Five Forces
- 4.1.1. Bargaining Power of Suppliers
- 4.1.2. Bargaining Power of Buyers
- 4.1.3. Threat of New Entrants
- 4.1.4. Threat of Substitutes
- 4.1.5. Competitive Rivalry
- 4.2. PESTEL analysis
- 4.3. BCG Analysis
- 4.3.1. Stars (High Growth, High Market Share)
- 4.3.2. Cash Cows (Low Growth, High Market Share)
- 4.3.3. Question Mark (High Growth, Low Market Share)
- 4.3.4. Dogs (Low Growth, Low Market Share)
- 4.4. Ansoff Matrix Analysis
- 4.5. Supply Chain Analysis
- 4.6. Regulatory Landscape
- 4.7. Current Market Potential and Opportunity Assessment (TAM–SAM–SOM Framework)
- 4.8. TIR Analyst Note
- 4.1. Porters Five Forces
- 5. Market Analysis, Insights and Forecast 2021-2033
- 5.1. Market Analysis, Insights and Forecast - by System Type
- 5.1.1. Video Surveillance System
- 5.1.1.1. IP Surveillance
- 5.1.1.2. Analog Surveillance
- 5.1.1.3. Hybrid Surveillance
- 5.1.2. Physical Access Control System (PACS)
- 5.1.3. Biometric System
- 5.1.4. Perimeter Security
- 5.1.5. Intrusion Detection
- 5.1.1. Video Surveillance System
- 5.2. Market Analysis, Insights and Forecast - by Service Type
- 5.2.1. Access Control as a Service (ACaaS)
- 5.2.2. Video Surveillance as a Service (VSaaS)
- 5.3. Market Analysis, Insights and Forecast - by Type of Deployment
- 5.3.1. On-Premises
- 5.3.2. Cloud
- 5.4. Market Analysis, Insights and Forecast - by Organization Size
- 5.4.1. SMEs
- 5.4.2. Large Enterprises
- 5.5. Market Analysis, Insights and Forecast - by End-user Industry
- 5.5.1. Government Services
- 5.5.2. Banking and Financial Services
- 5.5.3. IT and Telecommunications
- 5.5.4. Transportation and Logistics
- 5.5.5. Retail
- 5.5.6. Healthcare
- 5.5.7. Residential
- 5.5.8. Other End-user Industries
- 5.6. Market Analysis, Insights and Forecast - by Region
- 5.6.1. North America
- 5.1. Market Analysis, Insights and Forecast - by System Type
- 6. North America Physical Security Market Analysis, Insights and Forecast, 2021-2033
- 6.1. Market Analysis, Insights and Forecast - by System Type
- 6.1.1. Video Surveillance System
- 6.1.1.1. IP Surveillance
- 6.1.1.2. Analog Surveillance
- 6.1.1.3. Hybrid Surveillance
- 6.1.2. Physical Access Control System (PACS)
- 6.1.3. Biometric System
- 6.1.4. Perimeter Security
- 6.1.5. Intrusion Detection
- 6.1.1. Video Surveillance System
- 6.2. Market Analysis, Insights and Forecast - by Service Type
- 6.2.1. Access Control as a Service (ACaaS)
- 6.2.2. Video Surveillance as a Service (VSaaS)
- 6.3. Market Analysis, Insights and Forecast - by Type of Deployment
- 6.3.1. On-Premises
- 6.3.2. Cloud
- 6.4. Market Analysis, Insights and Forecast - by Organization Size
- 6.4.1. SMEs
- 6.4.2. Large Enterprises
- 6.5. Market Analysis, Insights and Forecast - by End-user Industry
- 6.5.1. Government Services
- 6.5.2. Banking and Financial Services
- 6.5.3. IT and Telecommunications
- 6.5.4. Transportation and Logistics
- 6.5.5. Retail
- 6.5.6. Healthcare
- 6.5.7. Residential
- 6.5.8. Other End-user Industries
- 6.1. Market Analysis, Insights and Forecast - by System Type
- 7. Competitive Analysis
- 7.1. Company Profiles
- 7.1.1 Honeywell International Inc
- 7.1.1.1. Company Overview
- 7.1.1.2. Products
- 7.1.1.3. Company Financials
- 7.1.1.4. SWOT Analysis
- 7.1.2 Bosch Security Systems GmbH
- 7.1.2.1. Company Overview
- 7.1.2.2. Products
- 7.1.2.3. Company Financials
- 7.1.2.4. SWOT Analysis
- 7.1.3 Genetec Inc
- 7.1.3.1. Company Overview
- 7.1.3.2. Products
- 7.1.3.3. Company Financials
- 7.1.3.4. SWOT Analysis
- 7.1.4 Dahua Technology Co Ltd
- 7.1.4.1. Company Overview
- 7.1.4.2. Products
- 7.1.4.3. Company Financials
- 7.1.4.4. SWOT Analysis
- 7.1.5 Axis Communications AB
- 7.1.5.1. Company Overview
- 7.1.5.2. Products
- 7.1.5.3. Company Financials
- 7.1.5.4. SWOT Analysis
- 7.1.6 Johnson Controls
- 7.1.6.1. Company Overview
- 7.1.6.2. Products
- 7.1.6.3. Company Financials
- 7.1.6.4. SWOT Analysis
- 7.1.7 Kastle Systems
- 7.1.7.1. Company Overview
- 7.1.7.2. Products
- 7.1.7.3. Company Financials
- 7.1.7.4. SWOT Analysis
- 7.1.8 Wesco International (Anixter Inc )
- 7.1.8.1. Company Overview
- 7.1.8.2. Products
- 7.1.8.3. Company Financials
- 7.1.8.4. SWOT Analysis
- 7.1.9 Hangzhou Hikvision Digital Technology Co Ltd
- 7.1.9.1. Company Overview
- 7.1.9.2. Products
- 7.1.9.3. Company Financials
- 7.1.9.4. SWOT Analysis
- 7.1.10 HID Global Corporation
- 7.1.10.1. Company Overview
- 7.1.10.2. Products
- 7.1.10.3. Company Financials
- 7.1.10.4. SWOT Analysis
- 7.1.11 Vidsys Inc
- 7.1.11.1. Company Overview
- 7.1.11.2. Products
- 7.1.11.3. Company Financials
- 7.1.11.4. SWOT Analysis
- 7.1.1 Honeywell International Inc
- 7.2. Market Entropy
- 7.2.1 Company's Key Areas Served
- 7.2.2 Recent Developments
- 7.3. Company Market Share Analysis 2025
- 7.3.1 Top 5 Companies Market Share Analysis
- 7.3.2 Top 3 Companies Market Share Analysis
- 7.4. List of Potential Customers
- 8. Research Methodology
List of Figures
- Figure 1: North America Physical Security Market Revenue Breakdown (Million, %) by Product 2025 & 2033
- Figure 2: North America Physical Security Market Share (%) by Company 2025
List of Tables
- Table 1: North America Physical Security Market Revenue Million Forecast, by System Type 2020 & 2033
- Table 2: North America Physical Security Market Volume Billion Forecast, by System Type 2020 & 2033
- Table 3: North America Physical Security Market Revenue Million Forecast, by Service Type 2020 & 2033
- Table 4: North America Physical Security Market Volume Billion Forecast, by Service Type 2020 & 2033
- Table 5: North America Physical Security Market Revenue Million Forecast, by Type of Deployment 2020 & 2033
- Table 6: North America Physical Security Market Volume Billion Forecast, by Type of Deployment 2020 & 2033
- Table 7: North America Physical Security Market Revenue Million Forecast, by Organization Size 2020 & 2033
- Table 8: North America Physical Security Market Volume Billion Forecast, by Organization Size 2020 & 2033
- Table 9: North America Physical Security Market Revenue Million Forecast, by End-user Industry 2020 & 2033
- Table 10: North America Physical Security Market Volume Billion Forecast, by End-user Industry 2020 & 2033
- Table 11: North America Physical Security Market Revenue Million Forecast, by Region 2020 & 2033
- Table 12: North America Physical Security Market Volume Billion Forecast, by Region 2020 & 2033
- Table 13: North America Physical Security Market Revenue Million Forecast, by System Type 2020 & 2033
- Table 14: North America Physical Security Market Volume Billion Forecast, by System Type 2020 & 2033
- Table 15: North America Physical Security Market Revenue Million Forecast, by Service Type 2020 & 2033
- Table 16: North America Physical Security Market Volume Billion Forecast, by Service Type 2020 & 2033
- Table 17: North America Physical Security Market Revenue Million Forecast, by Type of Deployment 2020 & 2033
- Table 18: North America Physical Security Market Volume Billion Forecast, by Type of Deployment 2020 & 2033
- Table 19: North America Physical Security Market Revenue Million Forecast, by Organization Size 2020 & 2033
- Table 20: North America Physical Security Market Volume Billion Forecast, by Organization Size 2020 & 2033
- Table 21: North America Physical Security Market Revenue Million Forecast, by End-user Industry 2020 & 2033
- Table 22: North America Physical Security Market Volume Billion Forecast, by End-user Industry 2020 & 2033
- Table 23: North America Physical Security Market Revenue Million Forecast, by Country 2020 & 2033
- Table 24: North America Physical Security Market Volume Billion Forecast, by Country 2020 & 2033
- Table 25: United States North America Physical Security Market Revenue (Million) Forecast, by Application 2020 & 2033
- Table 26: United States North America Physical Security Market Volume (Billion) Forecast, by Application 2020 & 2033
- Table 27: Canada North America Physical Security Market Revenue (Million) Forecast, by Application 2020 & 2033
- Table 28: Canada North America Physical Security Market Volume (Billion) Forecast, by Application 2020 & 2033
- Table 29: Mexico North America Physical Security Market Revenue (Million) Forecast, by Application 2020 & 2033
- Table 30: Mexico North America Physical Security Market Volume (Billion) Forecast, by Application 2020 & 2033
Frequently Asked Questions
1. What is the projected Compound Annual Growth Rate (CAGR) of the North America Physical Security Market?
The projected CAGR is approximately 5.40%.
2. Which companies are prominent players in the North America Physical Security Market?
Key companies in the market include Honeywell International Inc, Bosch Security Systems GmbH, Genetec Inc, Dahua Technology Co Ltd, Axis Communications AB, Johnson Controls, Kastle Systems, Wesco International (Anixter Inc ), Hangzhou Hikvision Digital Technology Co Ltd, HID Global Corporation, Vidsys Inc.
3. What are the main segments of the North America Physical Security Market?
The market segments include System Type, Service Type, Type of Deployment, Organization Size, End-user Industry.
4. Can you provide details about the market size?
The market size is estimated to be USD 44.60 Million as of 2022.
5. What are some drivers contributing to market growth?
Growing Awareness Regarding the Physical Security Systems; Increasing usage of IP-Based Cameras for Video Surveillance; Innovations like AI. ML. IoT in Security Solutions.
6. What are the notable trends driving market growth?
Video Surveillance Systems Are Expected to Hold a Significant Market Share.
7. Are there any restraints impacting market growth?
Growing Awareness Regarding the Physical Security Systems; Increasing usage of IP-Based Cameras for Video Surveillance; Innovations like AI. ML. IoT in Security Solutions.
8. Can you provide examples of recent developments in the market?
October 2023: IDEMIA announced the development of a secure and standards-based converged access card for the enterprise access market. This innovation was made possible through a collaborative effort with HYPR, a renowned identity assurance company known for its passwordless authentication solutions, and Wavelynx, a trusted leader in secure and interoperable reader and credential solutions. With this new converged access card, users have the convenience of using a single badge for physical and network access while adhering to open and interoperable standards.
9. What pricing options are available for accessing the report?
Pricing options include single-user, multi-user, and enterprise licenses priced at USD 4750, USD 4950, and USD 6800 respectively.
10. Is the market size provided in terms of value or volume?
The market size is provided in terms of value, measured in Million and volume, measured in Billion.
11. Are there any specific market keywords associated with the report?
Yes, the market keyword associated with the report is "North America Physical Security Market," which aids in identifying and referencing the specific market segment covered.
12. How do I determine which pricing option suits my needs best?
The pricing options vary based on user requirements and access needs. Individual users may opt for single-user licenses, while businesses requiring broader access may choose multi-user or enterprise licenses for cost-effective access to the report.
13. Are there any additional resources or data provided in the North America Physical Security Market report?
While the report offers comprehensive insights, it's advisable to review the specific contents or supplementary materials provided to ascertain if additional resources or data are available.
14. How can I stay updated on further developments or reports in the North America Physical Security Market?
To stay informed about further developments, trends, and reports in the North America Physical Security Market, consider subscribing to industry newsletters, following relevant companies and organizations, or regularly checking reputable industry news sources and publications.
Methodology
Step 1 - Identification of Relevant Samples Size from Population Database


Step 2 - Approaches for Defining Global Market Size (Value, Volume* & Price*)

Note*: In applicable scenarios
Step 3 - Data Sources
Primary Research
- Web Analytics
- Survey Reports
- Research Institute
- Latest Research Reports
- Opinion Leaders
Secondary Research
- Annual Reports
- White Paper
- Latest Press Release
- Industry Association
- Paid Database
- Investor Presentations

Step 4 - Data Triangulation
Involves using different sources of information in order to increase the validity of a study
These sources are likely to be stakeholders in a program - participants, other researchers, program staff, other community members, and so on.
Then we put all data in single framework & apply various statistical tools to find out the dynamic on the market.
During the analysis stage, feedback from the stakeholder groups would be compared to determine areas of agreement as well as areas of divergence