

Key Insights
The Electronic Toll Collection (ETC) System market is experiencing robust growth, driven by increasing traffic congestion in urban areas and a global push for efficient transportation management. The market's Compound Annual Growth Rate (CAGR) exceeding 8% from 2019 to 2024 indicates a strong upward trajectory, projected to continue through 2033. This expansion is fueled by several key factors. Firstly, the widespread adoption of electronic payment systems and advancements in technologies like RFID (Radio-Frequency Identification) and GPS are streamlining toll collection processes, reducing wait times, and improving overall traffic flow. Secondly, governments worldwide are actively investing in infrastructure development projects, including roads, bridges, and tunnels, significantly boosting demand for ETC systems. The shift towards cashless transactions and the growing preference for automated systems are further contributing to the market's growth. The market is segmented by toll collection type (barrier, entry/exit, and electronic) and application type (bridges, roads, and tunnels), with electronic toll collection dominating the market share due to its efficiency and scalability. While initial infrastructure investments can represent a barrier to entry, the long-term operational cost savings and improved revenue collection make ETC systems increasingly attractive for both public and private entities.
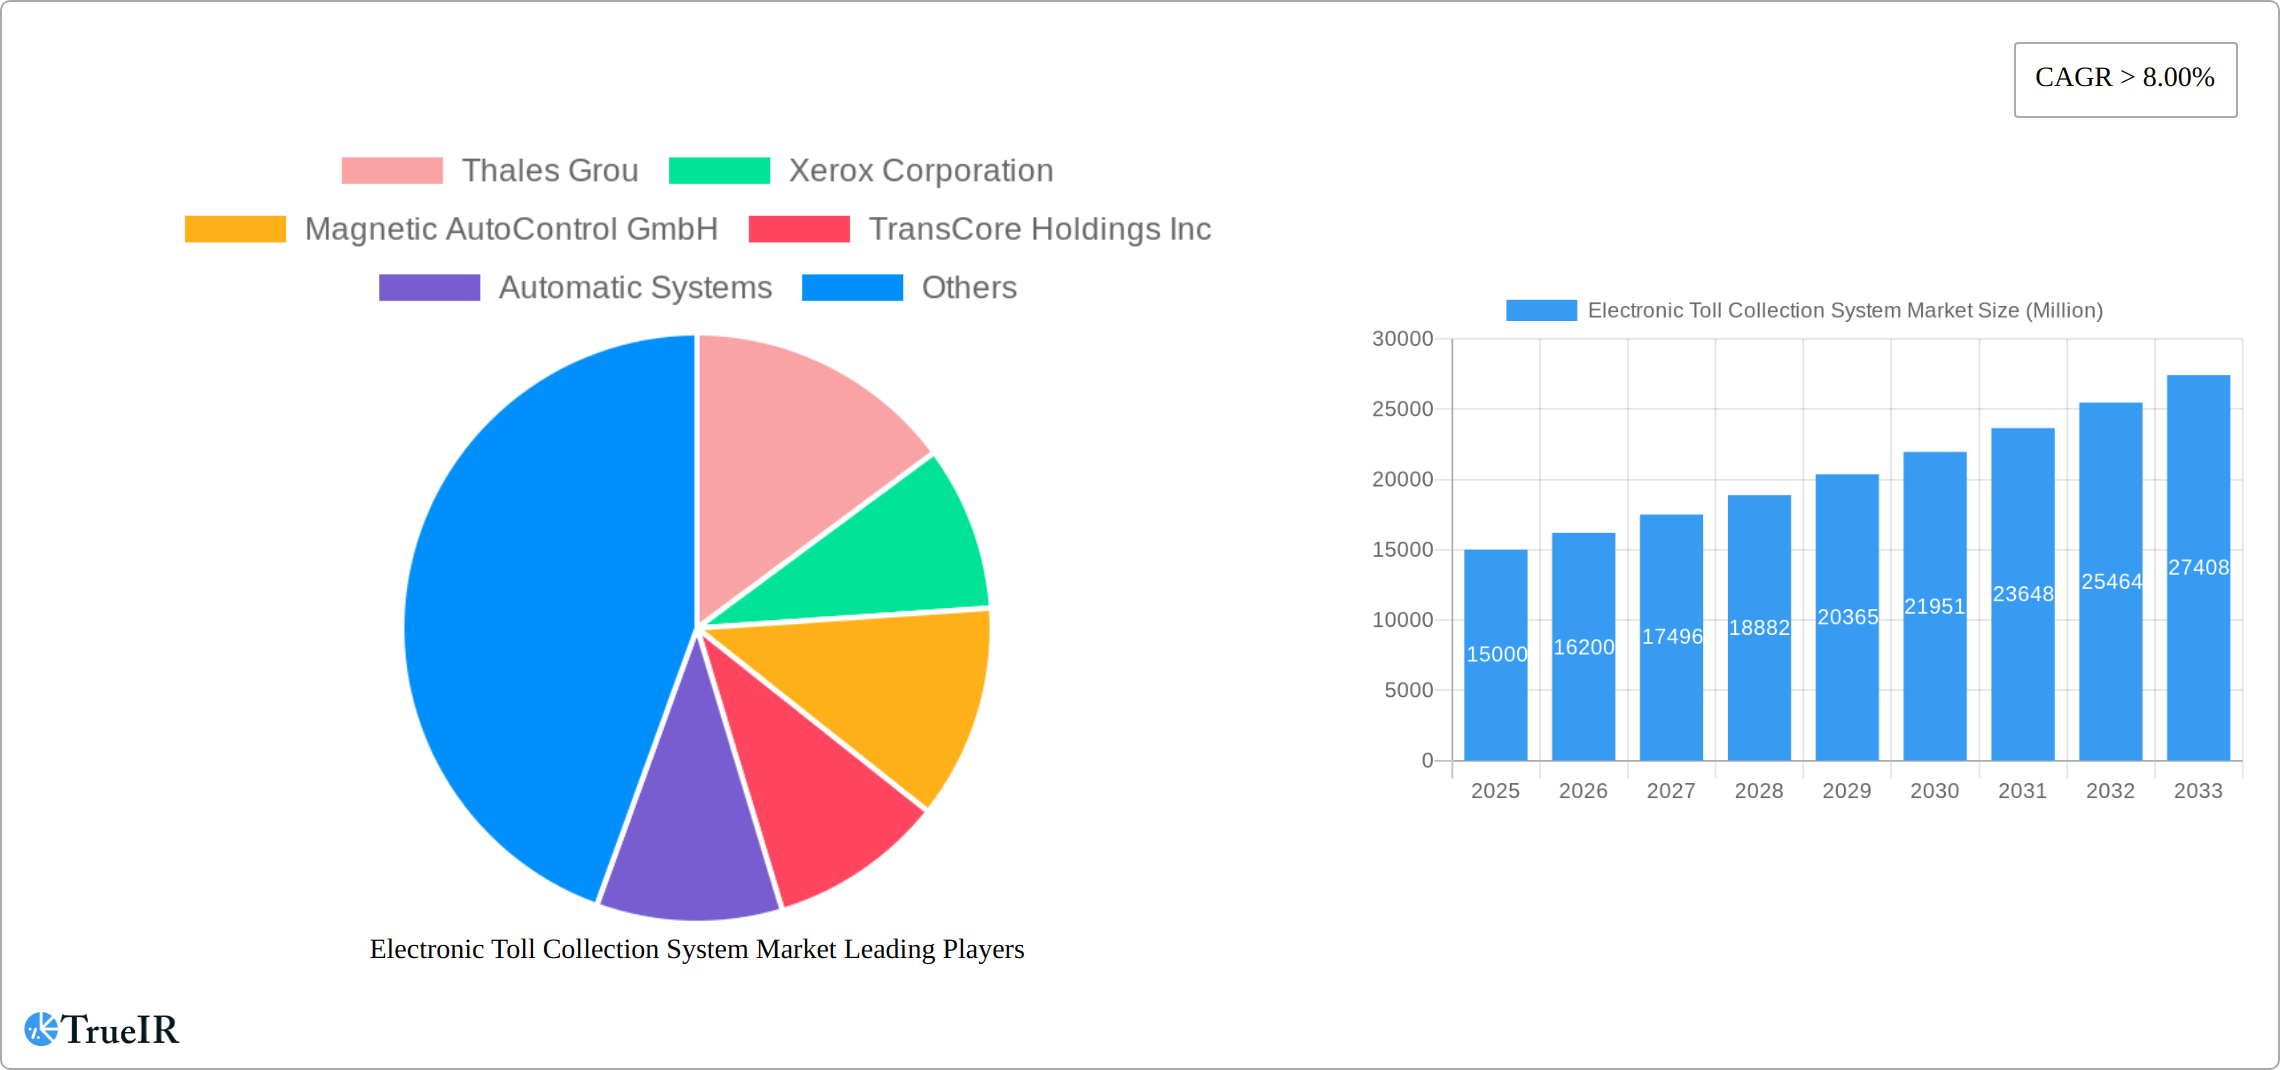
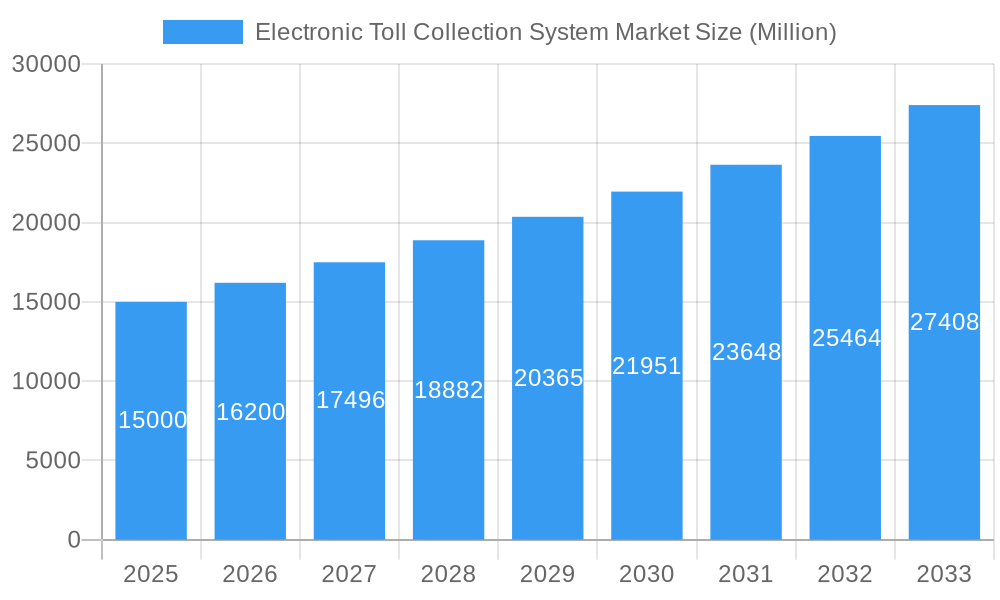
Electronic Toll Collection System Market Market Size (In Billion)
Major players in the ETC market, including Thales Group, Xerox Corporation, and TransCore Holdings Inc., are constantly innovating, integrating advanced technologies such as AI and IoT to enhance system capabilities. The market is geographically diversified, with North America and Europe currently holding significant market shares. However, the Asia-Pacific region, particularly China and India, is poised for significant growth due to rapid urbanization and expanding infrastructure development initiatives. The continued development of interoperable ETC systems and the integration of ETC with other intelligent transportation systems will further propel market expansion. While potential regulatory hurdles and cybersecurity concerns could present some challenges, the overall outlook for the ETC system market remains strongly positive, promising continued high growth in the coming years.
Electronic Toll Collection System Market Company Market Share
Electronic Toll Collection System Market Report: 2019-2033
This comprehensive report provides a detailed analysis of the Electronic Toll Collection System market, offering invaluable insights for stakeholders across the industry. Covering the period from 2019 to 2033, with a base year of 2025 and a forecast period of 2025-2033, this report leverages extensive data and expert analysis to illuminate market trends, opportunities, and challenges. The global Electronic Toll Collection System market is projected to reach xx Million by 2033, exhibiting a CAGR of xx% during the forecast period.
Electronic Toll Collection System Market Structure & Competitive Landscape
The Electronic Toll Collection System market exhibits a moderately concentrated structure, with key players holding significant market share. The Herfindahl-Hirschman Index (HHI) is estimated to be around xx, indicating a moderately competitive landscape. Innovation is a crucial driver, with companies constantly developing advanced technologies such as RFID, Bluetooth, and LiDAR-based systems to improve efficiency and accuracy. Government regulations regarding interoperability and data security significantly impact market dynamics. Product substitutes, like manual toll booths, are gradually being replaced due to increased efficiency and reduced operational costs. The market is segmented by end-user applications (bridges, roads, tunnels) and toll collection types (barrier, entry/exit, electronic).
M&A activity in the sector has been moderate, with approximately xx transactions recorded between 2019 and 2024, primarily focused on expanding geographic reach and technological capabilities. Future M&A activity is predicted to increase as companies seek to consolidate their positions and capitalize on emerging opportunities.
- Market Concentration: Moderately concentrated, HHI estimated at xx.
- Innovation Drivers: Advanced technologies like RFID, Bluetooth, and LiDAR.
- Regulatory Impacts: Stringent data security and interoperability regulations.
- Product Substitutes: Manual toll booths facing decline due to cost and efficiency factors.
- End-User Segmentation: Bridges, Roads, Tunnels.
- M&A Trends: Moderate activity (xx transactions 2019-2024), focusing on expansion and technology.
Electronic Toll Collection System Market Trends & Opportunities
The Electronic Toll Collection System market is experiencing robust growth, driven by increasing urbanization, expanding road networks, and a rising preference for seamless travel experiences. Technological advancements, including the integration of Artificial Intelligence (AI) and the Internet of Things (IoT), are enhancing system efficiency and accuracy. The market is witnessing a strong shift towards contactless toll collection systems, offering convenience and minimizing human intervention. Consumer preference for faster and more efficient payment methods fuels the market's expansion. Competitive dynamics are characterized by continuous innovation, strategic partnerships, and efforts to optimize operational efficiency. The market penetration rate for electronic toll collection systems is steadily increasing, with an estimated xx% market share in 2025, projected to rise to xx% by 2033.
Dominant Markets & Segments in Electronic Toll Collection System Market
The North American region currently holds the largest market share in the Electronic Toll Collection System market, driven by significant investments in infrastructure development and the widespread adoption of electronic toll collection systems. Within this region, the United States leads in terms of market size and growth. The Asia-Pacific region is expected to experience rapid growth in the coming years, fuelled by increasing urbanization and infrastructure projects.
By Toll Collection Type:
- Electronic Toll Collection: This segment dominates the market, driven by its convenience, efficiency, and reduced operational costs.
- Barrier Toll Collection: This segment is declining gradually due to the increasing popularity of electronic systems.
- Entry/Exit Toll Collection: This method demonstrates steady growth but slower than electronic options.
By Application Type:
- Roads: This segment commands the largest share due to the extensive road networks globally.
- Bridges & Tunnels: This segment exhibits significant growth potential due to increasing construction and modernization of these infrastructure assets.
Key Growth Drivers:
- Massive infrastructure development projects worldwide.
- Favorable government policies promoting electronic toll collection.
- Increasing preference for convenient and contactless payment solutions.
Electronic Toll Collection System Market Product Analysis
The Electronic Toll Collection (ETC) System market is characterized by a diverse and evolving product landscape. At its core, the market encompasses a spectrum of solutions ranging from foundational RFID-based systems, which have been a staple for decades, to highly sophisticated multi-lane free-flow systems. These advanced systems leverage cutting-edge technologies such as Artificial Intelligence (AI) and the Internet of Things (IoT) to enable seamless tolling without the need for vehicles to stop. The applications of these systems are broad, serving critical roles in urban and highway toll plazas, bridges, and tunnels, thereby streamlining traffic flow and reducing congestion. Competitive advantages within this market are multi-faceted, with companies striving for superiority in technological innovation, ensuring unwavering system reliability, delivering cost-effective solutions, offering seamless integration with existing infrastructure and payment gateways, and providing robust data analytics capabilities. The most advanced systems are not only adept at integrating with a variety of payment platforms, including mobile wallets and bank accounts, but also furnish invaluable data insights to traffic management authorities, aiding in better planning, resource allocation, and the optimization of transportation networks.
Key Drivers, Barriers & Challenges in Electronic Toll Collection System Market
Key Drivers:
- Urbanization and Congestion: The relentless growth of urban populations and the resultant increase in vehicular traffic are primary drivers, necessitating efficient tolling solutions to manage congestion and improve commute times.
- Smart City Initiatives: Governments worldwide are increasingly investing in smart city infrastructure, with ETC systems being a crucial component for intelligent transportation systems (ITS), promoting efficiency and sustainability.
- Demand for Enhanced Traffic Management: The ongoing need for more effective traffic management strategies, coupled with a growing awareness of environmental concerns and the desire to reduce vehicle emissions through smoother traffic flow, fuels the demand for ETC.
- Technological Advancements: The rapid integration of AI, IoT, cloud computing, and advanced data analytics is creating opportunities for more intelligent, efficient, and user-friendly ETC solutions.
- Revenue Generation and Infrastructure Funding: ETC systems provide a consistent and efficient revenue stream for transportation authorities, which is vital for funding infrastructure maintenance and development projects.
Barriers:
- High Initial Investment: The substantial upfront costs associated with implementing sophisticated ETC infrastructure, including hardware, software, and installation, can be a significant barrier for some regions and authorities.
- Interoperability and Standardization: The lack of universal standards across different ETC systems and regions can create challenges for interoperability, potentially hindering seamless travel for users across various tolling facilities.
- Public Acceptance and Adoption: Educating the public and ensuring widespread adoption of new ETC technologies, especially when replacing traditional toll collection methods, can require significant outreach and incentive programs.
Challenges:
- Data Privacy and Security: The collection and processing of vast amounts of data related to vehicle movements and payment information raise significant concerns about data privacy and the potential for cyber threats. Robust security protocols are paramount.
- Network Infrastructure Reliability: The dependency on a stable and reliable network infrastructure for real-time data transmission and system operation is crucial. Disruptions due to connectivity issues can lead to operational inefficiencies.
- Technological Obsolescence and Upgrades: The rapid pace of technological change necessitates continuous upgrades and maintenance of ETC systems to prevent obsolescence and ensure optimal performance, which can be costly.
- Maintenance and Operational Costs: Beyond the initial investment, ongoing maintenance, software updates, and operational management of ETC systems contribute to significant long-term expenditures.
- Enforcement and Compliance: Ensuring compliance with toll payment and effectively handling violations in a system that relies on automation presents its own set of operational challenges.
Growth Drivers in the Electronic Toll Collection System Market Market
The Electronic Toll Collection System market is propelled by several key factors. Government initiatives advocating for smart city development and improved infrastructure significantly impact market growth. The rising demand for convenient and efficient transportation systems, coupled with technological advancements like AI and IoT integration, further enhances market expansion. Economic growth and increasing disposable incomes in developing economies contribute to increased spending on transportation infrastructure, driving market demand.
Challenges Impacting Electronic Toll Collection System Market Growth
Significant challenges hinder market growth, notably the high initial investment costs associated with system implementation. Concerns around data privacy and security can deter adoption, while maintaining reliable network infrastructure proves crucial for seamless operation. Competition among various vendors can also create price pressures and limit profit margins. Furthermore, regulatory hurdles and complex integration procedures can delay projects and increase implementation costs.
Key Players Shaping the Electronic Toll Collection System Market Market
- Thales Group
- Xerox Corporation
- Magnetic AutoControl GmbH
- TransCore Holdings Inc
- Automatic Systems
- Feig Electronics
- TRMI Systems Integration
- Siemens AG
- Schneider Electric SE
- Nedap NV
- DENSO Corporation
- Mitsubishi Heavy Industries Ltd
Significant Electronic Toll Collection System Market Industry Milestones
- 2021 (Q3): Thales Group launched its new generation of electronic toll collection system, featuring enhanced security features and improved processing speeds, aiming to address growing concerns around data breaches.
- 2022 (Q1): A strategic partnership between TransCore Holdings Inc and Siemens AG was announced, focusing on the development of an integrated toll management solution designed for scalability and interoperability across diverse transportation networks.
- 2023 (Q2): Xerox Corporation expanded its market presence through the acquisition of a smaller, innovative toll system provider, signaling a consolidation trend and a focus on acquiring specialized technological capabilities.
- 2023 (Q4): The successful implementation of a free-flow ETC system across a major metropolitan highway in Asia demonstrated significant reductions in travel time and emissions, setting a new benchmark for urban tolling efficiency.
- 2024 (Q1): A leading technology firm unveiled a new AI-powered ETC system that utilizes advanced vehicle recognition and predictive analytics to optimize toll collection and traffic flow in real-time.
Future Outlook for Electronic Toll Collection System Market Market
The Electronic Toll Collection System market is poised for robust and sustained growth, propelled by the global impetus for infrastructure development and the accelerating adoption of advanced technologies. The future trajectory will be significantly shaped by strategic partnerships, continuous technological innovation, and the strategic expansion into emerging markets. The market presents a fertile ground for companies capable of delivering solutions that are not only reliable and secure but also cost-effective and adaptable to the dynamic needs of transportation authorities and the commuting public. The increasing integration of AI and IoT technologies is set to revolutionize ETC, ushering in an era of unprecedented efficiency and effectiveness in traffic management and overall transportation ecosystem optimization. We can anticipate a greater emphasis on integrated mobility solutions, where ETC systems seamlessly connect with other transportation services, offering a holistic and enhanced user experience. Furthermore, the development of dynamic tolling strategies, personalized payment options, and advanced data analytics for traffic prediction and management will define the next wave of innovation in this critical sector.
Electronic Toll Collection System Market Segmentation
-
1. Toll Collection Type
- 1.1. Barrier Toll Collection
- 1.2. Entry/Exit Toll Collection
- 1.3. Electronic Toll Collection
-
2. Application Type
- 2.1. Bridges
- 2.2. Roads
- 2.3. Tunnels
Electronic Toll Collection System Market Segmentation By Geography
-
1. North America
- 1.1. United States
- 1.2. Canada
- 1.3. Mexico
-
2. Europe
- 2.1. Germany
- 2.2. United Kingdom
- 2.3. France
- 2.4. Italy
- 2.5. Rest of Europe
-
3. Asia Pacific
- 3.1. China
- 3.2. Japan
- 3.3. India
- 3.4. South Korea
- 3.5. Rest of Asia Pacific
-
4. Rest of the World
- 4.1. Brazil
- 4.2. South Africa
- 4.3. Other Countries
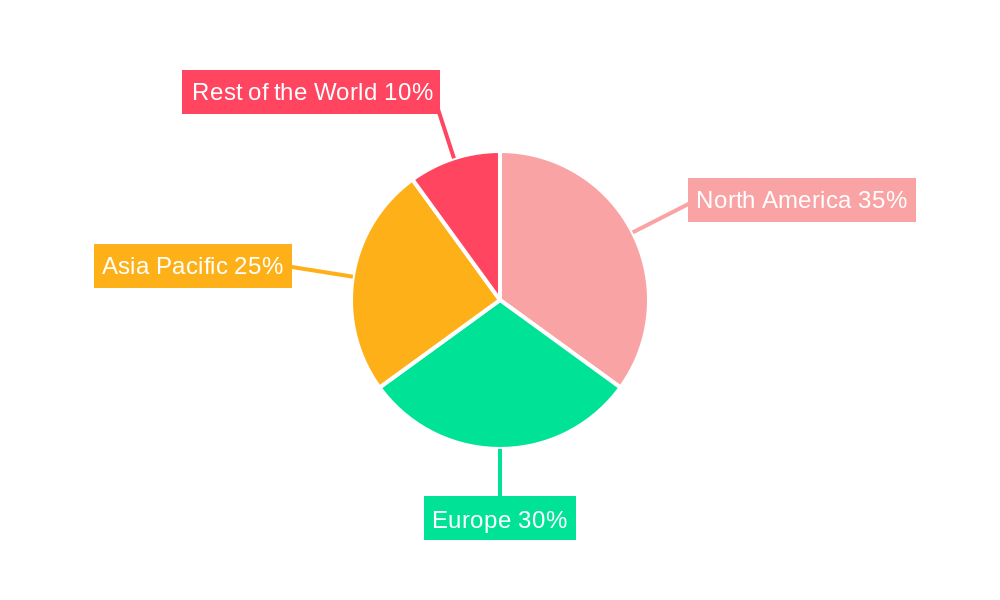
Electronic Toll Collection System Market Regional Market Share
Geographic Coverage of Electronic Toll Collection System Market
Electronic Toll Collection System Market REPORT HIGHLIGHTS
| Aspects | Details |
|---|---|
| Study Period | 2020-2034 |
| Base Year | 2025 |
| Estimated Year | 2026 |
| Forecast Period | 2026-2034 |
| Historical Period | 2020-2025 |
| Growth Rate | CAGR of 8.34% from 2020-2034 |
| Segmentation |
|
Table of Contents
- 1. Introduction
- 1.1. Research Scope
- 1.2. Market Segmentation
- 1.3. Research Objective
- 1.4. Definitions and Assumptions
- 2. Executive Summary
- 2.1. Market Snapshot
- 3. Market Dynamics
- 3.1. Market Drivers
- 3.2. Market Restrains
- 3.3. Market Trends
- 3.4. Market Opportunities
- 4. Market Factor Analysis
- 4.1. Porters Five Forces
- 4.1.1. Bargaining Power of Suppliers
- 4.1.2. Bargaining Power of Buyers
- 4.1.3. Threat of New Entrants
- 4.1.4. Threat of Substitutes
- 4.1.5. Competitive Rivalry
- 4.2. PESTEL analysis
- 4.3. BCG Analysis
- 4.3.1. Stars (High Growth, High Market Share)
- 4.3.2. Cash Cows (Low Growth, High Market Share)
- 4.3.3. Question Mark (High Growth, Low Market Share)
- 4.3.4. Dogs (Low Growth, Low Market Share)
- 4.4. Ansoff Matrix Analysis
- 4.5. Supply Chain Analysis
- 4.6. Regulatory Landscape
- 4.7. Current Market Potential and Opportunity Assessment (TAM–SAM–SOM Framework)
- 4.8. TIR Analyst Note
- 4.1. Porters Five Forces
- 5. Market Analysis, Insights and Forecast 2021-2033
- 5.1. Market Analysis, Insights and Forecast - by Toll Collection Type
- 5.1.1. Barrier Toll Collection
- 5.1.2. Entry/Exit Toll Collection
- 5.1.3. Electronic Toll Collection
- 5.2. Market Analysis, Insights and Forecast - by Application Type
- 5.2.1. Bridges
- 5.2.2. Roads
- 5.2.3. Tunnels
- 5.3. Market Analysis, Insights and Forecast - by Region
- 5.3.1. North America
- 5.3.2. Europe
- 5.3.3. Asia Pacific
- 5.3.4. Rest of the World
- 5.1. Market Analysis, Insights and Forecast - by Toll Collection Type
- 6. Global Electronic Toll Collection System Market Analysis, Insights and Forecast, 2021-2033
- 6.1. Market Analysis, Insights and Forecast - by Toll Collection Type
- 6.1.1. Barrier Toll Collection
- 6.1.2. Entry/Exit Toll Collection
- 6.1.3. Electronic Toll Collection
- 6.2. Market Analysis, Insights and Forecast - by Application Type
- 6.2.1. Bridges
- 6.2.2. Roads
- 6.2.3. Tunnels
- 6.1. Market Analysis, Insights and Forecast - by Toll Collection Type
- 7. North America Electronic Toll Collection System Market Analysis, Insights and Forecast, 2020-2032
- 7.1. Market Analysis, Insights and Forecast - by Toll Collection Type
- 7.1.1. Barrier Toll Collection
- 7.1.2. Entry/Exit Toll Collection
- 7.1.3. Electronic Toll Collection
- 7.2. Market Analysis, Insights and Forecast - by Application Type
- 7.2.1. Bridges
- 7.2.2. Roads
- 7.2.3. Tunnels
- 7.1. Market Analysis, Insights and Forecast - by Toll Collection Type
- 8. Europe Electronic Toll Collection System Market Analysis, Insights and Forecast, 2020-2032
- 8.1. Market Analysis, Insights and Forecast - by Toll Collection Type
- 8.1.1. Barrier Toll Collection
- 8.1.2. Entry/Exit Toll Collection
- 8.1.3. Electronic Toll Collection
- 8.2. Market Analysis, Insights and Forecast - by Application Type
- 8.2.1. Bridges
- 8.2.2. Roads
- 8.2.3. Tunnels
- 8.1. Market Analysis, Insights and Forecast - by Toll Collection Type
- 9. Asia Pacific Electronic Toll Collection System Market Analysis, Insights and Forecast, 2020-2032
- 9.1. Market Analysis, Insights and Forecast - by Toll Collection Type
- 9.1.1. Barrier Toll Collection
- 9.1.2. Entry/Exit Toll Collection
- 9.1.3. Electronic Toll Collection
- 9.2. Market Analysis, Insights and Forecast - by Application Type
- 9.2.1. Bridges
- 9.2.2. Roads
- 9.2.3. Tunnels
- 9.1. Market Analysis, Insights and Forecast - by Toll Collection Type
- 10. Rest of the World Electronic Toll Collection System Market Analysis, Insights and Forecast, 2020-2032
- 10.1. Market Analysis, Insights and Forecast - by Toll Collection Type
- 10.1.1. Barrier Toll Collection
- 10.1.2. Entry/Exit Toll Collection
- 10.1.3. Electronic Toll Collection
- 10.2. Market Analysis, Insights and Forecast - by Application Type
- 10.2.1. Bridges
- 10.2.2. Roads
- 10.2.3. Tunnels
- 10.1. Market Analysis, Insights and Forecast - by Toll Collection Type
- 11. Competitive Analysis
- 11.1. Company Profiles
- 11.1.1 Thales Grou
- 11.1.1.1. Company Overview
- 11.1.1.2. Products
- 11.1.1.3. Company Financials
- 11.1.1.4. SWOT Analysis
- 11.1.2 Xerox Corporation
- 11.1.2.1. Company Overview
- 11.1.2.2. Products
- 11.1.2.3. Company Financials
- 11.1.2.4. SWOT Analysis
- 11.1.3 Magnetic AutoControl GmbH
- 11.1.3.1. Company Overview
- 11.1.3.2. Products
- 11.1.3.3. Company Financials
- 11.1.3.4. SWOT Analysis
- 11.1.4 TransCore Holdings Inc
- 11.1.4.1. Company Overview
- 11.1.4.2. Products
- 11.1.4.3. Company Financials
- 11.1.4.4. SWOT Analysis
- 11.1.5 Automatic Systems
- 11.1.5.1. Company Overview
- 11.1.5.2. Products
- 11.1.5.3. Company Financials
- 11.1.5.4. SWOT Analysis
- 11.1.6 Feig Electronics
- 11.1.6.1. Company Overview
- 11.1.6.2. Products
- 11.1.6.3. Company Financials
- 11.1.6.4. SWOT Analysis
- 11.1.7 TRMI Systems Integration
- 11.1.7.1. Company Overview
- 11.1.7.2. Products
- 11.1.7.3. Company Financials
- 11.1.7.4. SWOT Analysis
- 11.1.8 Siemens AG
- 11.1.8.1. Company Overview
- 11.1.8.2. Products
- 11.1.8.3. Company Financials
- 11.1.8.4. SWOT Analysis
- 11.1.9 Schneider Electric SE
- 11.1.9.1. Company Overview
- 11.1.9.2. Products
- 11.1.9.3. Company Financials
- 11.1.9.4. SWOT Analysis
- 11.1.10 Nedap NV
- 11.1.10.1. Company Overview
- 11.1.10.2. Products
- 11.1.10.3. Company Financials
- 11.1.10.4. SWOT Analysis
- 11.1.11 DENSO Corporation
- 11.1.11.1. Company Overview
- 11.1.11.2. Products
- 11.1.11.3. Company Financials
- 11.1.11.4. SWOT Analysis
- 11.1.12 Mitsubishi Heavy Industries Ltd
- 11.1.12.1. Company Overview
- 11.1.12.2. Products
- 11.1.12.3. Company Financials
- 11.1.12.4. SWOT Analysis
- 11.1.1 Thales Grou
- 11.2. Market Entropy
- 11.2.1 Company's Key Areas Served
- 11.2.2 Recent Developments
- 11.3. Company Market Share Analysis 2025
- 11.3.1 Top 5 Companies Market Share Analysis
- 11.3.2 Top 3 Companies Market Share Analysis
- 11.4. List of Potential Customers
- 12. Research Methodology
List of Figures
- Figure 1: Global Electronic Toll Collection System Market Revenue Breakdown (billion, %) by Region 2025 & 2033
- Figure 2: North America Electronic Toll Collection System Market Revenue (billion), by Toll Collection Type 2025 & 2033
- Figure 3: North America Electronic Toll Collection System Market Revenue Share (%), by Toll Collection Type 2025 & 2033
- Figure 4: North America Electronic Toll Collection System Market Revenue (billion), by Application Type 2025 & 2033
- Figure 5: North America Electronic Toll Collection System Market Revenue Share (%), by Application Type 2025 & 2033
- Figure 6: North America Electronic Toll Collection System Market Revenue (billion), by Country 2025 & 2033
- Figure 7: North America Electronic Toll Collection System Market Revenue Share (%), by Country 2025 & 2033
- Figure 8: Europe Electronic Toll Collection System Market Revenue (billion), by Toll Collection Type 2025 & 2033
- Figure 9: Europe Electronic Toll Collection System Market Revenue Share (%), by Toll Collection Type 2025 & 2033
- Figure 10: Europe Electronic Toll Collection System Market Revenue (billion), by Application Type 2025 & 2033
- Figure 11: Europe Electronic Toll Collection System Market Revenue Share (%), by Application Type 2025 & 2033
- Figure 12: Europe Electronic Toll Collection System Market Revenue (billion), by Country 2025 & 2033
- Figure 13: Europe Electronic Toll Collection System Market Revenue Share (%), by Country 2025 & 2033
- Figure 14: Asia Pacific Electronic Toll Collection System Market Revenue (billion), by Toll Collection Type 2025 & 2033
- Figure 15: Asia Pacific Electronic Toll Collection System Market Revenue Share (%), by Toll Collection Type 2025 & 2033
- Figure 16: Asia Pacific Electronic Toll Collection System Market Revenue (billion), by Application Type 2025 & 2033
- Figure 17: Asia Pacific Electronic Toll Collection System Market Revenue Share (%), by Application Type 2025 & 2033
- Figure 18: Asia Pacific Electronic Toll Collection System Market Revenue (billion), by Country 2025 & 2033
- Figure 19: Asia Pacific Electronic Toll Collection System Market Revenue Share (%), by Country 2025 & 2033
- Figure 20: Rest of the World Electronic Toll Collection System Market Revenue (billion), by Toll Collection Type 2025 & 2033
- Figure 21: Rest of the World Electronic Toll Collection System Market Revenue Share (%), by Toll Collection Type 2025 & 2033
- Figure 22: Rest of the World Electronic Toll Collection System Market Revenue (billion), by Application Type 2025 & 2033
- Figure 23: Rest of the World Electronic Toll Collection System Market Revenue Share (%), by Application Type 2025 & 2033
- Figure 24: Rest of the World Electronic Toll Collection System Market Revenue (billion), by Country 2025 & 2033
- Figure 25: Rest of the World Electronic Toll Collection System Market Revenue Share (%), by Country 2025 & 2033
List of Tables
- Table 1: Global Electronic Toll Collection System Market Revenue billion Forecast, by Toll Collection Type 2020 & 2033
- Table 2: Global Electronic Toll Collection System Market Revenue billion Forecast, by Application Type 2020 & 2033
- Table 3: Global Electronic Toll Collection System Market Revenue billion Forecast, by Region 2020 & 2033
- Table 4: Global Electronic Toll Collection System Market Revenue billion Forecast, by Toll Collection Type 2020 & 2033
- Table 5: Global Electronic Toll Collection System Market Revenue billion Forecast, by Application Type 2020 & 2033
- Table 6: Global Electronic Toll Collection System Market Revenue billion Forecast, by Country 2020 & 2033
- Table 7: United States Electronic Toll Collection System Market Revenue (billion) Forecast, by Application 2020 & 2033
- Table 8: Canada Electronic Toll Collection System Market Revenue (billion) Forecast, by Application 2020 & 2033
- Table 9: Mexico Electronic Toll Collection System Market Revenue (billion) Forecast, by Application 2020 & 2033
- Table 10: Global Electronic Toll Collection System Market Revenue billion Forecast, by Toll Collection Type 2020 & 2033
- Table 11: Global Electronic Toll Collection System Market Revenue billion Forecast, by Application Type 2020 & 2033
- Table 12: Global Electronic Toll Collection System Market Revenue billion Forecast, by Country 2020 & 2033
- Table 13: Germany Electronic Toll Collection System Market Revenue (billion) Forecast, by Application 2020 & 2033
- Table 14: United Kingdom Electronic Toll Collection System Market Revenue (billion) Forecast, by Application 2020 & 2033
- Table 15: France Electronic Toll Collection System Market Revenue (billion) Forecast, by Application 2020 & 2033
- Table 16: Italy Electronic Toll Collection System Market Revenue (billion) Forecast, by Application 2020 & 2033
- Table 17: Rest of Europe Electronic Toll Collection System Market Revenue (billion) Forecast, by Application 2020 & 2033
- Table 18: Global Electronic Toll Collection System Market Revenue billion Forecast, by Toll Collection Type 2020 & 2033
- Table 19: Global Electronic Toll Collection System Market Revenue billion Forecast, by Application Type 2020 & 2033
- Table 20: Global Electronic Toll Collection System Market Revenue billion Forecast, by Country 2020 & 2033
- Table 21: China Electronic Toll Collection System Market Revenue (billion) Forecast, by Application 2020 & 2033
- Table 22: Japan Electronic Toll Collection System Market Revenue (billion) Forecast, by Application 2020 & 2033
- Table 23: India Electronic Toll Collection System Market Revenue (billion) Forecast, by Application 2020 & 2033
- Table 24: South Korea Electronic Toll Collection System Market Revenue (billion) Forecast, by Application 2020 & 2033
- Table 25: Rest of Asia Pacific Electronic Toll Collection System Market Revenue (billion) Forecast, by Application 2020 & 2033
- Table 26: Global Electronic Toll Collection System Market Revenue billion Forecast, by Toll Collection Type 2020 & 2033
- Table 27: Global Electronic Toll Collection System Market Revenue billion Forecast, by Application Type 2020 & 2033
- Table 28: Global Electronic Toll Collection System Market Revenue billion Forecast, by Country 2020 & 2033
- Table 29: Brazil Electronic Toll Collection System Market Revenue (billion) Forecast, by Application 2020 & 2033
- Table 30: South Africa Electronic Toll Collection System Market Revenue (billion) Forecast, by Application 2020 & 2033
- Table 31: Other Countries Electronic Toll Collection System Market Revenue (billion) Forecast, by Application 2020 & 2033
Frequently Asked Questions
1. What is the projected Compound Annual Growth Rate (CAGR) of the Electronic Toll Collection System Market?
The projected CAGR is approximately 8.34%.
2. Which companies are prominent players in the Electronic Toll Collection System Market?
Key companies in the market include Thales Grou, Xerox Corporation, Magnetic AutoControl GmbH, TransCore Holdings Inc, Automatic Systems, Feig Electronics, TRMI Systems Integration, Siemens AG, Schneider Electric SE, Nedap NV, DENSO Corporation, Mitsubishi Heavy Industries Ltd.
3. What are the main segments of the Electronic Toll Collection System Market?
The market segments include Toll Collection Type, Application Type.
4. Can you provide details about the market size?
The market size is estimated to be USD 10.94 billion as of 2022.
5. What are some drivers contributing to market growth?
Rising Automotive Vehicle Sales Anticipated to Drive the Market.
6. What are the notable trends driving market growth?
Electronic Toll Collection is Expected to Witness the Highest Growth Rate.
7. Are there any restraints impacting market growth?
High Initial Cost Acting as Barrier for the Market.
8. Can you provide examples of recent developments in the market?
N/A
9. What pricing options are available for accessing the report?
Pricing options include single-user, multi-user, and enterprise licenses priced at USD 4750, USD 5250, and USD 8750 respectively.
10. Is the market size provided in terms of value or volume?
The market size is provided in terms of value, measured in billion.
11. Are there any specific market keywords associated with the report?
Yes, the market keyword associated with the report is "Electronic Toll Collection System Market," which aids in identifying and referencing the specific market segment covered.
12. How do I determine which pricing option suits my needs best?
The pricing options vary based on user requirements and access needs. Individual users may opt for single-user licenses, while businesses requiring broader access may choose multi-user or enterprise licenses for cost-effective access to the report.
13. Are there any additional resources or data provided in the Electronic Toll Collection System Market report?
While the report offers comprehensive insights, it's advisable to review the specific contents or supplementary materials provided to ascertain if additional resources or data are available.
14. How can I stay updated on further developments or reports in the Electronic Toll Collection System Market?
To stay informed about further developments, trends, and reports in the Electronic Toll Collection System Market, consider subscribing to industry newsletters, following relevant companies and organizations, or regularly checking reputable industry news sources and publications.
Methodology
Step 1 - Identification of Relevant Samples Size from Population Database


Step 2 - Approaches for Defining Global Market Size (Value, Volume* & Price*)

Note*: In applicable scenarios
Step 3 - Data Sources
Primary Research
- Web Analytics
- Survey Reports
- Research Institute
- Latest Research Reports
- Opinion Leaders
Secondary Research
- Annual Reports
- White Paper
- Latest Press Release
- Industry Association
- Paid Database
- Investor Presentations

Step 4 - Data Triangulation
Involves using different sources of information in order to increase the validity of a study
These sources are likely to be stakeholders in a program - participants, other researchers, program staff, other community members, and so on.
Then we put all data in single framework & apply various statistical tools to find out the dynamic on the market.
During the analysis stage, feedback from the stakeholder groups would be compared to determine areas of agreement as well as areas of divergence