

Key Insights
The North America automotive displays industry is poised for significant expansion, driven by robust technological advancements and increasing consumer demand for sophisticated in-vehicle experiences. Valued at $17.2 billion in 2024, the market is projected to grow at a compelling Compound Annual Growth Rate (CAGR) of 8.2% from 2025 to 2033. This growth is largely fueled by the integration of advanced display technologies like OLED and TFT-LCD across various vehicle types, including passenger cars and commercial vehicles. Key applications such as center stack displays, instrument cluster displays, and heads-up displays are becoming standard features, enhancing safety, convenience, and entertainment for drivers and passengers. The increasing complexity and interconnectedness of vehicle systems necessitate larger, higher-resolution, and more interactive displays, directly contributing to market expansion. Furthermore, the growing popularity of electric vehicles (EVs) and autonomous driving technologies, which rely heavily on advanced display interfaces for information delivery and control, presents a substantial growth avenue for automotive display manufacturers in the region.
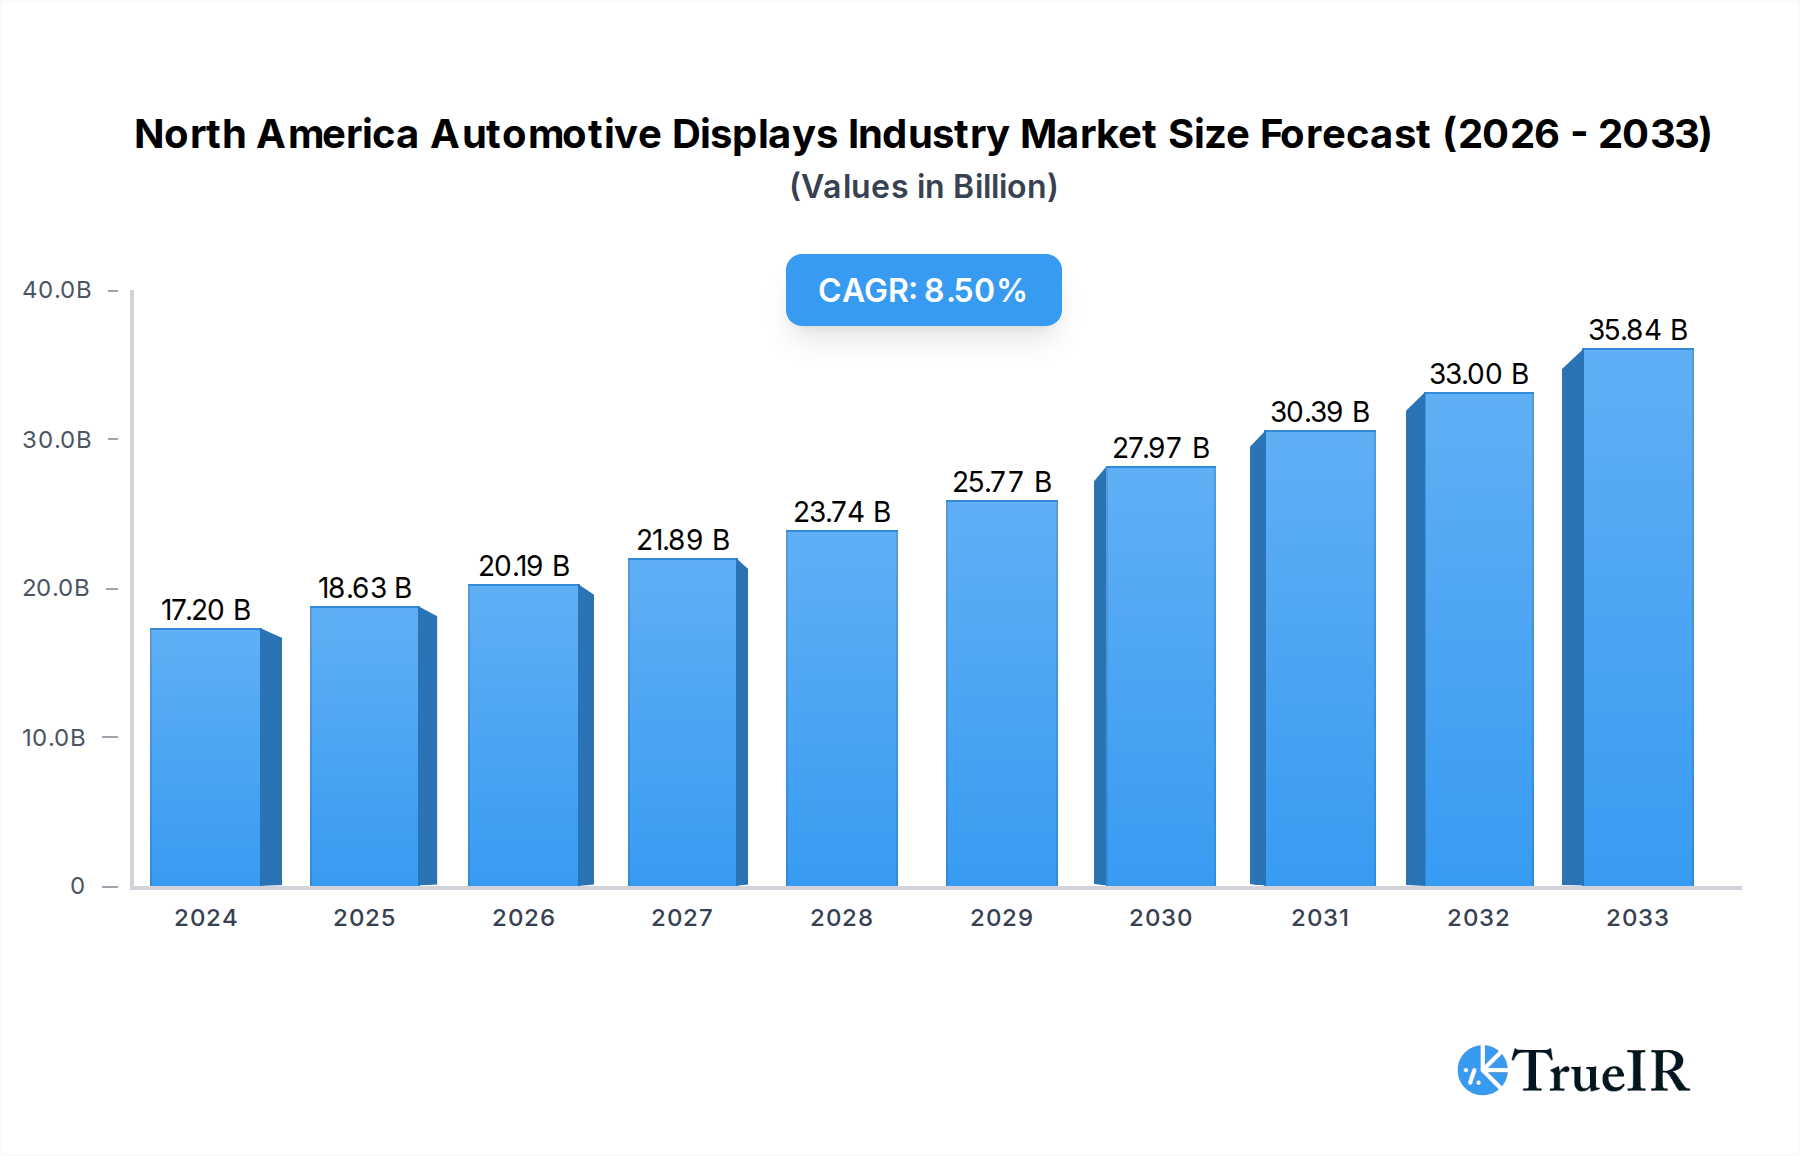
North America Automotive Displays Industry Market Size (In Billion)
Several factors are propelling this upward trajectory. The escalating trend of vehicle electrification and the concurrent development of autonomous driving systems are fundamentally reshaping automotive interiors, making advanced display solutions indispensable. These technologies demand intuitive and visually rich interfaces for navigation, driver assistance systems, infotainment, and vehicle status monitoring. The shift towards larger and more immersive displays, including center stack and instrument cluster screens, is a direct response to consumer expectations for a premium and technologically advanced driving environment. Additionally, the growing adoption of augmented reality (AR) powered heads-up displays (HUDs) promises to revolutionize driver information delivery by overlaying critical data onto the driver's field of vision. While the market is experiencing robust growth, challenges such as the high cost of advanced display technologies and the need for stringent safety certifications for automotive-grade components could present hurdles. However, ongoing innovation in display manufacturing and increasing production volumes are expected to mitigate these concerns, ensuring sustained growth in the North American automotive displays market.

North America Automotive Displays Industry Company Market Share
North America Automotive Displays Industry Market Analysis Report 2025-2033: Unveiling Growth, Innovation, and Competitive Dynamics
This comprehensive report delivers an in-depth analysis of the North America automotive displays industry, offering critical insights into market structure, trends, dominant segments, product innovations, key players, and future outlook. Covering the historical period from 2019 to 2024 and projecting growth through 2033, with a base and estimated year of 2025, this study is an indispensable resource for stakeholders seeking to navigate this rapidly evolving sector. With an estimated market size exceeding USD 30 billion in 2025, the North America automotive displays market is poised for substantial expansion, driven by advancements in in-car technology, evolving consumer demands, and the increasing integration of digital interfaces.
North America Automotive Displays Industry Market Structure & Competitive Landscape
The North America automotive displays industry exhibits a moderately concentrated market structure, characterized by the presence of both large, established Tier-1 suppliers and innovative niche players. Key innovation drivers include the pursuit of enhanced driver experience, safety features, and the integration of advanced infotainment systems. Regulatory impacts, such as evolving safety standards and mandates for digital instrument clusters, are also shaping product development and market entry strategies. Product substitutes are limited given the inherent need for visual information in vehicles, though advancements in projected displays and augmented reality could present future competition. End-user segmentation is dominated by the passenger car segment, with commercial vehicles showing increasing adoption. Mergers and acquisitions (M&A) trends are observed as companies seek to consolidate portfolios, gain technological advantages, and expand their geographical reach. The M&A volume in the past five years has been estimated at over USD 5 billion. Concentration ratios for the top five players are estimated to be around 60-65%.
- Market Concentration: Moderately concentrated, with key players dominating market share.
- Innovation Drivers: Enhanced driver experience, safety features, infotainment integration, electrification.
- Regulatory Impacts: Safety standards, digital instrument cluster mandates, emissions regulations indirectly influencing vehicle technology adoption.
- Product Substitutes: Emerging technologies like augmented reality and projection displays are potential long-term substitutes.
- End-User Segmentation: Dominated by Passenger Cars; growing adoption in Commercial Vehicles.
- M&A Trends: Strategic acquisitions for technology, market access, and portfolio expansion.
North America Automotive Displays Industry Market Trends & Opportunities
The North America automotive displays market is experiencing robust growth, projected to expand at a Compound Annual Growth Rate (CAGR) of approximately 12.5% between 2025 and 2033, reaching an estimated market size of over USD 80 billion by 2033. This expansion is fueled by an insatiable demand for sophisticated in-car digital experiences, driven by increasing consumer expectations for connectivity, advanced driver-assistance systems (ADAS), and personalized infotainment. The push towards electric vehicles (EVs) and autonomous driving is further accelerating the adoption of larger, more complex, and interactive displays. Technological shifts are prominently featuring the transition from traditional LCDs to more vibrant and power-efficient OLED and Micro-LED technologies, offering superior contrast ratios and flexible form factors. The integration of AI and machine learning into display systems to personalize user interfaces and provide contextual information is a significant trend.
Consumer preferences are increasingly leaning towards seamless integration of personal devices with vehicle systems, demanding intuitive user interfaces and high-resolution graphics. The desire for augmented reality (AR) heads-up displays (HUDs) that overlay critical driving information onto the windshield is gaining traction, enhancing safety and navigation. The competitive dynamics are characterized by intense R&D investments in display technologies, software integration, and user experience design. Opportunities abound for suppliers who can offer integrated cockpit solutions, advanced display technologies, and software platforms that enable new functionalities. The penetration rate of advanced display technologies in new vehicle models is expected to surpass 70% by 2033. The market also presents opportunities in the aftermarket segment, as consumers look to upgrade older vehicles with modern display systems. The overall market size in 2025 is estimated to be USD 32 billion.
Dominant Markets & Segments in North America Automotive Displays Industry
Within the North America automotive displays industry, Passenger Cars represent the dominant vehicle type segment, accounting for an estimated 85% of the market share in 2025. This dominance is attributed to the higher production volumes and the increasing demand for premium features and advanced technology in the mainstream and luxury passenger vehicle segments. The Instrument Cluster Display and Center Stack Display are the most prominent product types, collectively representing over 70% of the market. These displays are crucial for conveying essential driving information, navigation, and infotainment, with a growing trend towards larger, more integrated digital cockpits.
In terms of technology, TFT-LCD currently holds the largest market share due to its cost-effectiveness and proven reliability, but OLED technology is rapidly gaining traction, especially in premium vehicles, owing to its superior visual quality and flexibility. The OEM sales channel is the primary revenue generator, accounting for over 90% of the market, reflecting the integrated nature of display system procurement during vehicle manufacturing.
- Dominant Vehicle Type: Passenger Cars
- Growth Drivers: High production volumes, consumer demand for enhanced features, integration of ADAS and infotainment.
- Dominant Product Types: Instrument Cluster Display, Center Stack Display
- Growth Drivers: Essential for driving information, navigation, and infotainment; trend towards digital cockpits and large-format displays.
- Dominant Technology (Current): TFT-LCD
- Growth Drivers: Cost-effectiveness, established supply chains, reliability.
- Emerging Technology: OLED, Micro-LED for premium segments and advanced features.
- Dominant Sales Type: OEM
- Growth Drivers: Integrated vehicle design and manufacturing, strong relationships with automotive manufacturers.
- Opportunity: Growing aftermarket for retrofitting and upgrades.
North America Automotive Displays Industry Product Analysis
Product innovation in the North America automotive displays industry is primarily focused on enhancing user experience, safety, and integration. Advancements in display technologies such as OLED and Micro-LED are enabling thinner, more flexible, and visually superior screens, allowing for curved and wraparound cockpit designs. Heads-up displays (HUDs) are evolving beyond basic speed readouts to incorporate augmented reality (AR) overlays, projecting navigation cues and hazard warnings directly into the driver's line of sight. The integration of intelligent software platforms allows for personalized content delivery and seamless interaction with vehicle systems and external devices. These innovations provide competitive advantages by offering OEMs differentiated features, improved safety, and a more engaging driving environment. The market fit is strong as these advancements directly address consumer demand for modern, technologically advanced vehicles.
Key Drivers, Barriers & Challenges in North America Automotive Displays Industry
The North America automotive displays industry is propelled by several key drivers, including the relentless advancement of automotive technology, particularly in electrification and autonomous driving, which necessitate sophisticated display solutions. Increasing consumer demand for immersive in-car digital experiences and the growing adoption of connectivity features also serve as significant growth catalysts. Furthermore, government initiatives and evolving safety regulations that encourage advanced driver-assistance systems (ADAS) indirectly boost display integration. The estimated market size in 2025 is USD 32 billion.
However, the industry faces considerable barriers and challenges. The high cost of advanced display technologies, such as OLED and large-format screens, can limit their adoption in mass-market vehicles. Supply chain disruptions, particularly for critical components and raw materials, pose a persistent risk to production volumes and cost stability, impacting an estimated 15% of projected output. Intense competitive pressures among established players and emerging technology providers lead to ongoing pricing challenges and the need for continuous innovation. Regulatory hurdles related to display content and driver distraction also require careful consideration and compliance. The complexity of software integration and the need for robust cybersecurity measures add further layers of challenge.
Growth Drivers in the North America Automotive Displays Industry Market
The North America automotive displays industry is experiencing significant growth driven by several potent factors. The accelerating adoption of Electric Vehicles (EVs) and the progression towards autonomous driving technologies are fundamental catalysts, demanding more advanced and integrated digital interfaces for both driver and passenger information. Consumer appetite for in-car connectivity, sophisticated infotainment systems, and personalized user experiences is escalating, pushing manufacturers to equip vehicles with larger, higher-resolution, and more interactive displays. Technological innovations, such as the increasing implementation of OLED and Micro-LED technologies, offer superior visual fidelity and design flexibility, enhancing the overall vehicle cabin aesthetic and functionality. Furthermore, evolving safety standards and the integration of advanced driver-assistance systems (ADAS) necessitate clear and intuitive visual feedback, further driving display demand.
Challenges Impacting North America Automotive Displays Industry Growth
Despite robust growth, the North America automotive displays industry faces several significant challenges. The substantial research and development costs associated with pioneering new display technologies and integrated cockpit solutions create a high barrier to entry and require considerable capital investment. Supply chain vulnerabilities, including the sourcing of specialized semiconductors and display components, can lead to production delays and cost fluctuations, impacting an estimated 10% of potential revenue. Intense competition among global suppliers drives down profit margins and necessitates continuous innovation to maintain market share. Regulatory complexities, particularly concerning driver distraction from in-car displays and evolving safety standards for ADAS interfaces, require careful design and implementation to ensure compliance. The high cost of advanced display technologies, such as large OLED panels, can also limit their widespread adoption in budget-conscious vehicle segments, creating a segmentation challenge.
Key Players Shaping the North America Automotive Displays Industry Market
- Magneti Marelli SpA
- Hitachi Automotive Systems
- Hyundai Mobis
- Visteon Corporation
- Continental AG
- Robert Bosch GmbH
- Delphi Technologies
- DENSO Corporation
- LG Electronics
- MTA S p A
Significant North America Automotive Displays Industry Industry Milestones
- January 2022: Renault introduces the OpenR Link interface in the Megane E-Tech vehicle, featuring two large screens (12.3-inch digital instrument cluster and a 12-inch vertical infotainment display) supplied by Continental AG, showcasing an integrated and smartphone-like user experience.
- Early 2022: Panasonic Automotive Systems Co., Ltd. supplies its 11.5-inch windshield head-up display (WS HUD) for the Nissan Rogue, marking its integration into popular crossover vehicles.
- May 2022: Panasonic Automotive Systems Co., Ltd. announces that its 11.5-inch windshield head-up display (WS HUD) has been adopted for Nissan Motor Co., Ltd.'s new Ariya crossover electric vehicle (EV), highlighting advancements in AR HUD technology for EVs.
- June 2022: Visteon Corporation introduces TrueColor Image Enhancement technology, a self-contained image processing solution designed to significantly improve display legibility across diverse lighting conditions by utilizing dynamic algorithms and a combination of hardware and software components.
Future Outlook for North America Automotive Displays Industry Market
The future outlook for the North America automotive displays industry is exceptionally promising, driven by an unstoppable wave of technological innovation and evolving consumer expectations. The continued push towards electrification and autonomous driving will fundamentally reshape the automotive interior, with displays becoming central to the user experience, safety, and connectivity. Expect to see a proliferation of larger, more immersive, and highly interactive displays, including curved and transparent screen technologies. Augmented Reality (AR) HUDs will become increasingly sophisticated, seamlessly blending digital information with the physical driving environment. The integration of AI and advanced software will enable highly personalized and predictive user interfaces. Opportunities for market growth will lie in offering comprehensive cockpit solutions, advanced display technologies that prioritize energy efficiency and durability, and robust software platforms that facilitate seamless connectivity and advanced functionalities. The market is projected to witness sustained double-digit growth, fueled by these transformative trends.
North America Automotive Displays Industry Segmentation
-
1. Vehicle Type
- 1.1. Passenger Cars
- 1.2. Commercial Vehicles
-
2. Technology Type
- 2.1. LCD
- 2.2. TFT-LCD
- 2.3. OLED
-
3. Product Type
- 3.1. Center Stack Display
- 3.2. Instrument Cluster Display
- 3.3. Heads-up Display
- 3.4. Rear Seat Entertainment System
-
4. Sales Type
- 4.1. OEM
- 4.2. Aftermarket
North America Automotive Displays Industry Segmentation By Geography
-
1. North America
- 1.1. United States
- 1.2. Canada
- 1.3. Mexico
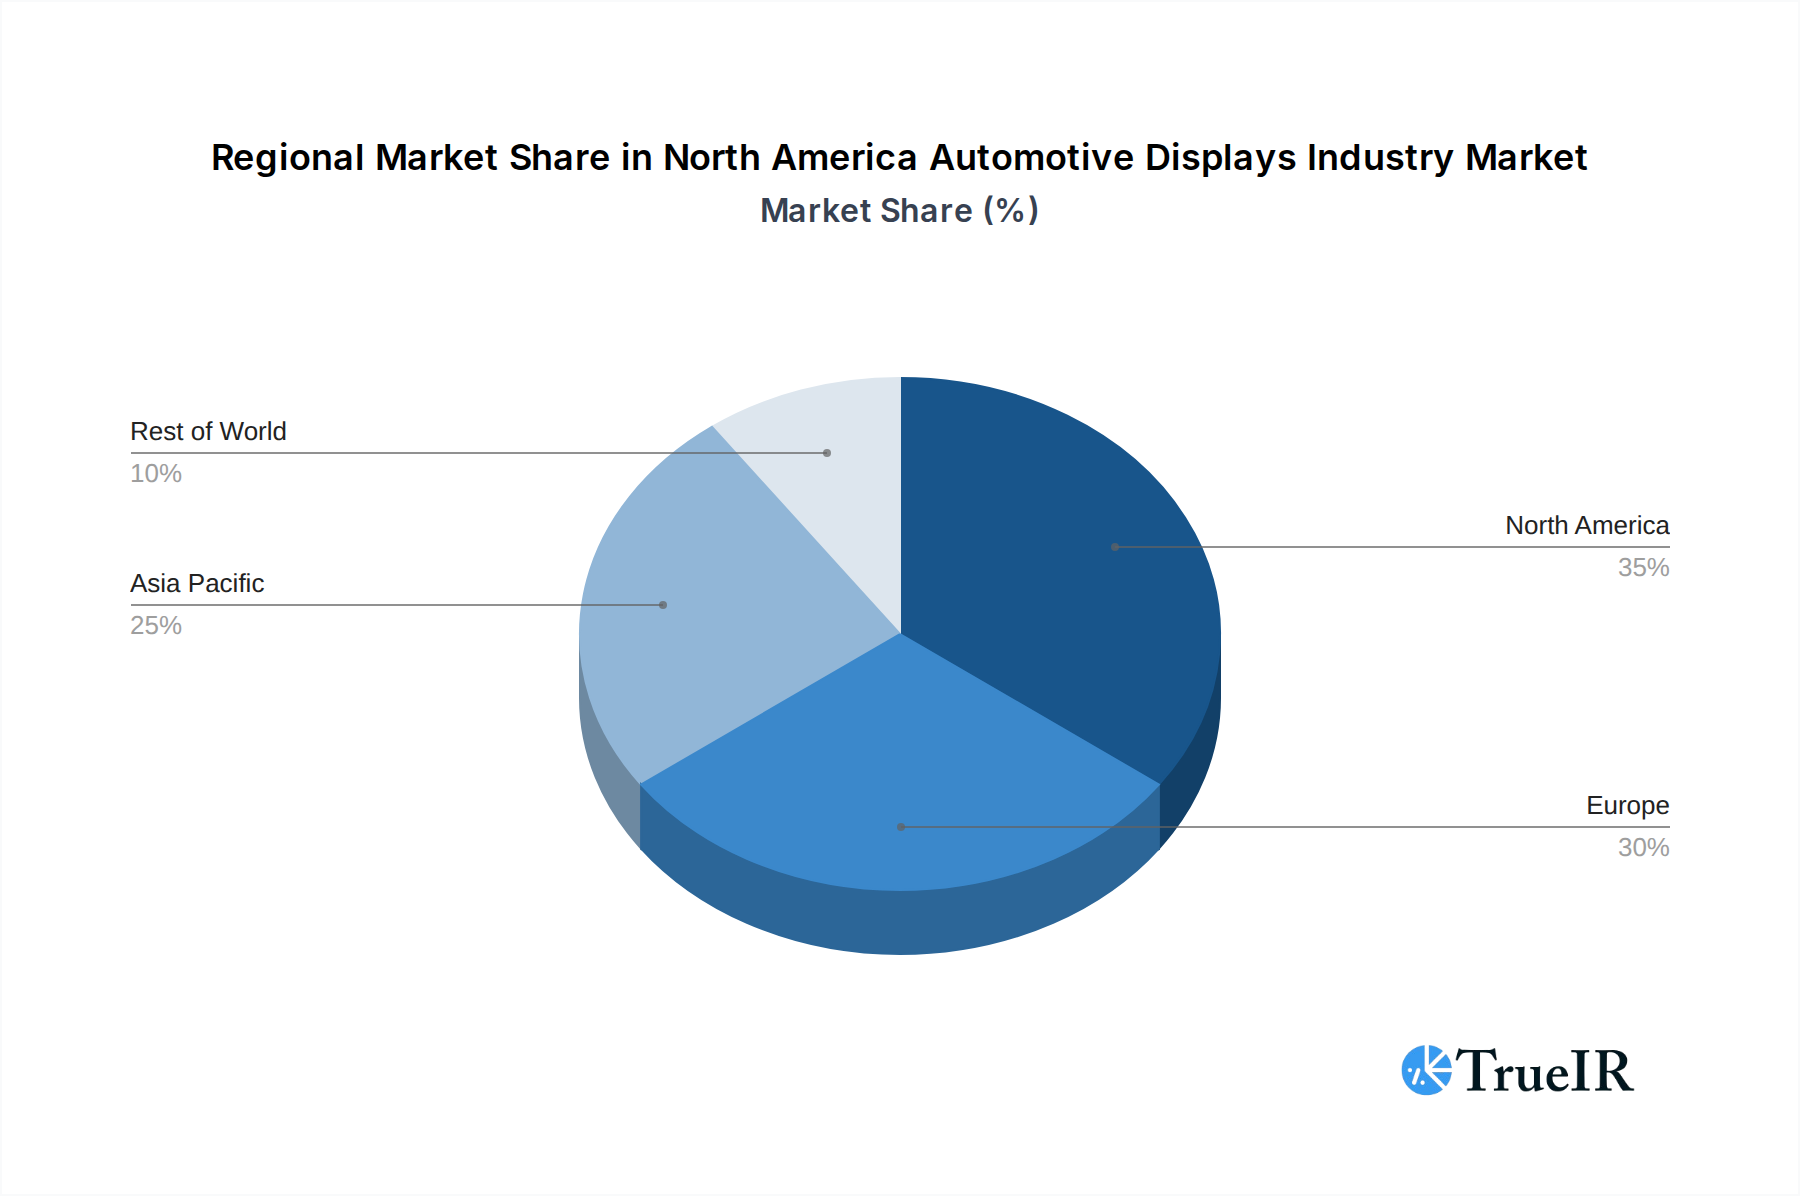
North America Automotive Displays Industry Regional Market Share
Geographic Coverage of North America Automotive Displays Industry
North America Automotive Displays Industry REPORT HIGHLIGHTS
| Aspects | Details |
|---|---|
| Study Period | 2020-2034 |
| Base Year | 2025 |
| Estimated Year | 2026 |
| Forecast Period | 2026-2034 |
| Historical Period | 2020-2025 |
| Growth Rate | CAGR of 8.2% from 2020-2034 |
| Segmentation |
|
Table of Contents
- 1. Introduction
- 1.1. Research Scope
- 1.2. Market Segmentation
- 1.3. Research Objective
- 1.4. Definitions and Assumptions
- 2. Executive Summary
- 2.1. Market Snapshot
- 3. Market Dynamics
- 3.1. Market Drivers
- 3.2. Market Restrains
- 3.3. Market Trends
- 3.4. Market Opportunities
- 4. Market Factor Analysis
- 4.1. Porters Five Forces
- 4.1.1. Bargaining Power of Suppliers
- 4.1.2. Bargaining Power of Buyers
- 4.1.3. Threat of New Entrants
- 4.1.4. Threat of Substitutes
- 4.1.5. Competitive Rivalry
- 4.2. PESTEL analysis
- 4.3. BCG Analysis
- 4.3.1. Stars (High Growth, High Market Share)
- 4.3.2. Cash Cows (Low Growth, High Market Share)
- 4.3.3. Question Mark (High Growth, Low Market Share)
- 4.3.4. Dogs (Low Growth, Low Market Share)
- 4.4. Ansoff Matrix Analysis
- 4.5. Supply Chain Analysis
- 4.6. Regulatory Landscape
- 4.7. Current Market Potential and Opportunity Assessment (TAM–SAM–SOM Framework)
- 4.8. TIR Analyst Note
- 4.1. Porters Five Forces
- 5. Market Analysis, Insights and Forecast 2021-2033
- 5.1. Market Analysis, Insights and Forecast - by Vehicle Type
- 5.1.1. Passenger Cars
- 5.1.2. Commercial Vehicles
- 5.2. Market Analysis, Insights and Forecast - by Technology Type
- 5.2.1. LCD
- 5.2.2. TFT-LCD
- 5.2.3. OLED
- 5.3. Market Analysis, Insights and Forecast - by Product Type
- 5.3.1. Center Stack Display
- 5.3.2. Instrument Cluster Display
- 5.3.3. Heads-up Display
- 5.3.4. Rear Seat Entertainment System
- 5.4. Market Analysis, Insights and Forecast - by Sales Type
- 5.4.1. OEM
- 5.4.2. Aftermarket
- 5.5. Market Analysis, Insights and Forecast - by Region
- 5.5.1. North America
- 5.1. Market Analysis, Insights and Forecast - by Vehicle Type
- 6. North America Automotive Displays Industry Analysis, Insights and Forecast, 2021-2033
- 6.1. Market Analysis, Insights and Forecast - by Vehicle Type
- 6.1.1. Passenger Cars
- 6.1.2. Commercial Vehicles
- 6.2. Market Analysis, Insights and Forecast - by Technology Type
- 6.2.1. LCD
- 6.2.2. TFT-LCD
- 6.2.3. OLED
- 6.3. Market Analysis, Insights and Forecast - by Product Type
- 6.3.1. Center Stack Display
- 6.3.2. Instrument Cluster Display
- 6.3.3. Heads-up Display
- 6.3.4. Rear Seat Entertainment System
- 6.4. Market Analysis, Insights and Forecast - by Sales Type
- 6.4.1. OEM
- 6.4.2. Aftermarket
- 6.1. Market Analysis, Insights and Forecast - by Vehicle Type
- 7. Competitive Analysis
- 7.1. Company Profiles
- 7.1.1 Magneti Marelli SpA
- 7.1.1.1. Company Overview
- 7.1.1.2. Products
- 7.1.1.3. Company Financials
- 7.1.1.4. SWOT Analysis
- 7.1.2 Hitachi Automotive Systems*List Not Exhaustive
- 7.1.2.1. Company Overview
- 7.1.2.2. Products
- 7.1.2.3. Company Financials
- 7.1.2.4. SWOT Analysis
- 7.1.3 Hyundai Mobis
- 7.1.3.1. Company Overview
- 7.1.3.2. Products
- 7.1.3.3. Company Financials
- 7.1.3.4. SWOT Analysis
- 7.1.4 Visteon Corporation
- 7.1.4.1. Company Overview
- 7.1.4.2. Products
- 7.1.4.3. Company Financials
- 7.1.4.4. SWOT Analysis
- 7.1.5 Continental AG
- 7.1.5.1. Company Overview
- 7.1.5.2. Products
- 7.1.5.3. Company Financials
- 7.1.5.4. SWOT Analysis
- 7.1.6 Robert Bosch GmbH
- 7.1.6.1. Company Overview
- 7.1.6.2. Products
- 7.1.6.3. Company Financials
- 7.1.6.4. SWOT Analysis
- 7.1.7 Delphi Technologies
- 7.1.7.1. Company Overview
- 7.1.7.2. Products
- 7.1.7.3. Company Financials
- 7.1.7.4. SWOT Analysis
- 7.1.8 DENSO Corporation
- 7.1.8.1. Company Overview
- 7.1.8.2. Products
- 7.1.8.3. Company Financials
- 7.1.8.4. SWOT Analysis
- 7.1.9 LG Electronics
- 7.1.9.1. Company Overview
- 7.1.9.2. Products
- 7.1.9.3. Company Financials
- 7.1.9.4. SWOT Analysis
- 7.1.10 MTA S p A
- 7.1.10.1. Company Overview
- 7.1.10.2. Products
- 7.1.10.3. Company Financials
- 7.1.10.4. SWOT Analysis
- 7.1.1 Magneti Marelli SpA
- 7.2. Market Entropy
- 7.2.1 Company's Key Areas Served
- 7.2.2 Recent Developments
- 7.3. Company Market Share Analysis 2025
- 7.3.1 Top 5 Companies Market Share Analysis
- 7.3.2 Top 3 Companies Market Share Analysis
- 7.4. List of Potential Customers
- 8. Research Methodology
List of Figures
- Figure 1: North America Automotive Displays Industry Revenue Breakdown (billion, %) by Product 2025 & 2033
- Figure 2: North America Automotive Displays Industry Share (%) by Company 2025
List of Tables
- Table 1: North America Automotive Displays Industry Revenue billion Forecast, by Vehicle Type 2020 & 2033
- Table 2: North America Automotive Displays Industry Revenue billion Forecast, by Technology Type 2020 & 2033
- Table 3: North America Automotive Displays Industry Revenue billion Forecast, by Product Type 2020 & 2033
- Table 4: North America Automotive Displays Industry Revenue billion Forecast, by Sales Type 2020 & 2033
- Table 5: North America Automotive Displays Industry Revenue billion Forecast, by Region 2020 & 2033
- Table 6: North America Automotive Displays Industry Revenue billion Forecast, by Vehicle Type 2020 & 2033
- Table 7: North America Automotive Displays Industry Revenue billion Forecast, by Technology Type 2020 & 2033
- Table 8: North America Automotive Displays Industry Revenue billion Forecast, by Product Type 2020 & 2033
- Table 9: North America Automotive Displays Industry Revenue billion Forecast, by Sales Type 2020 & 2033
- Table 10: North America Automotive Displays Industry Revenue billion Forecast, by Country 2020 & 2033
- Table 11: United States North America Automotive Displays Industry Revenue (billion) Forecast, by Application 2020 & 2033
- Table 12: Canada North America Automotive Displays Industry Revenue (billion) Forecast, by Application 2020 & 2033
- Table 13: Mexico North America Automotive Displays Industry Revenue (billion) Forecast, by Application 2020 & 2033
Frequently Asked Questions
1. What is the projected Compound Annual Growth Rate (CAGR) of the North America Automotive Displays Industry?
The projected CAGR is approximately 8.2%.
2. Which companies are prominent players in the North America Automotive Displays Industry?
Key companies in the market include Magneti Marelli SpA, Hitachi Automotive Systems*List Not Exhaustive, Hyundai Mobis, Visteon Corporation, Continental AG, Robert Bosch GmbH, Delphi Technologies, DENSO Corporation, LG Electronics, MTA S p A.
3. What are the main segments of the North America Automotive Displays Industry?
The market segments include Vehicle Type, Technology Type, Product Type, Sales Type.
4. Can you provide details about the market size?
The market size is estimated to be USD 17.2 billion as of 2022.
5. What are some drivers contributing to market growth?
Increase in Sales of Passenger Cars.
6. What are the notable trends driving market growth?
Head-Up Display Segment of Market to Play Key role During the Forecast Period.
7. Are there any restraints impacting market growth?
Failure in Garage Equipment may Result in Downtime of the Repair Work.
8. Can you provide examples of recent developments in the market?
In May 2022, Panasonic Automotive Systems Co., Ltd. (Panasonic Automotive Systems) announced that its 11.5-inch windshield head-up display (WS HUD) has been adopted for Nissan Motor Co., Ltd.'s new Ariya crossover electric vehicle (EV). Earlier in 2022, the same head-up display was supplied for Nissan Rogue as well.
9. What pricing options are available for accessing the report?
Pricing options include single-user, multi-user, and enterprise licenses priced at USD 4750, USD 4950, and USD 6800 respectively.
10. Is the market size provided in terms of value or volume?
The market size is provided in terms of value, measured in billion.
11. Are there any specific market keywords associated with the report?
Yes, the market keyword associated with the report is "North America Automotive Displays Industry," which aids in identifying and referencing the specific market segment covered.
12. How do I determine which pricing option suits my needs best?
The pricing options vary based on user requirements and access needs. Individual users may opt for single-user licenses, while businesses requiring broader access may choose multi-user or enterprise licenses for cost-effective access to the report.
13. Are there any additional resources or data provided in the North America Automotive Displays Industry report?
While the report offers comprehensive insights, it's advisable to review the specific contents or supplementary materials provided to ascertain if additional resources or data are available.
14. How can I stay updated on further developments or reports in the North America Automotive Displays Industry?
To stay informed about further developments, trends, and reports in the North America Automotive Displays Industry, consider subscribing to industry newsletters, following relevant companies and organizations, or regularly checking reputable industry news sources and publications.
Methodology
Step 1 - Identification of Relevant Samples Size from Population Database


Step 2 - Approaches for Defining Global Market Size (Value, Volume* & Price*)

Note*: In applicable scenarios
Step 3 - Data Sources
Primary Research
- Web Analytics
- Survey Reports
- Research Institute
- Latest Research Reports
- Opinion Leaders
Secondary Research
- Annual Reports
- White Paper
- Latest Press Release
- Industry Association
- Paid Database
- Investor Presentations

Step 4 - Data Triangulation
Involves using different sources of information in order to increase the validity of a study
These sources are likely to be stakeholders in a program - participants, other researchers, program staff, other community members, and so on.
Then we put all data in single framework & apply various statistical tools to find out the dynamic on the market.
During the analysis stage, feedback from the stakeholder groups would be compared to determine areas of agreement as well as areas of divergence