

Key Insights
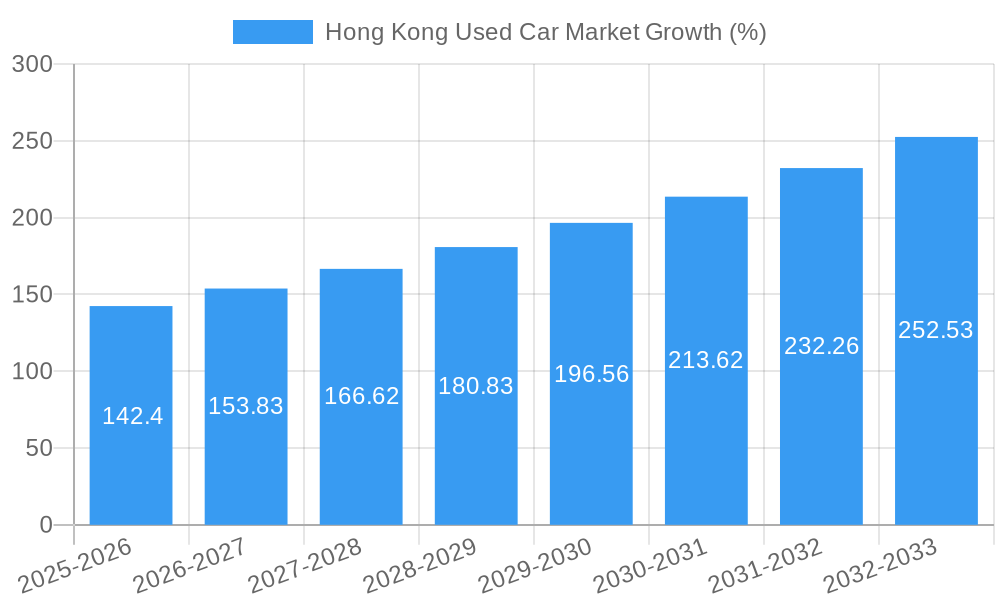
The Hong Kong used car market, valued at $1.72 billion in 2025, is projected to experience robust growth, with a Compound Annual Growth Rate (CAGR) exceeding 8% from 2025 to 2033. This expansion is driven by several factors. Increasing vehicle ownership in Hong Kong, coupled with a preference for more affordable used vehicles compared to new cars, fuels market demand. Government initiatives promoting sustainable transportation, while not directly impacting used car sales, indirectly contribute by influencing the types of used vehicles in demand. Specifically, the rise of electric vehicles (EVs) is creating a segment for used EVs, although the market share for this segment remains relatively small currently. The market is segmented by vendor type (organized vs. unorganized dealerships), fuel type (gasoline, diesel, electric, alternative fuels), and vehicle type (hatchbacks, sedans, SUVs, MUVs), with SUVs and MUVs likely holding a significant share due to Hong Kong's diverse terrain and family-oriented demographics. Competition is present among both large international players like Ford Motor Ltd and local dealers such as Buycar hk and Kam Lung Motor Group, creating a dynamic market landscape. While economic fluctuations and potential import restrictions could pose challenges, the overall growth trajectory remains positive due to sustained consumer demand and the growing acceptance of used vehicles as a cost-effective alternative.
The unorganized sector, consisting of individual sellers, contributes a significant portion of the used car market. However, growth in the organized sector is likely to outpace that of the unorganized sector due to increasing consumer preference for certified pre-owned vehicles, providing warranty and better service. The gasoline segment is likely to retain a dominant market share in the near term, although the rising popularity and availability of electric and alternative fuel vehicles will gradually increase their market share over the forecast period. Importantly, the evolving regulatory landscape concerning emissions and vehicle standards will influence the types of vehicles traded and influence the long-term growth potential of different segments within the market. The continued expansion of the market will depend on various factors, including economic stability, governmental regulations and the changing consumer preferences related to sustainability and affordability.
Hong Kong Used Car Market: A Comprehensive Market Report (2019-2033)
This dynamic report provides a detailed analysis of the Hong Kong used car market, offering invaluable insights for industry professionals, investors, and strategists. With a study period spanning 2019-2033, a base year of 2025, and a forecast period of 2025-2033, this report leverages rigorous data analysis and expert insights to illuminate the market's current state and future trajectory. The market is valued at xx Million in 2025 and is projected to reach xx Million by 2033, exhibiting a CAGR of xx%.

Hong Kong Used Car Market Market Structure & Competitive Landscape
The Hong Kong used car market exhibits a moderately concentrated structure, with a few large players like Dah Chong Hong Holdings Limite and Kam Lung Motor Group dominating alongside numerous smaller, independent operators. The Herfindahl-Hirschman Index (HHI) for the organized sector is estimated at xx, indicating moderate concentration. Innovation is driven by the adoption of online platforms like Buycar hk and the integration of technological advancements in vehicle inspection and valuation. Regulatory impacts, primarily concerning emissions standards and vehicle safety, significantly influence market dynamics. Product substitutes, such as public transportation and ride-hailing services, exert competitive pressure. The market is segmented by end-users (individuals, businesses, rental companies), reflecting varying purchase patterns and preferences. Mergers and acquisitions (M&A) activity remains relatively low, with an estimated xx M&A deals in the past five years, primarily involving smaller players consolidating their market presence.
- Market Concentration: Moderately concentrated, HHI (Organized Sector): xx
- Innovation Drivers: Online platforms, technological advancements in vehicle inspection.
- Regulatory Impacts: Emissions standards, vehicle safety regulations.
- Product Substitutes: Public transportation, ride-hailing services.
- End-User Segmentation: Individuals, businesses, rental companies.
- M&A Trends: Low activity, xx deals in the last 5 years.
Hong Kong Used Car Market Market Trends & Opportunities
The Hong Kong used car market is witnessing robust growth, fueled by increasing vehicle ownership, rising disposable incomes, and a preference for more affordable transportation options compared to new cars. Technological shifts, such as the rise of online marketplaces and digital vehicle inspection tools, are transforming the market landscape. Consumer preferences are evolving towards fuel-efficient and environmentally friendly vehicles, creating opportunities for the electric and alternative fuel vehicle segments. Competitive dynamics are characterized by increasing competition from both established players and new entrants leveraging innovative business models. Market penetration rates for online used car platforms are increasing rapidly, projected to reach xx% by 2033.
Dominant Markets & Segments in Hong Kong Used Car Market
The dominant segment within the Hong Kong used car market is the organized sector, characterized by established dealerships and large automotive groups like DCH Motors Limited and Ventures Motor Ltd (Ford Motor Ltd). Gasoline-powered vehicles remain the dominant fuel type, although the electric vehicle segment is experiencing significant growth. Within vehicle types, SUVs and sedans constitute the largest market share. Hong Kong Island and Kowloon are the most dominant geographical regions.
- Key Growth Drivers:
- Organized Sector: Established infrastructure, brand recognition, trust.
- Gasoline Vehicles: Wide availability, established infrastructure.
- SUVs & Sedans: Popularity amongst consumers, wide range of options.
- Hong Kong Island & Kowloon: High population density, strong demand.
Hong Kong Used Car Market Product Analysis
Product innovations in the Hong Kong used car market primarily focus on enhancing transparency and consumer trust. This includes the adoption of sophisticated vehicle history reports, improved online marketplaces offering detailed vehicle information, and the introduction of certified pre-owned vehicles. The competitive advantage lies in providing a seamless and trustworthy purchasing experience, leveraging technology and building customer confidence. This includes leveraging AI-powered valuation tools and offering comprehensive warranties.
Key Drivers, Barriers & Challenges in Hong Kong Used Car Market
Key Drivers: Rising disposable incomes, increasing vehicle ownership, government initiatives promoting fuel efficiency, and the growth of online marketplaces are driving market expansion.
Challenges: Stringent emissions regulations, limited parking space in urban areas, and intense competition among numerous players pose challenges. The high cost of vehicle maintenance and insurance also hinder market growth.
Growth Drivers in the Hong Kong Used Car Market Market
Technological advancements, like online platforms and digital vehicle inspection, and economic factors like rising disposable income are major growth drivers. Favorable government policies supporting fuel efficiency also contribute.
Challenges Impacting Hong Kong Used Car Market Growth
Regulatory hurdles concerning emissions and safety standards, coupled with supply chain disruptions and intense competition, impact market expansion. High import duties on used vehicles also pose a barrier.
Key Players Shaping the Hong Kong Used Car Market Market
- Ventures Motor Ltd (Ford Motor Ltd)
- Buycar hk
- DCH Motors Limited
- Guazi Inc
- Zung Fu Limited
- VINS MOTORS COMPANY LTD
- Kam Lung Motor Group
- Hong Kong Motor City
- Lit Motors HK
- Dah Chong Hong Holdings Limite
Significant Hong Kong Used Car Market Industry Milestones
- June 2023: Jardine Cycle & Carriage's USD 60 million investment with Carro to boost online used car sales.
- September 2022: Cango launches Haoche app, expanding its used car trading platform.
Future Outlook for Hong Kong Used Car Market Market
The Hong Kong used car market is poised for continued growth, driven by technological innovation, evolving consumer preferences, and government initiatives. Strategic opportunities exist in expanding online platforms, focusing on electric vehicles, and enhancing customer service. The market's potential is significant, with the expansion of pre-owned car subscriptions and digital financing likely driving significant growth.
Hong Kong Used Car Market Segmentation
-
1. Vehicle Type
- 1.1. Hatchback
- 1.2. Sedan
- 1.3. Sport Utility Vehicles (SUVs)
- 1.4. Multi-Purpose Vehicles (MUVs)
-
2. Vendor Type
- 2.1. Organized
- 2.2. Unorganized
-
3. Fuel Type
- 3.1. Gasoline
- 3.2. Diesel
- 3.3. Electric
- 3.4. Alternative Fuel Vehicles
Hong Kong Used Car Market Segmentation By Geography
-
1. North America
- 1.1. United States
- 1.2. Canada
- 1.3. Mexico
-
2. South America
- 2.1. Brazil
- 2.2. Argentina
- 2.3. Rest of South America
-
3. Europe
- 3.1. United Kingdom
- 3.2. Germany
- 3.3. France
- 3.4. Italy
- 3.5. Spain
- 3.6. Russia
- 3.7. Benelux
- 3.8. Nordics
- 3.9. Rest of Europe
-
4. Middle East & Africa
- 4.1. Turkey
- 4.2. Israel
- 4.3. GCC
- 4.4. North Africa
- 4.5. South Africa
- 4.6. Rest of Middle East & Africa
-
5. Asia Pacific
- 5.1. China
- 5.2. India
- 5.3. Japan
- 5.4. South Korea
- 5.5. ASEAN
- 5.6. Oceania
- 5.7. Rest of Asia Pacific

Hong Kong Used Car Market REPORT HIGHLIGHTS
| Aspects | Details |
|---|---|
| Study Period | 2019-2033 |
| Base Year | 2024 |
| Estimated Year | 2025 |
| Forecast Period | 2025-2033 |
| Historical Period | 2019-2024 |
| Growth Rate | CAGR of > 8.00% from 2019-2033 |
| Segmentation |
|
Table of Contents
- 1. Introduction
- 1.1. Research Scope
- 1.2. Market Segmentation
- 1.3. Research Methodology
- 1.4. Definitions and Assumptions
- 2. Executive Summary
- 2.1. Introduction
- 3. Market Dynamics
- 3.1. Introduction
- 3.2. Market Drivers
- 3.2.1. Rise in Price of New Vehicles
- 3.3. Market Restrains
- 3.3.1. Trust And Transparency In Used Car Remained A Key Challenge For Consumers
- 3.4. Market Trends
- 3.4.1. Growing Used Car Financing Aiding Market Growth
- 4. Market Factor Analysis
- 4.1. Porters Five Forces
- 4.2. Supply/Value Chain
- 4.3. PESTEL analysis
- 4.4. Market Entropy
- 4.5. Patent/Trademark Analysis
- 5. Global Hong Kong Used Car Market Analysis, Insights and Forecast, 2019-2031
- 5.1. Market Analysis, Insights and Forecast - by Vehicle Type
- 5.1.1. Hatchback
- 5.1.2. Sedan
- 5.1.3. Sport Utility Vehicles (SUVs)
- 5.1.4. Multi-Purpose Vehicles (MUVs)
- 5.2. Market Analysis, Insights and Forecast - by Vendor Type
- 5.2.1. Organized
- 5.2.2. Unorganized
- 5.3. Market Analysis, Insights and Forecast - by Fuel Type
- 5.3.1. Gasoline
- 5.3.2. Diesel
- 5.3.3. Electric
- 5.3.4. Alternative Fuel Vehicles
- 5.4. Market Analysis, Insights and Forecast - by Region
- 5.4.1. North America
- 5.4.2. South America
- 5.4.3. Europe
- 5.4.4. Middle East & Africa
- 5.4.5. Asia Pacific
- 5.1. Market Analysis, Insights and Forecast - by Vehicle Type
- 6. North America Hong Kong Used Car Market Analysis, Insights and Forecast, 2019-2031
- 6.1. Market Analysis, Insights and Forecast - by Vehicle Type
- 6.1.1. Hatchback
- 6.1.2. Sedan
- 6.1.3. Sport Utility Vehicles (SUVs)
- 6.1.4. Multi-Purpose Vehicles (MUVs)
- 6.2. Market Analysis, Insights and Forecast - by Vendor Type
- 6.2.1. Organized
- 6.2.2. Unorganized
- 6.3. Market Analysis, Insights and Forecast - by Fuel Type
- 6.3.1. Gasoline
- 6.3.2. Diesel
- 6.3.3. Electric
- 6.3.4. Alternative Fuel Vehicles
- 6.1. Market Analysis, Insights and Forecast - by Vehicle Type
- 7. South America Hong Kong Used Car Market Analysis, Insights and Forecast, 2019-2031
- 7.1. Market Analysis, Insights and Forecast - by Vehicle Type
- 7.1.1. Hatchback
- 7.1.2. Sedan
- 7.1.3. Sport Utility Vehicles (SUVs)
- 7.1.4. Multi-Purpose Vehicles (MUVs)
- 7.2. Market Analysis, Insights and Forecast - by Vendor Type
- 7.2.1. Organized
- 7.2.2. Unorganized
- 7.3. Market Analysis, Insights and Forecast - by Fuel Type
- 7.3.1. Gasoline
- 7.3.2. Diesel
- 7.3.3. Electric
- 7.3.4. Alternative Fuel Vehicles
- 7.1. Market Analysis, Insights and Forecast - by Vehicle Type
- 8. Europe Hong Kong Used Car Market Analysis, Insights and Forecast, 2019-2031
- 8.1. Market Analysis, Insights and Forecast - by Vehicle Type
- 8.1.1. Hatchback
- 8.1.2. Sedan
- 8.1.3. Sport Utility Vehicles (SUVs)
- 8.1.4. Multi-Purpose Vehicles (MUVs)
- 8.2. Market Analysis, Insights and Forecast - by Vendor Type
- 8.2.1. Organized
- 8.2.2. Unorganized
- 8.3. Market Analysis, Insights and Forecast - by Fuel Type
- 8.3.1. Gasoline
- 8.3.2. Diesel
- 8.3.3. Electric
- 8.3.4. Alternative Fuel Vehicles
- 8.1. Market Analysis, Insights and Forecast - by Vehicle Type
- 9. Middle East & Africa Hong Kong Used Car Market Analysis, Insights and Forecast, 2019-2031
- 9.1. Market Analysis, Insights and Forecast - by Vehicle Type
- 9.1.1. Hatchback
- 9.1.2. Sedan
- 9.1.3. Sport Utility Vehicles (SUVs)
- 9.1.4. Multi-Purpose Vehicles (MUVs)
- 9.2. Market Analysis, Insights and Forecast - by Vendor Type
- 9.2.1. Organized
- 9.2.2. Unorganized
- 9.3. Market Analysis, Insights and Forecast - by Fuel Type
- 9.3.1. Gasoline
- 9.3.2. Diesel
- 9.3.3. Electric
- 9.3.4. Alternative Fuel Vehicles
- 9.1. Market Analysis, Insights and Forecast - by Vehicle Type
- 10. Asia Pacific Hong Kong Used Car Market Analysis, Insights and Forecast, 2019-2031
- 10.1. Market Analysis, Insights and Forecast - by Vehicle Type
- 10.1.1. Hatchback
- 10.1.2. Sedan
- 10.1.3. Sport Utility Vehicles (SUVs)
- 10.1.4. Multi-Purpose Vehicles (MUVs)
- 10.2. Market Analysis, Insights and Forecast - by Vendor Type
- 10.2.1. Organized
- 10.2.2. Unorganized
- 10.3. Market Analysis, Insights and Forecast - by Fuel Type
- 10.3.1. Gasoline
- 10.3.2. Diesel
- 10.3.3. Electric
- 10.3.4. Alternative Fuel Vehicles
- 10.1. Market Analysis, Insights and Forecast - by Vehicle Type
- 11. Competitive Analysis
- 11.1. Global Market Share Analysis 2024
- 11.2. Company Profiles
- 11.2.1 Ventures Motor Ltd (Ford Motor Ltd)
- 11.2.1.1. Overview
- 11.2.1.2. Products
- 11.2.1.3. SWOT Analysis
- 11.2.1.4. Recent Developments
- 11.2.1.5. Financials (Based on Availability)
- 11.2.2 Buycar hk
- 11.2.2.1. Overview
- 11.2.2.2. Products
- 11.2.2.3. SWOT Analysis
- 11.2.2.4. Recent Developments
- 11.2.2.5. Financials (Based on Availability)
- 11.2.3 DCH Motors Limited
- 11.2.3.1. Overview
- 11.2.3.2. Products
- 11.2.3.3. SWOT Analysis
- 11.2.3.4. Recent Developments
- 11.2.3.5. Financials (Based on Availability)
- 11.2.4 Guazi Inc
- 11.2.4.1. Overview
- 11.2.4.2. Products
- 11.2.4.3. SWOT Analysis
- 11.2.4.4. Recent Developments
- 11.2.4.5. Financials (Based on Availability)
- 11.2.5 Zung Fu Limited
- 11.2.5.1. Overview
- 11.2.5.2. Products
- 11.2.5.3. SWOT Analysis
- 11.2.5.4. Recent Developments
- 11.2.5.5. Financials (Based on Availability)
- 11.2.6 VINS MOTORS COMPANY LTD
- 11.2.6.1. Overview
- 11.2.6.2. Products
- 11.2.6.3. SWOT Analysis
- 11.2.6.4. Recent Developments
- 11.2.6.5. Financials (Based on Availability)
- 11.2.7 Kam Lung Motor Group
- 11.2.7.1. Overview
- 11.2.7.2. Products
- 11.2.7.3. SWOT Analysis
- 11.2.7.4. Recent Developments
- 11.2.7.5. Financials (Based on Availability)
- 11.2.8 Hong Kong Motor City
- 11.2.8.1. Overview
- 11.2.8.2. Products
- 11.2.8.3. SWOT Analysis
- 11.2.8.4. Recent Developments
- 11.2.8.5. Financials (Based on Availability)
- 11.2.9 Lit Motors HK
- 11.2.9.1. Overview
- 11.2.9.2. Products
- 11.2.9.3. SWOT Analysis
- 11.2.9.4. Recent Developments
- 11.2.9.5. Financials (Based on Availability)
- 11.2.10 Dah Chong Hong Holdings Limite
- 11.2.10.1. Overview
- 11.2.10.2. Products
- 11.2.10.3. SWOT Analysis
- 11.2.10.4. Recent Developments
- 11.2.10.5. Financials (Based on Availability)
- 11.2.1 Ventures Motor Ltd (Ford Motor Ltd)
List of Figures
- Figure 1: Global Hong Kong Used Car Market Revenue Breakdown (Million, %) by Region 2024 & 2032
- Figure 2: Hong Kong Hong Kong Used Car Market Revenue (Million), by Country 2024 & 2032
- Figure 3: Hong Kong Hong Kong Used Car Market Revenue Share (%), by Country 2024 & 2032
- Figure 4: North America Hong Kong Used Car Market Revenue (Million), by Vehicle Type 2024 & 2032
- Figure 5: North America Hong Kong Used Car Market Revenue Share (%), by Vehicle Type 2024 & 2032
- Figure 6: North America Hong Kong Used Car Market Revenue (Million), by Vendor Type 2024 & 2032
- Figure 7: North America Hong Kong Used Car Market Revenue Share (%), by Vendor Type 2024 & 2032
- Figure 8: North America Hong Kong Used Car Market Revenue (Million), by Fuel Type 2024 & 2032
- Figure 9: North America Hong Kong Used Car Market Revenue Share (%), by Fuel Type 2024 & 2032
- Figure 10: North America Hong Kong Used Car Market Revenue (Million), by Country 2024 & 2032
- Figure 11: North America Hong Kong Used Car Market Revenue Share (%), by Country 2024 & 2032
- Figure 12: South America Hong Kong Used Car Market Revenue (Million), by Vehicle Type 2024 & 2032
- Figure 13: South America Hong Kong Used Car Market Revenue Share (%), by Vehicle Type 2024 & 2032
- Figure 14: South America Hong Kong Used Car Market Revenue (Million), by Vendor Type 2024 & 2032
- Figure 15: South America Hong Kong Used Car Market Revenue Share (%), by Vendor Type 2024 & 2032
- Figure 16: South America Hong Kong Used Car Market Revenue (Million), by Fuel Type 2024 & 2032
- Figure 17: South America Hong Kong Used Car Market Revenue Share (%), by Fuel Type 2024 & 2032
- Figure 18: South America Hong Kong Used Car Market Revenue (Million), by Country 2024 & 2032
- Figure 19: South America Hong Kong Used Car Market Revenue Share (%), by Country 2024 & 2032
- Figure 20: Europe Hong Kong Used Car Market Revenue (Million), by Vehicle Type 2024 & 2032
- Figure 21: Europe Hong Kong Used Car Market Revenue Share (%), by Vehicle Type 2024 & 2032
- Figure 22: Europe Hong Kong Used Car Market Revenue (Million), by Vendor Type 2024 & 2032
- Figure 23: Europe Hong Kong Used Car Market Revenue Share (%), by Vendor Type 2024 & 2032
- Figure 24: Europe Hong Kong Used Car Market Revenue (Million), by Fuel Type 2024 & 2032
- Figure 25: Europe Hong Kong Used Car Market Revenue Share (%), by Fuel Type 2024 & 2032
- Figure 26: Europe Hong Kong Used Car Market Revenue (Million), by Country 2024 & 2032
- Figure 27: Europe Hong Kong Used Car Market Revenue Share (%), by Country 2024 & 2032
- Figure 28: Middle East & Africa Hong Kong Used Car Market Revenue (Million), by Vehicle Type 2024 & 2032
- Figure 29: Middle East & Africa Hong Kong Used Car Market Revenue Share (%), by Vehicle Type 2024 & 2032
- Figure 30: Middle East & Africa Hong Kong Used Car Market Revenue (Million), by Vendor Type 2024 & 2032
- Figure 31: Middle East & Africa Hong Kong Used Car Market Revenue Share (%), by Vendor Type 2024 & 2032
- Figure 32: Middle East & Africa Hong Kong Used Car Market Revenue (Million), by Fuel Type 2024 & 2032
- Figure 33: Middle East & Africa Hong Kong Used Car Market Revenue Share (%), by Fuel Type 2024 & 2032
- Figure 34: Middle East & Africa Hong Kong Used Car Market Revenue (Million), by Country 2024 & 2032
- Figure 35: Middle East & Africa Hong Kong Used Car Market Revenue Share (%), by Country 2024 & 2032
- Figure 36: Asia Pacific Hong Kong Used Car Market Revenue (Million), by Vehicle Type 2024 & 2032
- Figure 37: Asia Pacific Hong Kong Used Car Market Revenue Share (%), by Vehicle Type 2024 & 2032
- Figure 38: Asia Pacific Hong Kong Used Car Market Revenue (Million), by Vendor Type 2024 & 2032
- Figure 39: Asia Pacific Hong Kong Used Car Market Revenue Share (%), by Vendor Type 2024 & 2032
- Figure 40: Asia Pacific Hong Kong Used Car Market Revenue (Million), by Fuel Type 2024 & 2032
- Figure 41: Asia Pacific Hong Kong Used Car Market Revenue Share (%), by Fuel Type 2024 & 2032
- Figure 42: Asia Pacific Hong Kong Used Car Market Revenue (Million), by Country 2024 & 2032
- Figure 43: Asia Pacific Hong Kong Used Car Market Revenue Share (%), by Country 2024 & 2032
List of Tables
- Table 1: Global Hong Kong Used Car Market Revenue Million Forecast, by Region 2019 & 2032
- Table 2: Global Hong Kong Used Car Market Revenue Million Forecast, by Vehicle Type 2019 & 2032
- Table 3: Global Hong Kong Used Car Market Revenue Million Forecast, by Vendor Type 2019 & 2032
- Table 4: Global Hong Kong Used Car Market Revenue Million Forecast, by Fuel Type 2019 & 2032
- Table 5: Global Hong Kong Used Car Market Revenue Million Forecast, by Region 2019 & 2032
- Table 6: Global Hong Kong Used Car Market Revenue Million Forecast, by Country 2019 & 2032
- Table 7: Global Hong Kong Used Car Market Revenue Million Forecast, by Vehicle Type 2019 & 2032
- Table 8: Global Hong Kong Used Car Market Revenue Million Forecast, by Vendor Type 2019 & 2032
- Table 9: Global Hong Kong Used Car Market Revenue Million Forecast, by Fuel Type 2019 & 2032
- Table 10: Global Hong Kong Used Car Market Revenue Million Forecast, by Country 2019 & 2032
- Table 11: United States Hong Kong Used Car Market Revenue (Million) Forecast, by Application 2019 & 2032
- Table 12: Canada Hong Kong Used Car Market Revenue (Million) Forecast, by Application 2019 & 2032
- Table 13: Mexico Hong Kong Used Car Market Revenue (Million) Forecast, by Application 2019 & 2032
- Table 14: Global Hong Kong Used Car Market Revenue Million Forecast, by Vehicle Type 2019 & 2032
- Table 15: Global Hong Kong Used Car Market Revenue Million Forecast, by Vendor Type 2019 & 2032
- Table 16: Global Hong Kong Used Car Market Revenue Million Forecast, by Fuel Type 2019 & 2032
- Table 17: Global Hong Kong Used Car Market Revenue Million Forecast, by Country 2019 & 2032
- Table 18: Brazil Hong Kong Used Car Market Revenue (Million) Forecast, by Application 2019 & 2032
- Table 19: Argentina Hong Kong Used Car Market Revenue (Million) Forecast, by Application 2019 & 2032
- Table 20: Rest of South America Hong Kong Used Car Market Revenue (Million) Forecast, by Application 2019 & 2032
- Table 21: Global Hong Kong Used Car Market Revenue Million Forecast, by Vehicle Type 2019 & 2032
- Table 22: Global Hong Kong Used Car Market Revenue Million Forecast, by Vendor Type 2019 & 2032
- Table 23: Global Hong Kong Used Car Market Revenue Million Forecast, by Fuel Type 2019 & 2032
- Table 24: Global Hong Kong Used Car Market Revenue Million Forecast, by Country 2019 & 2032
- Table 25: United Kingdom Hong Kong Used Car Market Revenue (Million) Forecast, by Application 2019 & 2032
- Table 26: Germany Hong Kong Used Car Market Revenue (Million) Forecast, by Application 2019 & 2032
- Table 27: France Hong Kong Used Car Market Revenue (Million) Forecast, by Application 2019 & 2032
- Table 28: Italy Hong Kong Used Car Market Revenue (Million) Forecast, by Application 2019 & 2032
- Table 29: Spain Hong Kong Used Car Market Revenue (Million) Forecast, by Application 2019 & 2032
- Table 30: Russia Hong Kong Used Car Market Revenue (Million) Forecast, by Application 2019 & 2032
- Table 31: Benelux Hong Kong Used Car Market Revenue (Million) Forecast, by Application 2019 & 2032
- Table 32: Nordics Hong Kong Used Car Market Revenue (Million) Forecast, by Application 2019 & 2032
- Table 33: Rest of Europe Hong Kong Used Car Market Revenue (Million) Forecast, by Application 2019 & 2032
- Table 34: Global Hong Kong Used Car Market Revenue Million Forecast, by Vehicle Type 2019 & 2032
- Table 35: Global Hong Kong Used Car Market Revenue Million Forecast, by Vendor Type 2019 & 2032
- Table 36: Global Hong Kong Used Car Market Revenue Million Forecast, by Fuel Type 2019 & 2032
- Table 37: Global Hong Kong Used Car Market Revenue Million Forecast, by Country 2019 & 2032
- Table 38: Turkey Hong Kong Used Car Market Revenue (Million) Forecast, by Application 2019 & 2032
- Table 39: Israel Hong Kong Used Car Market Revenue (Million) Forecast, by Application 2019 & 2032
- Table 40: GCC Hong Kong Used Car Market Revenue (Million) Forecast, by Application 2019 & 2032
- Table 41: North Africa Hong Kong Used Car Market Revenue (Million) Forecast, by Application 2019 & 2032
- Table 42: South Africa Hong Kong Used Car Market Revenue (Million) Forecast, by Application 2019 & 2032
- Table 43: Rest of Middle East & Africa Hong Kong Used Car Market Revenue (Million) Forecast, by Application 2019 & 2032
- Table 44: Global Hong Kong Used Car Market Revenue Million Forecast, by Vehicle Type 2019 & 2032
- Table 45: Global Hong Kong Used Car Market Revenue Million Forecast, by Vendor Type 2019 & 2032
- Table 46: Global Hong Kong Used Car Market Revenue Million Forecast, by Fuel Type 2019 & 2032
- Table 47: Global Hong Kong Used Car Market Revenue Million Forecast, by Country 2019 & 2032
- Table 48: China Hong Kong Used Car Market Revenue (Million) Forecast, by Application 2019 & 2032
- Table 49: India Hong Kong Used Car Market Revenue (Million) Forecast, by Application 2019 & 2032
- Table 50: Japan Hong Kong Used Car Market Revenue (Million) Forecast, by Application 2019 & 2032
- Table 51: South Korea Hong Kong Used Car Market Revenue (Million) Forecast, by Application 2019 & 2032
- Table 52: ASEAN Hong Kong Used Car Market Revenue (Million) Forecast, by Application 2019 & 2032
- Table 53: Oceania Hong Kong Used Car Market Revenue (Million) Forecast, by Application 2019 & 2032
- Table 54: Rest of Asia Pacific Hong Kong Used Car Market Revenue (Million) Forecast, by Application 2019 & 2032
Frequently Asked Questions
1. What is the projected Compound Annual Growth Rate (CAGR) of the Hong Kong Used Car Market?
The projected CAGR is approximately > 8.00%.
2. Which companies are prominent players in the Hong Kong Used Car Market?
Key companies in the market include Ventures Motor Ltd (Ford Motor Ltd), Buycar hk, DCH Motors Limited, Guazi Inc, Zung Fu Limited, VINS MOTORS COMPANY LTD, Kam Lung Motor Group, Hong Kong Motor City, Lit Motors HK, Dah Chong Hong Holdings Limite.
3. What are the main segments of the Hong Kong Used Car Market?
The market segments include Vehicle Type, Vendor Type, Fuel Type.
4. Can you provide details about the market size?
The market size is estimated to be USD 1.72 Million as of 2022.
5. What are some drivers contributing to market growth?
Rise in Price of New Vehicles.
6. What are the notable trends driving market growth?
Growing Used Car Financing Aiding Market Growth.
7. Are there any restraints impacting market growth?
Trust And Transparency In Used Car Remained A Key Challenge For Consumers.
8. Can you provide examples of recent developments in the market?
June 2023: Jardine Cycle & Carriage, the investment arm of Hong Kong-based conglomerate Jardine Matheson, collaborated with Carro, Singapore's online automotive marketplace. The company signed a deal for USD 60 million to enhance used car sales in Hing Kong.
9. What pricing options are available for accessing the report?
Pricing options include single-user, multi-user, and enterprise licenses priced at USD 3800, USD 4500, and USD 5800 respectively.
10. Is the market size provided in terms of value or volume?
The market size is provided in terms of value, measured in Million.
11. Are there any specific market keywords associated with the report?
Yes, the market keyword associated with the report is "Hong Kong Used Car Market," which aids in identifying and referencing the specific market segment covered.
12. How do I determine which pricing option suits my needs best?
The pricing options vary based on user requirements and access needs. Individual users may opt for single-user licenses, while businesses requiring broader access may choose multi-user or enterprise licenses for cost-effective access to the report.
13. Are there any additional resources or data provided in the Hong Kong Used Car Market report?
While the report offers comprehensive insights, it's advisable to review the specific contents or supplementary materials provided to ascertain if additional resources or data are available.
14. How can I stay updated on further developments or reports in the Hong Kong Used Car Market?
To stay informed about further developments, trends, and reports in the Hong Kong Used Car Market, consider subscribing to industry newsletters, following relevant companies and organizations, or regularly checking reputable industry news sources and publications.
Methodology
Step 1 - Identification of Relevant Samples Size from Population Database


Step 2 - Approaches for Defining Global Market Size (Value, Volume* & Price*)

Note*: In applicable scenarios
Step 3 - Data Sources
Primary Research
- Web Analytics
- Survey Reports
- Research Institute
- Latest Research Reports
- Opinion Leaders
Secondary Research
- Annual Reports
- White Paper
- Latest Press Release
- Industry Association
- Paid Database
- Investor Presentations

Step 4 - Data Triangulation
Involves using different sources of information in order to increase the validity of a study
These sources are likely to be stakeholders in a program - participants, other researchers, program staff, other community members, and so on.
Then we put all data in single framework & apply various statistical tools to find out the dynamic on the market.
During the analysis stage, feedback from the stakeholder groups would be compared to determine areas of agreement as well as areas of divergence
