

Key Insights
The Micro-Hybrid Electric Vehicle (MHEV) market is poised for significant expansion, propelled by increasingly stringent global emission regulations and a growing consumer preference for fuel-efficient transportation. This dynamic market is projected to reach $16.13 billion by 2025 and is anticipated to grow at a Compound Annual Growth Rate (CAGR) of 4.8% between 2025 and 2033. Key growth drivers include advancements in MHEV technology, leading to improved efficiency and affordability, with the 48V micro-hybrid segment expected to lead this evolution over 12V systems. The widespread adoption of MHEVs in passenger vehicles, particularly in established automotive markets such as North America and Europe, is further accelerating market penetration. A primary challenge remains the higher initial cost of MHEV systems compared to traditional internal combustion engine vehicles, which can hinder adoption in developing economies. Market segmentation highlights the dominance of passenger cars, the increasing adoption of lithium-ion batteries over lead-acid, and the rapid growth of 48V systems, all reflecting shifts in consumer demand and technological innovation. Major automotive manufacturers are actively investing in R&D and introducing new MHEV models to capitalize on this burgeoning market.
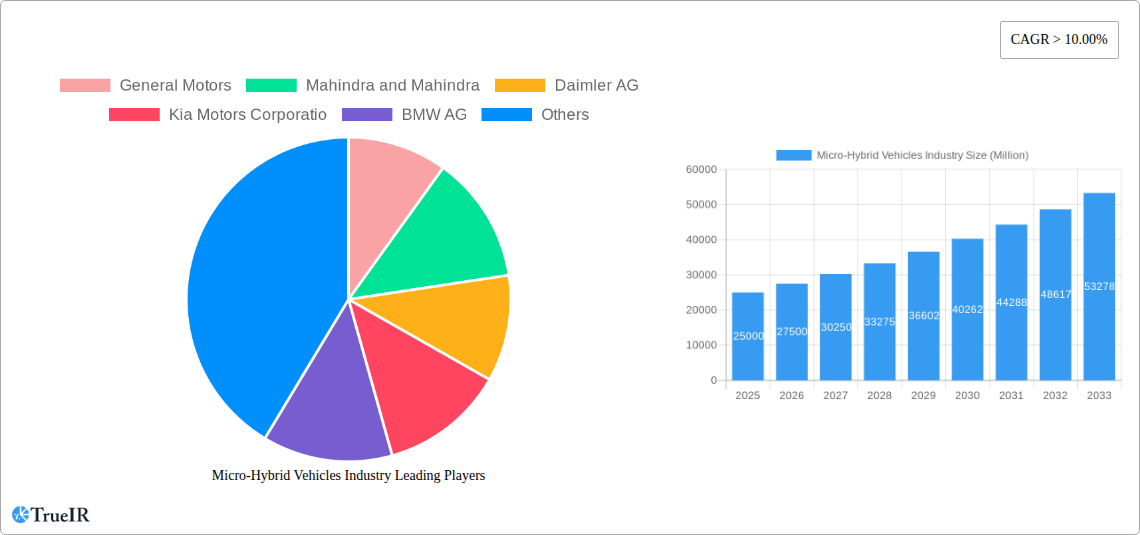
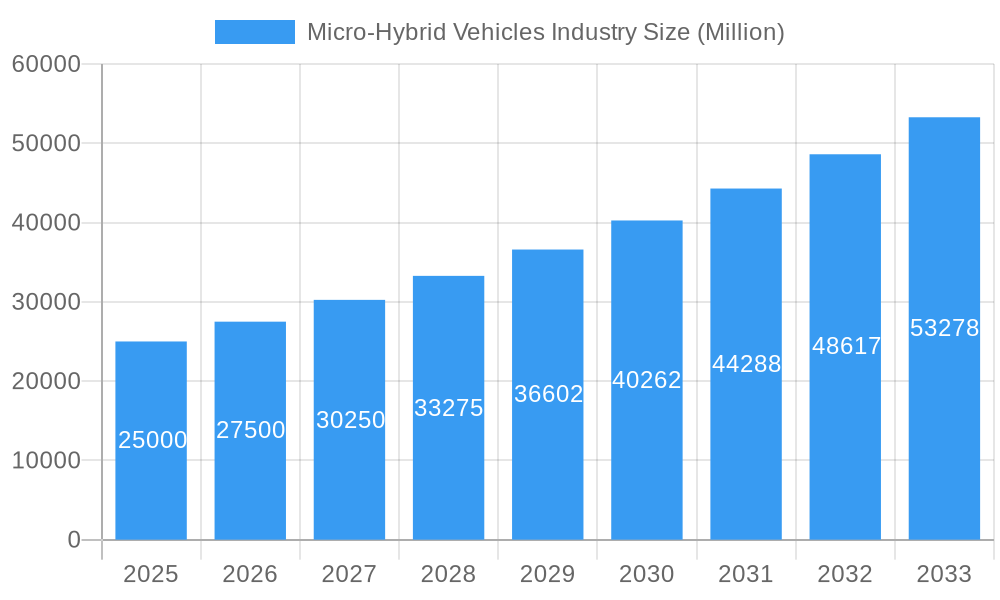
Micro-Hybrid Vehicles Industry Market Size (In Billion)
Geographically, North America and Europe currently represent substantial market shares due to their mature automotive sectors, robust emission standards, and strong consumer purchasing power. The Asia-Pacific region, notably India and China, is projected to experience rapid growth in the MHEV market. This surge is attributed to rising vehicle sales, government initiatives focused on fuel efficiency and emission reduction, and increasing affordability of MHEV technology, supported by local manufacturing capabilities. While other regions will also see growth, the pace is expected to be slower due to varying economic development and regulatory landscapes. The forecast period from 2025 to 2033 indicates sustained MHEV market growth, driven by ongoing technological innovation, supportive governmental policies, and heightened consumer awareness of environmental sustainability.
Micro-Hybrid Vehicles Industry Company Market Share
Micro-Hybrid Vehicles Industry Market Report: 2019-2033
This comprehensive report provides a detailed analysis of the Micro-Hybrid Vehicles industry, offering invaluable insights into market trends, competitive dynamics, and future growth prospects. Covering the period from 2019 to 2033, with a focus on the 2025-2033 forecast period, this report is an essential resource for industry stakeholders, investors, and researchers seeking to understand and capitalize on the opportunities within this rapidly evolving sector. The global market size is expected to reach xx Million by 2033, exhibiting a CAGR of xx% during the forecast period.
Micro-Hybrid Vehicles Industry Market Structure & Competitive Landscape
The micro-hybrid vehicle market exhibits a moderately concentrated structure, with key players like General Motors, Mahindra and Mahindra, Daimler AG, Kia Motors Corporation, BMW AG, Hyundai Motors Company, Audi AG, Nissan Motors Company, Subaru, and Toyota Motors Company vying for market share. The Herfindahl-Hirschman Index (HHI) for 2024 is estimated at xx, suggesting a moderately competitive landscape. Innovation in battery technology (Lithium-ion and Lead-acid) and advancements in 12V and 48V micro-hybrid systems are key drivers of market growth. Stringent CO2 emission regulations globally are significantly impacting the industry, pushing automakers towards adopting micro-hybrid technologies. Product substitutes include fully hybrid and electric vehicles, although micro-hybrids offer a more cost-effective entry point for many consumers and automakers.
The end-user segment is broadly categorized into Passenger Cars and Commercial Vehicles, with Passenger Cars currently dominating the market. Significant M&A activity is expected in the coming years, with a projected xx Million USD in deal value for 2025–2033, primarily driven by strategic partnerships and acquisitions aimed at expanding technological capabilities and market reach.
Micro-Hybrid Vehicles Industry Market Trends & Opportunities
The micro-hybrid vehicle market is experiencing robust growth, driven by increasing consumer demand for fuel-efficient vehicles and tightening emission regulations. The market size reached xx Million in 2024 and is projected to reach xx Million by 2033, representing a significant expansion. Technological advancements, particularly in battery technology and powertrain efficiency, are further accelerating market growth. Consumer preferences are shifting towards vehicles with improved fuel economy and lower environmental impact, creating a strong demand for micro-hybrid solutions. Competitive dynamics are characterized by intense innovation and strategic partnerships, with manufacturers focusing on developing advanced micro-hybrid systems to gain a competitive edge. The market penetration rate for micro-hybrid vehicles is expected to increase from xx% in 2024 to xx% by 2033.
Dominant Markets & Segments in Micro-Hybrid Vehicles Industry
The passenger car segment currently dominates the micro-hybrid vehicle market, accounting for approximately xx% of total sales in 2024. Within the capacity segment, 48V micro-hybrid systems are witnessing faster growth compared to 12V systems due to their superior energy recovery capabilities. Geographically, the market is currently dominated by xx, with a significant contribution from xx and xx.
Key Growth Drivers in Leading Regions:
- Stringent emission regulations: Governments in these regions are implementing stricter emission standards, pushing automakers towards adopting micro-hybrid technologies.
- Government incentives: Subsidies and tax breaks for fuel-efficient vehicles are boosting market demand.
- Growing consumer awareness: Increasing awareness regarding environmental issues is driving consumer preferences towards eco-friendly vehicles.
- Developing infrastructure: Expansion of charging infrastructure supports the adoption of micro-hybrid technologies.
Battery Type: Lithium-ion batteries are gradually gaining prominence over lead-acid batteries due to their higher energy density and longer lifespan. However, the cost-effectiveness of lead-acid batteries continues to drive their adoption, particularly in cost-sensitive segments.
Micro-Hybrid Vehicles Industry Product Analysis
Micro-hybrid vehicle technology encompasses various system configurations, primarily focusing on improving fuel efficiency through regenerative braking and engine start-stop systems. The key advantage of micro-hybrid systems lies in their relatively low cost and ease of integration into existing vehicle platforms. Technological advancements center around improving battery performance, energy management systems, and the overall efficiency of the powertrain. Market fit is driven by consumer demand for fuel efficiency and the regulatory pressure to reduce CO2 emissions.
Key Drivers, Barriers & Challenges in Micro-Hybrid Vehicles Industry
Key Drivers: The primary drivers for market growth include stringent government emission regulations (e.g., CAFE standards), the increasing consumer demand for fuel-efficient vehicles, and technological advancements in battery technology and powertrain systems. Economic factors such as fluctuating fuel prices also play a role.
Key Challenges: High initial costs associated with implementing micro-hybrid technology and supply chain disruptions impacting the availability of key components are significant challenges. Regulatory complexities and the competitive landscape with alternative technologies (fully electric vehicles) also pose obstacles to market growth. xx Million USD in potential losses are predicted due to supply chain issues in 2026.
Growth Drivers in the Micro-Hybrid Vehicles Industry Market
Growth is primarily fueled by stringent global emission norms, the escalating demand for fuel-efficient vehicles, and continuous improvements in battery technology and powertrain efficiency. Government incentives and supportive policies in key markets also significantly contribute to market expansion.
Challenges Impacting Micro-Hybrid Vehicles Industry Growth
The industry faces challenges including the high initial cost of adopting micro-hybrid technology, the complexity of integrating these systems into existing vehicle platforms, and potential supply chain disruptions. Furthermore, competition from fully electric vehicles and other alternative technologies represents a significant hurdle.
Key Players Shaping the Micro-Hybrid Vehicles Industry Market
- General Motors
- Mahindra and Mahindra
- Daimler AG
- Kia Motors Corporation
- BMW AG
- Hyundai Motors Company
- Audi AG
- Nissan Motors Company
- Subaru
- Toyota Motors Company
Significant Micro-Hybrid Vehicles Industry Milestones
- September 2021: Birla Carbon's entry into the energy systems market, signaling increased demand for higher-performance lead-acid batteries for micro-hybrid applications.
- May 2021: Renault's expansion of its hybrid lineup, including the introduction of 12V micro-hybridization in several models, indicating a shift towards broader adoption of micro-hybrid technology.
Future Outlook for Micro-Hybrid Vehicles Industry Market
The micro-hybrid vehicle market is poised for sustained growth, driven by the ongoing trend toward fuel efficiency and environmental consciousness. Technological advancements, coupled with supportive government policies, will further propel market expansion. Strategic partnerships and collaborations among manufacturers and suppliers will be crucial in driving innovation and accelerating the adoption of this technology. The market is expected to witness significant expansion in various regions, particularly in developing economies with growing vehicle sales and increasing awareness of environmental concerns.
Micro-Hybrid Vehicles Industry Segmentation
-
1. Capacity
- 1.1. 12 V MicroHybrid
- 1.2. 48 V Micro Hybrid
-
2. Vehicle Type
- 2.1. Commercial Vehicle
- 2.2. Passenger Cars
-
3. Battery Type
- 3.1. Lithium Ion
- 3.2. Lead Acid
Micro-Hybrid Vehicles Industry Segmentation By Geography
-
1. North America
- 1.1. United States
- 1.2. Canada
- 1.3. Rest of North America
-
2. Europe
- 2.1. Germany
- 2.2. United Kingdom
- 2.3. France
- 2.4. Italy
- 2.5. Rest of Europe
-
3. Asia Pacific
- 3.1. India
- 3.2. China
- 3.3. Japan
- 3.4. South Korea
- 3.5. Rest of Asia Pacific
-
4. Rest of the World
- 4.1. Brazil
- 4.2. Mexico
- 4.3. South Africa
- 4.4. Other Countries
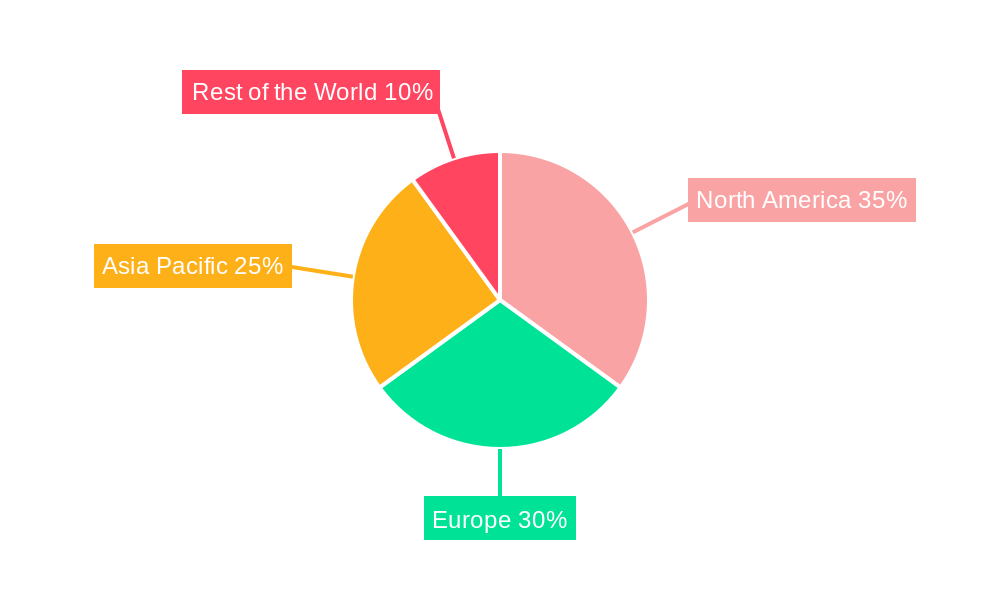
Micro-Hybrid Vehicles Industry Regional Market Share
Geographic Coverage of Micro-Hybrid Vehicles Industry
Micro-Hybrid Vehicles Industry REPORT HIGHLIGHTS
| Aspects | Details |
|---|---|
| Study Period | 2020-2034 |
| Base Year | 2025 |
| Estimated Year | 2026 |
| Forecast Period | 2026-2034 |
| Historical Period | 2020-2025 |
| Growth Rate | CAGR of 4.8% from 2020-2034 |
| Segmentation |
|
Table of Contents
- 1. Introduction
- 1.1. Research Scope
- 1.2. Market Segmentation
- 1.3. Research Objective
- 1.4. Definitions and Assumptions
- 2. Executive Summary
- 2.1. Market Snapshot
- 3. Market Dynamics
- 3.1. Market Drivers
- 3.2. Market Restrains
- 3.3. Market Trends
- 3.4. Market Opportunities
- 4. Market Factor Analysis
- 4.1. Porters Five Forces
- 4.1.1. Bargaining Power of Suppliers
- 4.1.2. Bargaining Power of Buyers
- 4.1.3. Threat of New Entrants
- 4.1.4. Threat of Substitutes
- 4.1.5. Competitive Rivalry
- 4.2. PESTEL analysis
- 4.3. BCG Analysis
- 4.3.1. Stars (High Growth, High Market Share)
- 4.3.2. Cash Cows (Low Growth, High Market Share)
- 4.3.3. Question Mark (High Growth, Low Market Share)
- 4.3.4. Dogs (Low Growth, Low Market Share)
- 4.4. Ansoff Matrix Analysis
- 4.5. Supply Chain Analysis
- 4.6. Regulatory Landscape
- 4.7. Current Market Potential and Opportunity Assessment (TAM–SAM–SOM Framework)
- 4.8. TIR Analyst Note
- 4.1. Porters Five Forces
- 5. Market Analysis, Insights and Forecast 2021-2033
- 5.1. Market Analysis, Insights and Forecast - by Capacity
- 5.1.1. 12 V MicroHybrid
- 5.1.2. 48 V Micro Hybrid
- 5.2. Market Analysis, Insights and Forecast - by Vehicle Type
- 5.2.1. Commercial Vehicle
- 5.2.2. Passenger Cars
- 5.3. Market Analysis, Insights and Forecast - by Battery Type
- 5.3.1. Lithium Ion
- 5.3.2. Lead Acid
- 5.4. Market Analysis, Insights and Forecast - by Region
- 5.4.1. North America
- 5.4.2. Europe
- 5.4.3. Asia Pacific
- 5.4.4. Rest of the World
- 5.1. Market Analysis, Insights and Forecast - by Capacity
- 6. Global Micro-Hybrid Vehicles Industry Analysis, Insights and Forecast, 2021-2033
- 6.1. Market Analysis, Insights and Forecast - by Capacity
- 6.1.1. 12 V MicroHybrid
- 6.1.2. 48 V Micro Hybrid
- 6.2. Market Analysis, Insights and Forecast - by Vehicle Type
- 6.2.1. Commercial Vehicle
- 6.2.2. Passenger Cars
- 6.3. Market Analysis, Insights and Forecast - by Battery Type
- 6.3.1. Lithium Ion
- 6.3.2. Lead Acid
- 6.1. Market Analysis, Insights and Forecast - by Capacity
- 7. North America Micro-Hybrid Vehicles Industry Analysis, Insights and Forecast, 2020-2032
- 7.1. Market Analysis, Insights and Forecast - by Capacity
- 7.1.1. 12 V MicroHybrid
- 7.1.2. 48 V Micro Hybrid
- 7.2. Market Analysis, Insights and Forecast - by Vehicle Type
- 7.2.1. Commercial Vehicle
- 7.2.2. Passenger Cars
- 7.3. Market Analysis, Insights and Forecast - by Battery Type
- 7.3.1. Lithium Ion
- 7.3.2. Lead Acid
- 7.1. Market Analysis, Insights and Forecast - by Capacity
- 8. Europe Micro-Hybrid Vehicles Industry Analysis, Insights and Forecast, 2020-2032
- 8.1. Market Analysis, Insights and Forecast - by Capacity
- 8.1.1. 12 V MicroHybrid
- 8.1.2. 48 V Micro Hybrid
- 8.2. Market Analysis, Insights and Forecast - by Vehicle Type
- 8.2.1. Commercial Vehicle
- 8.2.2. Passenger Cars
- 8.3. Market Analysis, Insights and Forecast - by Battery Type
- 8.3.1. Lithium Ion
- 8.3.2. Lead Acid
- 8.1. Market Analysis, Insights and Forecast - by Capacity
- 9. Asia Pacific Micro-Hybrid Vehicles Industry Analysis, Insights and Forecast, 2020-2032
- 9.1. Market Analysis, Insights and Forecast - by Capacity
- 9.1.1. 12 V MicroHybrid
- 9.1.2. 48 V Micro Hybrid
- 9.2. Market Analysis, Insights and Forecast - by Vehicle Type
- 9.2.1. Commercial Vehicle
- 9.2.2. Passenger Cars
- 9.3. Market Analysis, Insights and Forecast - by Battery Type
- 9.3.1. Lithium Ion
- 9.3.2. Lead Acid
- 9.1. Market Analysis, Insights and Forecast - by Capacity
- 10. Rest of the World Micro-Hybrid Vehicles Industry Analysis, Insights and Forecast, 2020-2032
- 10.1. Market Analysis, Insights and Forecast - by Capacity
- 10.1.1. 12 V MicroHybrid
- 10.1.2. 48 V Micro Hybrid
- 10.2. Market Analysis, Insights and Forecast - by Vehicle Type
- 10.2.1. Commercial Vehicle
- 10.2.2. Passenger Cars
- 10.3. Market Analysis, Insights and Forecast - by Battery Type
- 10.3.1. Lithium Ion
- 10.3.2. Lead Acid
- 10.1. Market Analysis, Insights and Forecast - by Capacity
- 11. Competitive Analysis
- 11.1. Company Profiles
- 11.1.1 General Motors
- 11.1.1.1. Company Overview
- 11.1.1.2. Products
- 11.1.1.3. Company Financials
- 11.1.1.4. SWOT Analysis
- 11.1.2 Mahindra and Mahindra
- 11.1.2.1. Company Overview
- 11.1.2.2. Products
- 11.1.2.3. Company Financials
- 11.1.2.4. SWOT Analysis
- 11.1.3 Daimler AG
- 11.1.3.1. Company Overview
- 11.1.3.2. Products
- 11.1.3.3. Company Financials
- 11.1.3.4. SWOT Analysis
- 11.1.4 Kia Motors Corporatio
- 11.1.4.1. Company Overview
- 11.1.4.2. Products
- 11.1.4.3. Company Financials
- 11.1.4.4. SWOT Analysis
- 11.1.5 BMW AG
- 11.1.5.1. Company Overview
- 11.1.5.2. Products
- 11.1.5.3. Company Financials
- 11.1.5.4. SWOT Analysis
- 11.1.6 Hyundai Motors Company
- 11.1.6.1. Company Overview
- 11.1.6.2. Products
- 11.1.6.3. Company Financials
- 11.1.6.4. SWOT Analysis
- 11.1.7 Audi AG
- 11.1.7.1. Company Overview
- 11.1.7.2. Products
- 11.1.7.3. Company Financials
- 11.1.7.4. SWOT Analysis
- 11.1.8 Nissan Motors Company
- 11.1.8.1. Company Overview
- 11.1.8.2. Products
- 11.1.8.3. Company Financials
- 11.1.8.4. SWOT Analysis
- 11.1.9 Subaru
- 11.1.9.1. Company Overview
- 11.1.9.2. Products
- 11.1.9.3. Company Financials
- 11.1.9.4. SWOT Analysis
- 11.1.10 Toyota Motors Company
- 11.1.10.1. Company Overview
- 11.1.10.2. Products
- 11.1.10.3. Company Financials
- 11.1.10.4. SWOT Analysis
- 11.1.1 General Motors
- 11.2. Market Entropy
- 11.2.1 Company's Key Areas Served
- 11.2.2 Recent Developments
- 11.3. Company Market Share Analysis 2025
- 11.3.1 Top 5 Companies Market Share Analysis
- 11.3.2 Top 3 Companies Market Share Analysis
- 11.4. List of Potential Customers
- 12. Research Methodology
List of Figures
- Figure 1: Global Micro-Hybrid Vehicles Industry Revenue Breakdown (billion, %) by Region 2025 & 2033
- Figure 2: North America Micro-Hybrid Vehicles Industry Revenue (billion), by Capacity 2025 & 2033
- Figure 3: North America Micro-Hybrid Vehicles Industry Revenue Share (%), by Capacity 2025 & 2033
- Figure 4: North America Micro-Hybrid Vehicles Industry Revenue (billion), by Vehicle Type 2025 & 2033
- Figure 5: North America Micro-Hybrid Vehicles Industry Revenue Share (%), by Vehicle Type 2025 & 2033
- Figure 6: North America Micro-Hybrid Vehicles Industry Revenue (billion), by Battery Type 2025 & 2033
- Figure 7: North America Micro-Hybrid Vehicles Industry Revenue Share (%), by Battery Type 2025 & 2033
- Figure 8: North America Micro-Hybrid Vehicles Industry Revenue (billion), by Country 2025 & 2033
- Figure 9: North America Micro-Hybrid Vehicles Industry Revenue Share (%), by Country 2025 & 2033
- Figure 10: Europe Micro-Hybrid Vehicles Industry Revenue (billion), by Capacity 2025 & 2033
- Figure 11: Europe Micro-Hybrid Vehicles Industry Revenue Share (%), by Capacity 2025 & 2033
- Figure 12: Europe Micro-Hybrid Vehicles Industry Revenue (billion), by Vehicle Type 2025 & 2033
- Figure 13: Europe Micro-Hybrid Vehicles Industry Revenue Share (%), by Vehicle Type 2025 & 2033
- Figure 14: Europe Micro-Hybrid Vehicles Industry Revenue (billion), by Battery Type 2025 & 2033
- Figure 15: Europe Micro-Hybrid Vehicles Industry Revenue Share (%), by Battery Type 2025 & 2033
- Figure 16: Europe Micro-Hybrid Vehicles Industry Revenue (billion), by Country 2025 & 2033
- Figure 17: Europe Micro-Hybrid Vehicles Industry Revenue Share (%), by Country 2025 & 2033
- Figure 18: Asia Pacific Micro-Hybrid Vehicles Industry Revenue (billion), by Capacity 2025 & 2033
- Figure 19: Asia Pacific Micro-Hybrid Vehicles Industry Revenue Share (%), by Capacity 2025 & 2033
- Figure 20: Asia Pacific Micro-Hybrid Vehicles Industry Revenue (billion), by Vehicle Type 2025 & 2033
- Figure 21: Asia Pacific Micro-Hybrid Vehicles Industry Revenue Share (%), by Vehicle Type 2025 & 2033
- Figure 22: Asia Pacific Micro-Hybrid Vehicles Industry Revenue (billion), by Battery Type 2025 & 2033
- Figure 23: Asia Pacific Micro-Hybrid Vehicles Industry Revenue Share (%), by Battery Type 2025 & 2033
- Figure 24: Asia Pacific Micro-Hybrid Vehicles Industry Revenue (billion), by Country 2025 & 2033
- Figure 25: Asia Pacific Micro-Hybrid Vehicles Industry Revenue Share (%), by Country 2025 & 2033
- Figure 26: Rest of the World Micro-Hybrid Vehicles Industry Revenue (billion), by Capacity 2025 & 2033
- Figure 27: Rest of the World Micro-Hybrid Vehicles Industry Revenue Share (%), by Capacity 2025 & 2033
- Figure 28: Rest of the World Micro-Hybrid Vehicles Industry Revenue (billion), by Vehicle Type 2025 & 2033
- Figure 29: Rest of the World Micro-Hybrid Vehicles Industry Revenue Share (%), by Vehicle Type 2025 & 2033
- Figure 30: Rest of the World Micro-Hybrid Vehicles Industry Revenue (billion), by Battery Type 2025 & 2033
- Figure 31: Rest of the World Micro-Hybrid Vehicles Industry Revenue Share (%), by Battery Type 2025 & 2033
- Figure 32: Rest of the World Micro-Hybrid Vehicles Industry Revenue (billion), by Country 2025 & 2033
- Figure 33: Rest of the World Micro-Hybrid Vehicles Industry Revenue Share (%), by Country 2025 & 2033
List of Tables
- Table 1: Global Micro-Hybrid Vehicles Industry Revenue billion Forecast, by Capacity 2020 & 2033
- Table 2: Global Micro-Hybrid Vehicles Industry Revenue billion Forecast, by Vehicle Type 2020 & 2033
- Table 3: Global Micro-Hybrid Vehicles Industry Revenue billion Forecast, by Battery Type 2020 & 2033
- Table 4: Global Micro-Hybrid Vehicles Industry Revenue billion Forecast, by Region 2020 & 2033
- Table 5: Global Micro-Hybrid Vehicles Industry Revenue billion Forecast, by Capacity 2020 & 2033
- Table 6: Global Micro-Hybrid Vehicles Industry Revenue billion Forecast, by Vehicle Type 2020 & 2033
- Table 7: Global Micro-Hybrid Vehicles Industry Revenue billion Forecast, by Battery Type 2020 & 2033
- Table 8: Global Micro-Hybrid Vehicles Industry Revenue billion Forecast, by Country 2020 & 2033
- Table 9: United States Micro-Hybrid Vehicles Industry Revenue (billion) Forecast, by Application 2020 & 2033
- Table 10: Canada Micro-Hybrid Vehicles Industry Revenue (billion) Forecast, by Application 2020 & 2033
- Table 11: Rest of North America Micro-Hybrid Vehicles Industry Revenue (billion) Forecast, by Application 2020 & 2033
- Table 12: Global Micro-Hybrid Vehicles Industry Revenue billion Forecast, by Capacity 2020 & 2033
- Table 13: Global Micro-Hybrid Vehicles Industry Revenue billion Forecast, by Vehicle Type 2020 & 2033
- Table 14: Global Micro-Hybrid Vehicles Industry Revenue billion Forecast, by Battery Type 2020 & 2033
- Table 15: Global Micro-Hybrid Vehicles Industry Revenue billion Forecast, by Country 2020 & 2033
- Table 16: Germany Micro-Hybrid Vehicles Industry Revenue (billion) Forecast, by Application 2020 & 2033
- Table 17: United Kingdom Micro-Hybrid Vehicles Industry Revenue (billion) Forecast, by Application 2020 & 2033
- Table 18: France Micro-Hybrid Vehicles Industry Revenue (billion) Forecast, by Application 2020 & 2033
- Table 19: Italy Micro-Hybrid Vehicles Industry Revenue (billion) Forecast, by Application 2020 & 2033
- Table 20: Rest of Europe Micro-Hybrid Vehicles Industry Revenue (billion) Forecast, by Application 2020 & 2033
- Table 21: Global Micro-Hybrid Vehicles Industry Revenue billion Forecast, by Capacity 2020 & 2033
- Table 22: Global Micro-Hybrid Vehicles Industry Revenue billion Forecast, by Vehicle Type 2020 & 2033
- Table 23: Global Micro-Hybrid Vehicles Industry Revenue billion Forecast, by Battery Type 2020 & 2033
- Table 24: Global Micro-Hybrid Vehicles Industry Revenue billion Forecast, by Country 2020 & 2033
- Table 25: India Micro-Hybrid Vehicles Industry Revenue (billion) Forecast, by Application 2020 & 2033
- Table 26: China Micro-Hybrid Vehicles Industry Revenue (billion) Forecast, by Application 2020 & 2033
- Table 27: Japan Micro-Hybrid Vehicles Industry Revenue (billion) Forecast, by Application 2020 & 2033
- Table 28: South Korea Micro-Hybrid Vehicles Industry Revenue (billion) Forecast, by Application 2020 & 2033
- Table 29: Rest of Asia Pacific Micro-Hybrid Vehicles Industry Revenue (billion) Forecast, by Application 2020 & 2033
- Table 30: Global Micro-Hybrid Vehicles Industry Revenue billion Forecast, by Capacity 2020 & 2033
- Table 31: Global Micro-Hybrid Vehicles Industry Revenue billion Forecast, by Vehicle Type 2020 & 2033
- Table 32: Global Micro-Hybrid Vehicles Industry Revenue billion Forecast, by Battery Type 2020 & 2033
- Table 33: Global Micro-Hybrid Vehicles Industry Revenue billion Forecast, by Country 2020 & 2033
- Table 34: Brazil Micro-Hybrid Vehicles Industry Revenue (billion) Forecast, by Application 2020 & 2033
- Table 35: Mexico Micro-Hybrid Vehicles Industry Revenue (billion) Forecast, by Application 2020 & 2033
- Table 36: South Africa Micro-Hybrid Vehicles Industry Revenue (billion) Forecast, by Application 2020 & 2033
- Table 37: Other Countries Micro-Hybrid Vehicles Industry Revenue (billion) Forecast, by Application 2020 & 2033
Frequently Asked Questions
1. What is the projected Compound Annual Growth Rate (CAGR) of the Micro-Hybrid Vehicles Industry?
The projected CAGR is approximately 4.8%.
2. Which companies are prominent players in the Micro-Hybrid Vehicles Industry?
Key companies in the market include General Motors, Mahindra and Mahindra, Daimler AG, Kia Motors Corporatio, BMW AG, Hyundai Motors Company, Audi AG, Nissan Motors Company, Subaru, Toyota Motors Company.
3. What are the main segments of the Micro-Hybrid Vehicles Industry?
The market segments include Capacity, Vehicle Type, Battery Type.
4. Can you provide details about the market size?
The market size is estimated to be USD 16.13 billion as of 2022.
5. What are some drivers contributing to market growth?
Increasing Passenger Vehicle Sales Across the Globe.
6. What are the notable trends driving market growth?
Increasing Demand for Lithium-ion Batteries.
7. Are there any restraints impacting market growth?
High Cost may Restrict the Growth Potential.
8. Can you provide examples of recent developments in the market?
September 2021: Birla Carbon announced its entry into the energy systems market by participating in The Battery Show 2021 in the United States. Demand for higher-performance lead acid batteries is increasing as automakers strive to meet more stringent CO2 emission requirements, particularly for start-stop or micro-hybrid vehicles.
9. What pricing options are available for accessing the report?
Pricing options include single-user, multi-user, and enterprise licenses priced at USD 4750, USD 5250, and USD 8750 respectively.
10. Is the market size provided in terms of value or volume?
The market size is provided in terms of value, measured in billion.
11. Are there any specific market keywords associated with the report?
Yes, the market keyword associated with the report is "Micro-Hybrid Vehicles Industry," which aids in identifying and referencing the specific market segment covered.
12. How do I determine which pricing option suits my needs best?
The pricing options vary based on user requirements and access needs. Individual users may opt for single-user licenses, while businesses requiring broader access may choose multi-user or enterprise licenses for cost-effective access to the report.
13. Are there any additional resources or data provided in the Micro-Hybrid Vehicles Industry report?
While the report offers comprehensive insights, it's advisable to review the specific contents or supplementary materials provided to ascertain if additional resources or data are available.
14. How can I stay updated on further developments or reports in the Micro-Hybrid Vehicles Industry?
To stay informed about further developments, trends, and reports in the Micro-Hybrid Vehicles Industry, consider subscribing to industry newsletters, following relevant companies and organizations, or regularly checking reputable industry news sources and publications.
Methodology
Step 1 - Identification of Relevant Samples Size from Population Database


Step 2 - Approaches for Defining Global Market Size (Value, Volume* & Price*)

Note*: In applicable scenarios
Step 3 - Data Sources
Primary Research
- Web Analytics
- Survey Reports
- Research Institute
- Latest Research Reports
- Opinion Leaders
Secondary Research
- Annual Reports
- White Paper
- Latest Press Release
- Industry Association
- Paid Database
- Investor Presentations

Step 4 - Data Triangulation
Involves using different sources of information in order to increase the validity of a study
These sources are likely to be stakeholders in a program - participants, other researchers, program staff, other community members, and so on.
Then we put all data in single framework & apply various statistical tools to find out the dynamic on the market.
During the analysis stage, feedback from the stakeholder groups would be compared to determine areas of agreement as well as areas of divergence