

Key Insights
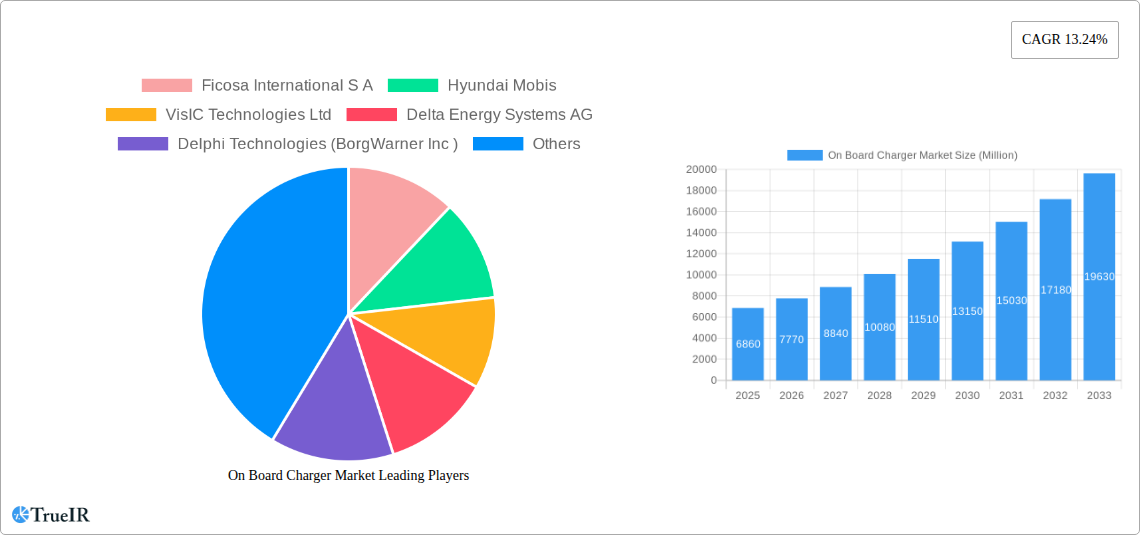
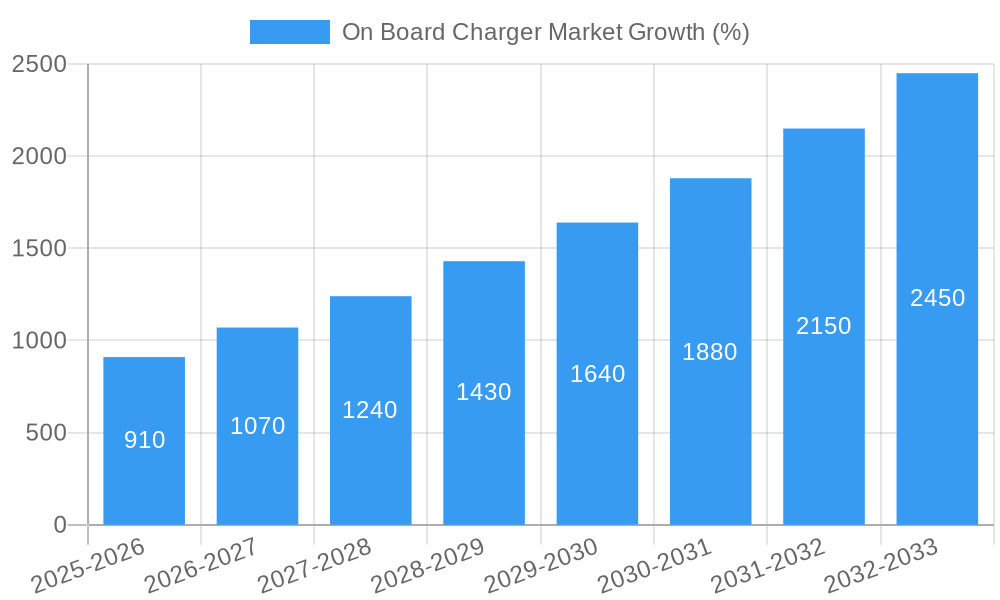
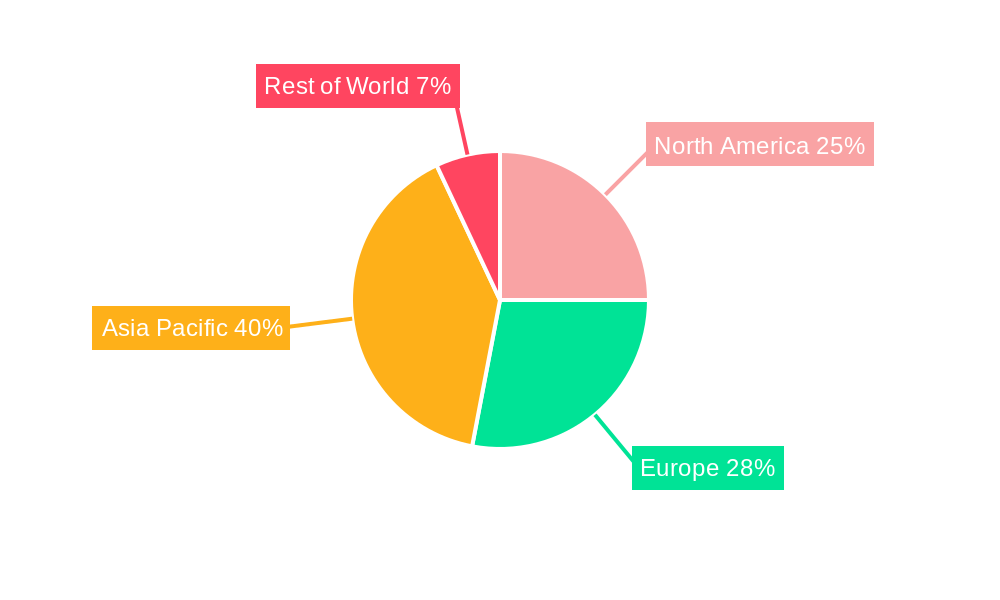
The On-Board Charger (OBC) market is experiencing robust growth, driven by the surging demand for electric vehicles (EVs). The market, valued at $6.86 billion in 2025, is projected to expand at a Compound Annual Growth Rate (CAGR) of 13.24% from 2025 to 2033. This significant growth is fueled by several factors. Increasing government regulations promoting EV adoption globally, coupled with advancements in battery technology leading to greater EV range and faster charging capabilities, are key drivers. The rising consumer preference for eco-friendly transportation and the decreasing cost of OBCs are further contributing to market expansion. Segment-wise, Battery Electric Vehicles (BEVs) are expected to dominate the powertrain type segment, owing to their higher adoption rate compared to Plug-in Hybrid Electric Vehicles (PHEVs). Within the vehicle type segment, passenger cars will likely hold a larger market share than commercial vehicles in the forecast period, although the latter is expected to witness considerable growth. Geographically, Asia Pacific, particularly China, is poised to be a major market due to massive EV production and sales within the region. North America and Europe will also contribute significantly to the overall market growth, driven by supportive government policies and rising consumer awareness. The competitive landscape is characterized by a mix of established automotive component manufacturers and specialized electronics companies, each vying for market share through technological innovation and strategic partnerships.
The competitive intensity is expected to increase as new players enter the market, driven by the lucrative growth opportunities. Challenges to market growth include the high initial cost of EVs, limited charging infrastructure in certain regions, and concerns about battery range anxiety. However, ongoing improvements in battery technology, expanding charging infrastructure networks, and decreasing OBC prices are expected to mitigate these challenges. The market is also witnessing increased focus on higher power rating OBCs (above 11 kW) to facilitate faster charging times, further contributing to market growth. The OEM segment currently holds a larger share of the sales channel, but the aftermarket segment is likely to gain traction as the EV fleet expands and requires replacement parts. The forecast period, spanning from 2025 to 2033, paints a picture of continued, robust expansion for the OBC market, making it an attractive investment prospect for stakeholders across the value chain.
This dynamic report provides a detailed analysis of the On Board Charger (OBC) market, offering invaluable insights for stakeholders across the automotive and energy sectors. The study covers the period 2019-2033, with a focus on the forecast period 2025-2033 and a base year of 2025. Expect comprehensive data on market size, growth drivers, competitive dynamics, and future trends, enabling informed decision-making and strategic planning. This report projects the market to reach xx Million by 2033, exhibiting a CAGR of xx% during the forecast period.
On Board Charger Market Market Structure & Competitive Landscape
The On Board Charger market exhibits a moderately consolidated structure, with key players like Ficosa International S.A., Hyundai Mobis, VisIC Technologies Ltd, Delta Energy Systems AG, Delphi Technologies (BorgWarner Inc.), Bel Fuse Inc, Brusa Elektronik AG, Toyota Industries Corporation, STMicroelectronics, Valeo SE, and LG Corporation vying for market share. The Herfindahl-Hirschman Index (HHI) is estimated at xx, indicating a moderately competitive landscape.
Innovation Drivers: The market is driven by continuous innovation in power electronics, focusing on higher power density, improved efficiency, and cost reduction. The integration of silicon carbide (SiC) and gallium nitride (GaN) technologies is significantly enhancing OBC performance.
Regulatory Impacts: Government regulations promoting electric vehicle (EV) adoption, such as emission standards and fuel efficiency targets, are indirectly bolstering the OBC market. Stringent safety standards for high-voltage systems also influence OBC design and manufacturing.
Product Substitutes: While no direct substitutes exist for OBCs in EVs, advancements in wireless charging technologies present a potential long-term challenge to the market. However, presently, wired OBCs remain the dominant solution.
End-User Segmentation: The market is segmented by vehicle type (passenger cars and commercial vehicles), powertrain type (BEVs and PHEVs), power rating (less than 11 kW and more than 11 kW), and sales channel (OEM and aftermarket).
M&A Trends: The past five years have witnessed xx mergers and acquisitions (M&A) deals in the OBC market, primarily driven by companies seeking to expand their product portfolios and geographic reach. These transactions have primarily focused on smaller specialized companies with innovative technologies.
On Board Charger Market Market Trends & Opportunities
The global On Board Charger market is experiencing significant growth fueled by the burgeoning demand for electric vehicles. The market size was valued at xx Million in 2025 and is projected to reach xx Million by 2033, demonstrating a robust CAGR of xx%. This growth trajectory is attributed to several key factors:
- Technological Advancements: The adoption of advanced semiconductor technologies (SiC, GaN) is increasing OBC efficiency and power density, leading to faster charging times and reduced vehicle weight.
- Government Incentives: Government policies and subsidies aimed at promoting EV adoption globally are driving the demand for OBCs.
- Expanding Charging Infrastructure: The expansion of public and private charging infrastructure is supporting greater EV adoption and, consequently, OBC demand.
- Shifting Consumer Preferences: Increasing environmental awareness and concerns about fuel prices are driving consumer preference towards electric vehicles, bolstering the OBC market.
- Competitive Landscape: Intense competition among OBC manufacturers is driving innovation and price reductions, making OBCs more accessible and cost-effective.
Dominant Markets & Segments in On Board Charger Market
- Leading Region: The North American market is currently leading the global On Board Charger market.
- Leading Country: China shows significant growth potential and is rapidly gaining market share.
- Dominant Segments:
- By Vehicle Type: Passenger cars currently dominate the market, however, the commercial vehicle segment is expected to witness substantial growth in the coming years.
- By Powertrain Type: BEVs account for the largest market share, driven by the increasing popularity of fully electric vehicles. The PHEV segment is expected to experience moderate growth as well.
- By Power Rating: The segment of OBCs with more than 11 kW is witnessing faster growth due to the rising demand for faster charging capabilities.
- By Sales Channel: OEM sales currently hold a larger market share. However, the aftermarket segment is projected to experience gradual growth due to the increasing number of EVs on the road.
Key Growth Drivers:
- Government regulations promoting electric vehicle adoption.
- Investments in charging infrastructure development.
- Technological advancements in OBC technology, enhancing charging speeds and efficiency.
On Board Charger Market Product Analysis
The OBC market showcases diverse product offerings ranging from low-power chargers for PHEVs to high-power chargers for BEVs. Recent innovations include the integration of advanced semiconductor technologies like SiC and GaN for improved efficiency and power density. Furthermore, manufacturers are focused on reducing the size and weight of OBCs to optimize vehicle design and improve energy efficiency. These advancements directly translate to faster charging times and enhanced performance, providing compelling advantages for OEMs and end-users. The market is seeing a growing trend toward multi-voltage and multi-standard OBCs to cater to the evolving needs of the EV market.
Key Drivers, Barriers & Challenges in On Board Charger Market
Key Drivers: The surging demand for electric vehicles driven by environmental concerns, government regulations, and technological advancements in battery technology are the primary drivers of the OBC market. The increasing availability of charging infrastructure further supports this growth.
Challenges and Restraints: The primary challenges impacting market growth include:
- High initial costs of OBCs: The high manufacturing costs associated with implementing advanced technologies like SiC and GaN can pose a barrier for some manufacturers.
- Supply chain disruptions: The global semiconductor shortage significantly impacts OBC production capacity and lead times.
- Technological advancements that may render OBCs obsolete: Innovations like wireless charging and battery advancements directly affecting charging requirements could pose a long-term threat.
Growth Drivers in the On Board Charger Market Market
The key drivers for growth in the On Board Charger market are technological advancements leading to higher power density and efficiency, government regulations mandating EV adoption, and the expanding charging infrastructure supporting widespread EV use. The increasing consumer preference for EVs due to environmental and economic factors significantly contributes to this positive trend.
Challenges Impacting On Board Charger Market Growth
Significant challenges to the On Board Charger market's growth include high initial investment costs, supply chain vulnerabilities, and the potential emergence of disruptive technologies such as wireless charging that could decrease reliance on OBCs. The evolving regulatory landscape and the competitive nature of the market also present challenges to sustained high growth.
Key Players Shaping the On Board Charger Market Market
- Ficosa International S.A.
- Hyundai Mobis
- VisIC Technologies Ltd
- Delta Energy Systems AG
- Delphi Technologies (BorgWarner Inc.)
- Bel Fuse Inc
- Brusa Elektronik AG
- Toyota Industries Corporation
- STMicroelectronics
- Valeo SE
- LG Corporation
Significant On Board Charger Market Industry Milestones
- March 2024: Ford integrates dual 176 kW on-board chargers into its E-Transit van, significantly reducing charging times. This highlights the trend towards higher-power OBCs.
- July 2023: Stellantis' collaboration to eliminate inverters and OBCs presents a potential headwind for the market, indicating a shift towards alternative charging solutions.
- April 2023: Coulom Solution's development of a cost-effective 20 kW OBC for commercial vehicles demonstrates innovation driving market competitiveness and affordability.
Future Outlook for On Board Charger Market Market
The future of the On Board Charger market remains promising, driven by sustained growth in electric vehicle adoption globally. Technological innovations, including improvements in power density, efficiency, and cost-effectiveness, will further fuel market expansion. However, the potential emergence of alternative charging technologies and the ongoing challenges within supply chains require careful monitoring. Strategic opportunities exist for companies focusing on developing higher-power, cost-effective, and adaptable OBCs for various vehicle types and market segments. The market is poised for continued growth, though with a need for adaptability to emerging technological and market developments.
On Board Charger Market Segmentation
-
1. Vehicle Type
- 1.1. Passenger Cars
- 1.2. Commercial Vehicles
-
2. Powertrain Type
- 2.1. Battery Electric Vehicles (BEVs)
- 2.2. Plug-In Hybrid Electric Vehicles (PHEVs)
-
3. Power Rating
- 3.1. Less than 3.3 kW
- 3.2. 3.3-11 kW
- 3.3. More than 11 kW
-
4. Sales Channel
- 4.1. Original Equipment Manufacturer (OEM)
- 4.2. Aftermarket
On Board Charger Market Segmentation By Geography
-
1. North America
- 1.1. United States
- 1.2. Canada
- 1.3. Rest of North America
-
2. Europe
- 2.1. Germany
- 2.2. United Kingdom
- 2.3. France
- 2.4. Italy
- 2.5. Rest of Europe
-
3. Asia Pacific
- 3.1. China
- 3.2. India
- 3.3. Japan
- 3.4. South Korea
- 3.5. Rest of Asia Pacific
-
4. Rest of the World
- 4.1. Brazil
- 4.2. Mexico
- 4.3. United Arab Emirates
- 4.4. Other Countries
On Board Charger Market REPORT HIGHLIGHTS
| Aspects | Details |
|---|---|
| Study Period | 2019-2033 |
| Base Year | 2024 |
| Estimated Year | 2025 |
| Forecast Period | 2025-2033 |
| Historical Period | 2019-2024 |
| Growth Rate | CAGR of 13.24% from 2019-2033 |
| Segmentation |
|
Table of Contents
- 1. Introduction
- 1.1. Research Scope
- 1.2. Market Segmentation
- 1.3. Research Methodology
- 1.4. Definitions and Assumptions
- 2. Executive Summary
- 2.1. Introduction
- 3. Market Dynamics
- 3.1. Introduction
- 3.2. Market Drivers
- 3.2.1. Aggressive Government Focus to Promote the Adoption of Electric Vehicles Fosters the Growth of the Market
- 3.3. Market Restrains
- 3.3.1. High Cost of On Board Chargers Hampers the Growth of the Market
- 3.4. Market Trends
- 3.4.1. The Passenger Cars Segment is Leading the On Board Charger Market
- 4. Market Factor Analysis
- 4.1. Porters Five Forces
- 4.2. Supply/Value Chain
- 4.3. PESTEL analysis
- 4.4. Market Entropy
- 4.5. Patent/Trademark Analysis
- 5. Global On Board Charger Market Analysis, Insights and Forecast, 2019-2031
- 5.1. Market Analysis, Insights and Forecast - by Vehicle Type
- 5.1.1. Passenger Cars
- 5.1.2. Commercial Vehicles
- 5.2. Market Analysis, Insights and Forecast - by Powertrain Type
- 5.2.1. Battery Electric Vehicles (BEVs)
- 5.2.2. Plug-In Hybrid Electric Vehicles (PHEVs)
- 5.3. Market Analysis, Insights and Forecast - by Power Rating
- 5.3.1. Less than 3.3 kW
- 5.3.2. 3.3-11 kW
- 5.3.3. More than 11 kW
- 5.4. Market Analysis, Insights and Forecast - by Sales Channel
- 5.4.1. Original Equipment Manufacturer (OEM)
- 5.4.2. Aftermarket
- 5.5. Market Analysis, Insights and Forecast - by Region
- 5.5.1. North America
- 5.5.2. Europe
- 5.5.3. Asia Pacific
- 5.5.4. Rest of the World
- 5.1. Market Analysis, Insights and Forecast - by Vehicle Type
- 6. North America On Board Charger Market Analysis, Insights and Forecast, 2019-2031
- 6.1. Market Analysis, Insights and Forecast - by Vehicle Type
- 6.1.1. Passenger Cars
- 6.1.2. Commercial Vehicles
- 6.2. Market Analysis, Insights and Forecast - by Powertrain Type
- 6.2.1. Battery Electric Vehicles (BEVs)
- 6.2.2. Plug-In Hybrid Electric Vehicles (PHEVs)
- 6.3. Market Analysis, Insights and Forecast - by Power Rating
- 6.3.1. Less than 3.3 kW
- 6.3.2. 3.3-11 kW
- 6.3.3. More than 11 kW
- 6.4. Market Analysis, Insights and Forecast - by Sales Channel
- 6.4.1. Original Equipment Manufacturer (OEM)
- 6.4.2. Aftermarket
- 6.1. Market Analysis, Insights and Forecast - by Vehicle Type
- 7. Europe On Board Charger Market Analysis, Insights and Forecast, 2019-2031
- 7.1. Market Analysis, Insights and Forecast - by Vehicle Type
- 7.1.1. Passenger Cars
- 7.1.2. Commercial Vehicles
- 7.2. Market Analysis, Insights and Forecast - by Powertrain Type
- 7.2.1. Battery Electric Vehicles (BEVs)
- 7.2.2. Plug-In Hybrid Electric Vehicles (PHEVs)
- 7.3. Market Analysis, Insights and Forecast - by Power Rating
- 7.3.1. Less than 3.3 kW
- 7.3.2. 3.3-11 kW
- 7.3.3. More than 11 kW
- 7.4. Market Analysis, Insights and Forecast - by Sales Channel
- 7.4.1. Original Equipment Manufacturer (OEM)
- 7.4.2. Aftermarket
- 7.1. Market Analysis, Insights and Forecast - by Vehicle Type
- 8. Asia Pacific On Board Charger Market Analysis, Insights and Forecast, 2019-2031
- 8.1. Market Analysis, Insights and Forecast - by Vehicle Type
- 8.1.1. Passenger Cars
- 8.1.2. Commercial Vehicles
- 8.2. Market Analysis, Insights and Forecast - by Powertrain Type
- 8.2.1. Battery Electric Vehicles (BEVs)
- 8.2.2. Plug-In Hybrid Electric Vehicles (PHEVs)
- 8.3. Market Analysis, Insights and Forecast - by Power Rating
- 8.3.1. Less than 3.3 kW
- 8.3.2. 3.3-11 kW
- 8.3.3. More than 11 kW
- 8.4. Market Analysis, Insights and Forecast - by Sales Channel
- 8.4.1. Original Equipment Manufacturer (OEM)
- 8.4.2. Aftermarket
- 8.1. Market Analysis, Insights and Forecast - by Vehicle Type
- 9. Rest of the World On Board Charger Market Analysis, Insights and Forecast, 2019-2031
- 9.1. Market Analysis, Insights and Forecast - by Vehicle Type
- 9.1.1. Passenger Cars
- 9.1.2. Commercial Vehicles
- 9.2. Market Analysis, Insights and Forecast - by Powertrain Type
- 9.2.1. Battery Electric Vehicles (BEVs)
- 9.2.2. Plug-In Hybrid Electric Vehicles (PHEVs)
- 9.3. Market Analysis, Insights and Forecast - by Power Rating
- 9.3.1. Less than 3.3 kW
- 9.3.2. 3.3-11 kW
- 9.3.3. More than 11 kW
- 9.4. Market Analysis, Insights and Forecast - by Sales Channel
- 9.4.1. Original Equipment Manufacturer (OEM)
- 9.4.2. Aftermarket
- 9.1. Market Analysis, Insights and Forecast - by Vehicle Type
- 10. North America On Board Charger Market Analysis, Insights and Forecast, 2019-2031
- 10.1. Market Analysis, Insights and Forecast - By Country/Sub-region
- 10.1.1 United States
- 10.1.2 Canada
- 10.1.3 Rest of North America
- 11. Europe On Board Charger Market Analysis, Insights and Forecast, 2019-2031
- 11.1. Market Analysis, Insights and Forecast - By Country/Sub-region
- 11.1.1 Germany
- 11.1.2 United Kingdom
- 11.1.3 France
- 11.1.4 Italy
- 11.1.5 Rest of Europe
- 12. Asia Pacific On Board Charger Market Analysis, Insights and Forecast, 2019-2031
- 12.1. Market Analysis, Insights and Forecast - By Country/Sub-region
- 12.1.1 China
- 12.1.2 India
- 12.1.3 Japan
- 12.1.4 South Korea
- 12.1.5 Rest of Asia Pacific
- 13. Rest of the World On Board Charger Market Analysis, Insights and Forecast, 2019-2031
- 13.1. Market Analysis, Insights and Forecast - By Country/Sub-region
- 13.1.1 Brazil
- 13.1.2 Mexico
- 13.1.3 United Arab Emirates
- 13.1.4 Other Countries
- 14. Competitive Analysis
- 14.1. Global Market Share Analysis 2024
- 14.2. Company Profiles
- 14.2.1 Ficosa International S A
- 14.2.1.1. Overview
- 14.2.1.2. Products
- 14.2.1.3. SWOT Analysis
- 14.2.1.4. Recent Developments
- 14.2.1.5. Financials (Based on Availability)
- 14.2.2 Hyundai Mobis
- 14.2.2.1. Overview
- 14.2.2.2. Products
- 14.2.2.3. SWOT Analysis
- 14.2.2.4. Recent Developments
- 14.2.2.5. Financials (Based on Availability)
- 14.2.3 VisIC Technologies Ltd
- 14.2.3.1. Overview
- 14.2.3.2. Products
- 14.2.3.3. SWOT Analysis
- 14.2.3.4. Recent Developments
- 14.2.3.5. Financials (Based on Availability)
- 14.2.4 Delta Energy Systems AG
- 14.2.4.1. Overview
- 14.2.4.2. Products
- 14.2.4.3. SWOT Analysis
- 14.2.4.4. Recent Developments
- 14.2.4.5. Financials (Based on Availability)
- 14.2.5 Delphi Technologies (BorgWarner Inc )
- 14.2.5.1. Overview
- 14.2.5.2. Products
- 14.2.5.3. SWOT Analysis
- 14.2.5.4. Recent Developments
- 14.2.5.5. Financials (Based on Availability)
- 14.2.6 Bel Fuse Inc
- 14.2.6.1. Overview
- 14.2.6.2. Products
- 14.2.6.3. SWOT Analysis
- 14.2.6.4. Recent Developments
- 14.2.6.5. Financials (Based on Availability)
- 14.2.7 Brusa Elektronik AG
- 14.2.7.1. Overview
- 14.2.7.2. Products
- 14.2.7.3. SWOT Analysis
- 14.2.7.4. Recent Developments
- 14.2.7.5. Financials (Based on Availability)
- 14.2.8 Toyota Industries Corporation
- 14.2.8.1. Overview
- 14.2.8.2. Products
- 14.2.8.3. SWOT Analysis
- 14.2.8.4. Recent Developments
- 14.2.8.5. Financials (Based on Availability)
- 14.2.9 STMicroelectronics
- 14.2.9.1. Overview
- 14.2.9.2. Products
- 14.2.9.3. SWOT Analysis
- 14.2.9.4. Recent Developments
- 14.2.9.5. Financials (Based on Availability)
- 14.2.10 Valeo SE
- 14.2.10.1. Overview
- 14.2.10.2. Products
- 14.2.10.3. SWOT Analysis
- 14.2.10.4. Recent Developments
- 14.2.10.5. Financials (Based on Availability)
- 14.2.11 LG Corporation
- 14.2.11.1. Overview
- 14.2.11.2. Products
- 14.2.11.3. SWOT Analysis
- 14.2.11.4. Recent Developments
- 14.2.11.5. Financials (Based on Availability)
- 14.2.1 Ficosa International S A
List of Figures
- Figure 1: Global On Board Charger Market Revenue Breakdown (Million, %) by Region 2024 & 2032
- Figure 2: North America On Board Charger Market Revenue (Million), by Country 2024 & 2032
- Figure 3: North America On Board Charger Market Revenue Share (%), by Country 2024 & 2032
- Figure 4: Europe On Board Charger Market Revenue (Million), by Country 2024 & 2032
- Figure 5: Europe On Board Charger Market Revenue Share (%), by Country 2024 & 2032
- Figure 6: Asia Pacific On Board Charger Market Revenue (Million), by Country 2024 & 2032
- Figure 7: Asia Pacific On Board Charger Market Revenue Share (%), by Country 2024 & 2032
- Figure 8: Rest of the World On Board Charger Market Revenue (Million), by Country 2024 & 2032
- Figure 9: Rest of the World On Board Charger Market Revenue Share (%), by Country 2024 & 2032
- Figure 10: North America On Board Charger Market Revenue (Million), by Vehicle Type 2024 & 2032
- Figure 11: North America On Board Charger Market Revenue Share (%), by Vehicle Type 2024 & 2032
- Figure 12: North America On Board Charger Market Revenue (Million), by Powertrain Type 2024 & 2032
- Figure 13: North America On Board Charger Market Revenue Share (%), by Powertrain Type 2024 & 2032
- Figure 14: North America On Board Charger Market Revenue (Million), by Power Rating 2024 & 2032
- Figure 15: North America On Board Charger Market Revenue Share (%), by Power Rating 2024 & 2032
- Figure 16: North America On Board Charger Market Revenue (Million), by Sales Channel 2024 & 2032
- Figure 17: North America On Board Charger Market Revenue Share (%), by Sales Channel 2024 & 2032
- Figure 18: North America On Board Charger Market Revenue (Million), by Country 2024 & 2032
- Figure 19: North America On Board Charger Market Revenue Share (%), by Country 2024 & 2032
- Figure 20: Europe On Board Charger Market Revenue (Million), by Vehicle Type 2024 & 2032
- Figure 21: Europe On Board Charger Market Revenue Share (%), by Vehicle Type 2024 & 2032
- Figure 22: Europe On Board Charger Market Revenue (Million), by Powertrain Type 2024 & 2032
- Figure 23: Europe On Board Charger Market Revenue Share (%), by Powertrain Type 2024 & 2032
- Figure 24: Europe On Board Charger Market Revenue (Million), by Power Rating 2024 & 2032
- Figure 25: Europe On Board Charger Market Revenue Share (%), by Power Rating 2024 & 2032
- Figure 26: Europe On Board Charger Market Revenue (Million), by Sales Channel 2024 & 2032
- Figure 27: Europe On Board Charger Market Revenue Share (%), by Sales Channel 2024 & 2032
- Figure 28: Europe On Board Charger Market Revenue (Million), by Country 2024 & 2032
- Figure 29: Europe On Board Charger Market Revenue Share (%), by Country 2024 & 2032
- Figure 30: Asia Pacific On Board Charger Market Revenue (Million), by Vehicle Type 2024 & 2032
- Figure 31: Asia Pacific On Board Charger Market Revenue Share (%), by Vehicle Type 2024 & 2032
- Figure 32: Asia Pacific On Board Charger Market Revenue (Million), by Powertrain Type 2024 & 2032
- Figure 33: Asia Pacific On Board Charger Market Revenue Share (%), by Powertrain Type 2024 & 2032
- Figure 34: Asia Pacific On Board Charger Market Revenue (Million), by Power Rating 2024 & 2032
- Figure 35: Asia Pacific On Board Charger Market Revenue Share (%), by Power Rating 2024 & 2032
- Figure 36: Asia Pacific On Board Charger Market Revenue (Million), by Sales Channel 2024 & 2032
- Figure 37: Asia Pacific On Board Charger Market Revenue Share (%), by Sales Channel 2024 & 2032
- Figure 38: Asia Pacific On Board Charger Market Revenue (Million), by Country 2024 & 2032
- Figure 39: Asia Pacific On Board Charger Market Revenue Share (%), by Country 2024 & 2032
- Figure 40: Rest of the World On Board Charger Market Revenue (Million), by Vehicle Type 2024 & 2032
- Figure 41: Rest of the World On Board Charger Market Revenue Share (%), by Vehicle Type 2024 & 2032
- Figure 42: Rest of the World On Board Charger Market Revenue (Million), by Powertrain Type 2024 & 2032
- Figure 43: Rest of the World On Board Charger Market Revenue Share (%), by Powertrain Type 2024 & 2032
- Figure 44: Rest of the World On Board Charger Market Revenue (Million), by Power Rating 2024 & 2032
- Figure 45: Rest of the World On Board Charger Market Revenue Share (%), by Power Rating 2024 & 2032
- Figure 46: Rest of the World On Board Charger Market Revenue (Million), by Sales Channel 2024 & 2032
- Figure 47: Rest of the World On Board Charger Market Revenue Share (%), by Sales Channel 2024 & 2032
- Figure 48: Rest of the World On Board Charger Market Revenue (Million), by Country 2024 & 2032
- Figure 49: Rest of the World On Board Charger Market Revenue Share (%), by Country 2024 & 2032
List of Tables
- Table 1: Global On Board Charger Market Revenue Million Forecast, by Region 2019 & 2032
- Table 2: Global On Board Charger Market Revenue Million Forecast, by Vehicle Type 2019 & 2032
- Table 3: Global On Board Charger Market Revenue Million Forecast, by Powertrain Type 2019 & 2032
- Table 4: Global On Board Charger Market Revenue Million Forecast, by Power Rating 2019 & 2032
- Table 5: Global On Board Charger Market Revenue Million Forecast, by Sales Channel 2019 & 2032
- Table 6: Global On Board Charger Market Revenue Million Forecast, by Region 2019 & 2032
- Table 7: Global On Board Charger Market Revenue Million Forecast, by Country 2019 & 2032
- Table 8: United States On Board Charger Market Revenue (Million) Forecast, by Application 2019 & 2032
- Table 9: Canada On Board Charger Market Revenue (Million) Forecast, by Application 2019 & 2032
- Table 10: Rest of North America On Board Charger Market Revenue (Million) Forecast, by Application 2019 & 2032
- Table 11: Global On Board Charger Market Revenue Million Forecast, by Country 2019 & 2032
- Table 12: Germany On Board Charger Market Revenue (Million) Forecast, by Application 2019 & 2032
- Table 13: United Kingdom On Board Charger Market Revenue (Million) Forecast, by Application 2019 & 2032
- Table 14: France On Board Charger Market Revenue (Million) Forecast, by Application 2019 & 2032
- Table 15: Italy On Board Charger Market Revenue (Million) Forecast, by Application 2019 & 2032
- Table 16: Rest of Europe On Board Charger Market Revenue (Million) Forecast, by Application 2019 & 2032
- Table 17: Global On Board Charger Market Revenue Million Forecast, by Country 2019 & 2032
- Table 18: China On Board Charger Market Revenue (Million) Forecast, by Application 2019 & 2032
- Table 19: India On Board Charger Market Revenue (Million) Forecast, by Application 2019 & 2032
- Table 20: Japan On Board Charger Market Revenue (Million) Forecast, by Application 2019 & 2032
- Table 21: South Korea On Board Charger Market Revenue (Million) Forecast, by Application 2019 & 2032
- Table 22: Rest of Asia Pacific On Board Charger Market Revenue (Million) Forecast, by Application 2019 & 2032
- Table 23: Global On Board Charger Market Revenue Million Forecast, by Country 2019 & 2032
- Table 24: Brazil On Board Charger Market Revenue (Million) Forecast, by Application 2019 & 2032
- Table 25: Mexico On Board Charger Market Revenue (Million) Forecast, by Application 2019 & 2032
- Table 26: United Arab Emirates On Board Charger Market Revenue (Million) Forecast, by Application 2019 & 2032
- Table 27: Other Countries On Board Charger Market Revenue (Million) Forecast, by Application 2019 & 2032
- Table 28: Global On Board Charger Market Revenue Million Forecast, by Vehicle Type 2019 & 2032
- Table 29: Global On Board Charger Market Revenue Million Forecast, by Powertrain Type 2019 & 2032
- Table 30: Global On Board Charger Market Revenue Million Forecast, by Power Rating 2019 & 2032
- Table 31: Global On Board Charger Market Revenue Million Forecast, by Sales Channel 2019 & 2032
- Table 32: Global On Board Charger Market Revenue Million Forecast, by Country 2019 & 2032
- Table 33: United States On Board Charger Market Revenue (Million) Forecast, by Application 2019 & 2032
- Table 34: Canada On Board Charger Market Revenue (Million) Forecast, by Application 2019 & 2032
- Table 35: Rest of North America On Board Charger Market Revenue (Million) Forecast, by Application 2019 & 2032
- Table 36: Global On Board Charger Market Revenue Million Forecast, by Vehicle Type 2019 & 2032
- Table 37: Global On Board Charger Market Revenue Million Forecast, by Powertrain Type 2019 & 2032
- Table 38: Global On Board Charger Market Revenue Million Forecast, by Power Rating 2019 & 2032
- Table 39: Global On Board Charger Market Revenue Million Forecast, by Sales Channel 2019 & 2032
- Table 40: Global On Board Charger Market Revenue Million Forecast, by Country 2019 & 2032
- Table 41: Germany On Board Charger Market Revenue (Million) Forecast, by Application 2019 & 2032
- Table 42: United Kingdom On Board Charger Market Revenue (Million) Forecast, by Application 2019 & 2032
- Table 43: France On Board Charger Market Revenue (Million) Forecast, by Application 2019 & 2032
- Table 44: Italy On Board Charger Market Revenue (Million) Forecast, by Application 2019 & 2032
- Table 45: Rest of Europe On Board Charger Market Revenue (Million) Forecast, by Application 2019 & 2032
- Table 46: Global On Board Charger Market Revenue Million Forecast, by Vehicle Type 2019 & 2032
- Table 47: Global On Board Charger Market Revenue Million Forecast, by Powertrain Type 2019 & 2032
- Table 48: Global On Board Charger Market Revenue Million Forecast, by Power Rating 2019 & 2032
- Table 49: Global On Board Charger Market Revenue Million Forecast, by Sales Channel 2019 & 2032
- Table 50: Global On Board Charger Market Revenue Million Forecast, by Country 2019 & 2032
- Table 51: China On Board Charger Market Revenue (Million) Forecast, by Application 2019 & 2032
- Table 52: India On Board Charger Market Revenue (Million) Forecast, by Application 2019 & 2032
- Table 53: Japan On Board Charger Market Revenue (Million) Forecast, by Application 2019 & 2032
- Table 54: South Korea On Board Charger Market Revenue (Million) Forecast, by Application 2019 & 2032
- Table 55: Rest of Asia Pacific On Board Charger Market Revenue (Million) Forecast, by Application 2019 & 2032
- Table 56: Global On Board Charger Market Revenue Million Forecast, by Vehicle Type 2019 & 2032
- Table 57: Global On Board Charger Market Revenue Million Forecast, by Powertrain Type 2019 & 2032
- Table 58: Global On Board Charger Market Revenue Million Forecast, by Power Rating 2019 & 2032
- Table 59: Global On Board Charger Market Revenue Million Forecast, by Sales Channel 2019 & 2032
- Table 60: Global On Board Charger Market Revenue Million Forecast, by Country 2019 & 2032
- Table 61: Brazil On Board Charger Market Revenue (Million) Forecast, by Application 2019 & 2032
- Table 62: Mexico On Board Charger Market Revenue (Million) Forecast, by Application 2019 & 2032
- Table 63: United Arab Emirates On Board Charger Market Revenue (Million) Forecast, by Application 2019 & 2032
- Table 64: Other Countries On Board Charger Market Revenue (Million) Forecast, by Application 2019 & 2032
Frequently Asked Questions
1. What is the projected Compound Annual Growth Rate (CAGR) of the On Board Charger Market?
The projected CAGR is approximately 13.24%.
2. Which companies are prominent players in the On Board Charger Market?
Key companies in the market include Ficosa International S A, Hyundai Mobis, VisIC Technologies Ltd, Delta Energy Systems AG, Delphi Technologies (BorgWarner Inc ), Bel Fuse Inc, Brusa Elektronik AG, Toyota Industries Corporation, STMicroelectronics, Valeo SE, LG Corporation.
3. What are the main segments of the On Board Charger Market?
The market segments include Vehicle Type, Powertrain Type, Power Rating, Sales Channel.
4. Can you provide details about the market size?
The market size is estimated to be USD 6.86 Million as of 2022.
5. What are some drivers contributing to market growth?
Aggressive Government Focus to Promote the Adoption of Electric Vehicles Fosters the Growth of the Market.
6. What are the notable trends driving market growth?
The Passenger Cars Segment is Leading the On Board Charger Market.
7. Are there any restraints impacting market growth?
High Cost of On Board Chargers Hampers the Growth of the Market.
8. Can you provide examples of recent developments in the market?
March 2024: Ford announced the integration of dual on board chargers into its E-Transit electric commercial van, capable of charging at a power of 176 kW. The company stated that its latest incorporation will help vehicles charge from zero to 100% in six hours and eleven minutes when using the Ford Pro Series 2 80A charging station.
9. What pricing options are available for accessing the report?
Pricing options include single-user, multi-user, and enterprise licenses priced at USD 4750, USD 5250, and USD 8750 respectively.
10. Is the market size provided in terms of value or volume?
The market size is provided in terms of value, measured in Million.
11. Are there any specific market keywords associated with the report?
Yes, the market keyword associated with the report is "On Board Charger Market," which aids in identifying and referencing the specific market segment covered.
12. How do I determine which pricing option suits my needs best?
The pricing options vary based on user requirements and access needs. Individual users may opt for single-user licenses, while businesses requiring broader access may choose multi-user or enterprise licenses for cost-effective access to the report.
13. Are there any additional resources or data provided in the On Board Charger Market report?
While the report offers comprehensive insights, it's advisable to review the specific contents or supplementary materials provided to ascertain if additional resources or data are available.
14. How can I stay updated on further developments or reports in the On Board Charger Market?
To stay informed about further developments, trends, and reports in the On Board Charger Market, consider subscribing to industry newsletters, following relevant companies and organizations, or regularly checking reputable industry news sources and publications.
Methodology
Step 1 - Identification of Relevant Samples Size from Population Database


Step 2 - Approaches for Defining Global Market Size (Value, Volume* & Price*)

Note*: In applicable scenarios
Step 3 - Data Sources
Primary Research
- Web Analytics
- Survey Reports
- Research Institute
- Latest Research Reports
- Opinion Leaders
Secondary Research
- Annual Reports
- White Paper
- Latest Press Release
- Industry Association
- Paid Database
- Investor Presentations

Step 4 - Data Triangulation
Involves using different sources of information in order to increase the validity of a study
These sources are likely to be stakeholders in a program - participants, other researchers, program staff, other community members, and so on.
Then we put all data in single framework & apply various statistical tools to find out the dynamic on the market.
During the analysis stage, feedback from the stakeholder groups would be compared to determine areas of agreement as well as areas of divergence
