

Key Insights
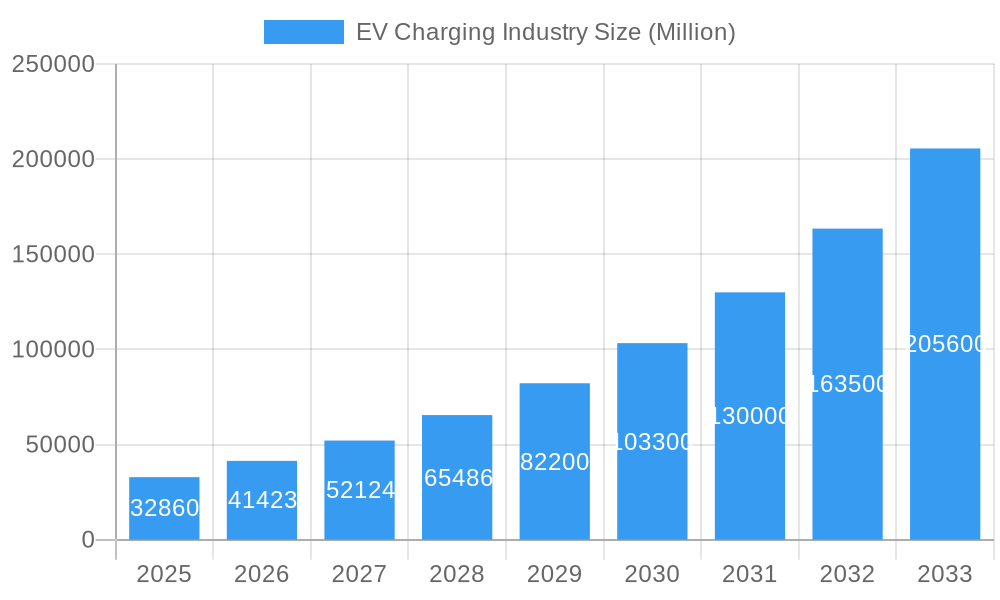
The global EV charging infrastructure market is experiencing explosive growth, projected to reach \$32.86 billion in 2025 and exhibiting a remarkable Compound Annual Growth Rate (CAGR) of 25.94% from 2025 to 2033. This surge is driven by several key factors. The increasing adoption of electric vehicles (EVs), spurred by government incentives, environmental concerns, and advancements in battery technology, is a primary driver. Furthermore, the expanding network of public charging stations, coupled with the growing availability of private charging solutions (home and workplace installations), is significantly accelerating market expansion. Technological advancements in charging technologies, such as faster charging speeds (DC fast charging) and innovative solutions like battery swapping, are further contributing to market growth. The market is segmented by charger type (AC vs. DC), ownership (public vs. private), service type (charging services vs. battery swapping), infrastructure type (Chademo, CCS, GB/T, Tesla Superchargers, etc.), and vehicle type (passenger cars vs. commercial vehicles). The geographical distribution shows strong growth across North America, Europe, and Asia Pacific, with China, the US, and several European countries leading the charge. However, challenges remain, including the high initial investment costs associated with installing charging infrastructure, uneven geographical distribution of charging stations, and concerns about charging infrastructure reliability and interoperability.
EV Charging Industry Market Size (In Billion)
The market's future trajectory hinges on overcoming these challenges. Continued investment in research and development, standardization efforts to ensure compatibility across different charging technologies, and the development of robust grid infrastructure capable of handling the increasing electricity demand are crucial for sustainable growth. Government policies promoting EV adoption and supporting the development of charging infrastructure play a pivotal role. The expansion into underserved markets and the development of innovative business models, such as charging-as-a-service, will also shape the market's future. Competition among established players and new entrants is intense, fostering innovation and driving down costs, making EV charging more accessible and affordable for consumers. This dynamic market promises significant opportunities for businesses involved in manufacturing, installation, operation, and maintenance of EV charging infrastructure.
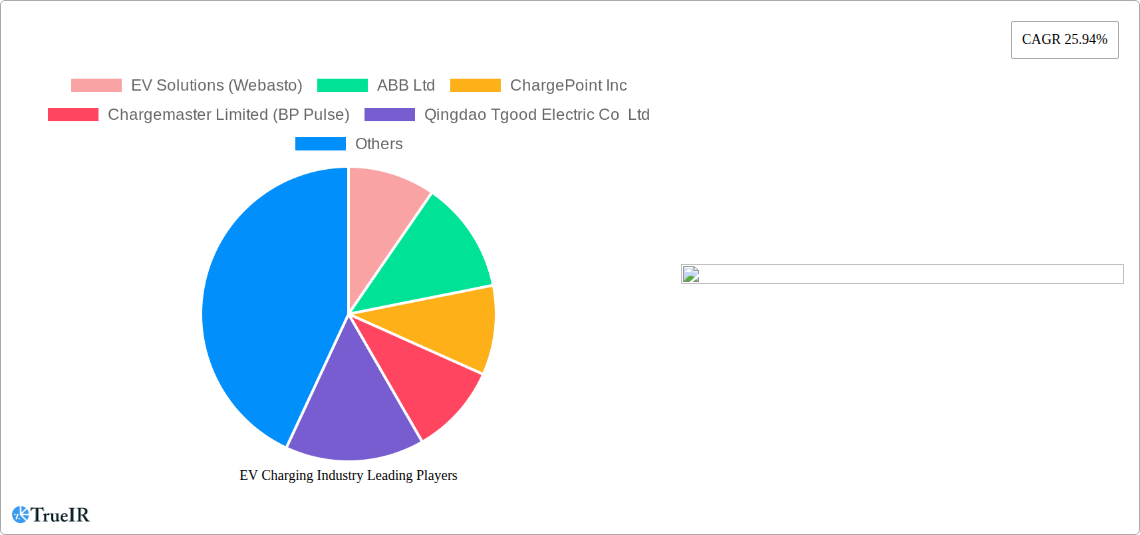
EV Charging Industry Company Market Share
Dynamic Report: EV Charging Industry Market Analysis (2019-2033)
This comprehensive report delivers an in-depth analysis of the burgeoning EV charging industry, projecting a market valued at $XX Million by 2033. It provides crucial insights for investors, industry players, and policymakers navigating this rapidly evolving landscape. Leveraging extensive market research and incorporating recent industry developments, this report offers a detailed forecast, identifying key growth drivers, challenges, and opportunities within various segments. The report covers the historical period (2019-2024), base year (2025), and forecast period (2025-2033), offering a complete understanding of market dynamics.
EV Charging Industry Market Structure & Competitive Landscape
The global EV charging market is characterized by a moderately concentrated landscape with several key players vying for market share. The Herfindahl-Hirschman Index (HHI) is estimated at xx, indicating a moderately competitive market. However, the market is experiencing dynamic shifts due to continuous innovation, strategic mergers and acquisitions (M&A), and evolving regulatory landscapes. Innovation is driven by the need for faster charging speeds, improved grid integration, and enhanced user experience. Government regulations play a crucial role in shaping market growth, with many countries implementing policies to incentivize EV adoption and infrastructure deployment. While the current market is dominated by AC charging stations, there’s a noticeable shift toward DC fast charging stations to address range anxiety.
- Market Concentration: HHI estimated at xx (2025).
- Innovation Drivers: Faster charging technologies, smart grid integration, improved battery management systems.
- Regulatory Impacts: Government subsidies, emission regulations, grid connection standards.
- Product Substitutes: Alternative fuel vehicles (AFVs), improved battery technology extending range.
- End-User Segmentation: Residential, commercial, public, fleet operators.
- M&A Trends: Significant M&A activity observed in recent years, with an estimated xx Million USD in deal value (2019-2024). The consolidation is expected to continue, leading to further market concentration.
EV Charging Industry Market Trends & Opportunities
The global EV charging market is experiencing exponential growth, projected to reach $XX Million by 2033, with a Compound Annual Growth Rate (CAGR) of xx% during the forecast period (2025-2033). This growth is fueled by several factors including rising EV sales, supportive government policies, increasing consumer awareness of environmental concerns, and advancements in charging technology. Technological advancements such as the introduction of ultra-fast charging stations and Vehicle-to-Grid (V2G) technology are opening up new avenues for market expansion. Consumer preference is shifting towards convenient, reliable, and fast charging solutions, creating opportunities for companies that can provide such services. The competitive landscape is intensifying, with established players and new entrants vying for market share. Market penetration of EV charging stations is steadily increasing, particularly in urban areas and along major transportation corridors.
Dominant Markets & Segments in EV Charging Industry
The dominant market segments are largely shaped by the level of EV adoption and government support. Currently, the markets in North America, Europe, and China are the leading regions for EV charging infrastructure deployment. Within these regions, densely populated urban areas and regions with strong government support are experiencing the fastest growth. Analyzing the various segments reveals the following:
- By Charger Type: DC fast charging is experiencing the highest growth due to its speed and convenience. AC charging remains dominant in the residential sector.
- By Charging Ownership Type: Public charging is witnessing rapid expansion due to increasing demand for on-the-go charging. Private charging is primarily driven by residential installations.
- By Charging Service Type: EV charging services account for the major share, with Battery Swapping Services emerging as a niche but growing segment.
- By Charging Infrastructure Type: CCS and GB/T standards are emerging as dominant charging protocols, while Tesla Superchargers maintain a significant market share.
- By Vehicle Type: Passenger cars currently dominate the market, but the commercial vehicle segment is projected to experience significant growth.
Key Growth Drivers:
- Expanding EV adoption rates.
- Government incentives and policies supporting EV charging infrastructure.
- Increasing investments in renewable energy sources to power charging stations.
- Technological advancements in charging speeds and efficiency.
EV Charging Industry Product Analysis
The EV charging market showcases a diverse range of products, from basic AC chargers to high-power DC fast chargers. Key innovations focus on improving charging speeds, optimizing grid integration, and enhancing user experience through smart charging technologies and mobile applications. These advancements cater to the evolving needs of EV users, and offer competitive advantages by providing faster, more reliable, and user-friendly charging solutions. The market is witnessing a shift toward modular and scalable charging systems, allowing for flexible upgrades and adaptation to future needs.
Key Drivers, Barriers & Challenges in EV Charging Industry
Key Drivers:
- Increasing demand for EVs driven by environmental concerns and government regulations.
- Technological advancements in battery technology and charging infrastructure.
- Government incentives and policies promoting EV adoption and charging infrastructure deployment.
- Growing investments in renewable energy sources for powering charging stations.
Key Challenges:
- High initial investment costs for infrastructure development.
- Interoperability issues between different charging standards.
- Grid capacity limitations and the need for grid upgrades.
- Lack of standardized charging protocols and regulations across regions.
- Supply chain disruptions impacting the availability of critical components. This has led to an estimated xx% increase in charging station costs in some regions (2022-2023).
Growth Drivers in the EV Charging Industry Market
The market's growth is fueled by a confluence of factors: the surge in EV sales globally, government support through subsidies and tax credits, the increasing awareness of environmental issues, and the continuous development of more efficient and faster charging technologies. Additionally, the integration of renewable energy sources into the charging infrastructure is gaining momentum, further enhancing the appeal and sustainability of electric vehicles.
Challenges Impacting EV Charging Industry Growth
Significant hurdles hinder industry growth. High initial investment costs for charging station installations are a major impediment, especially in developing countries. Interoperability problems across differing charging standards impede seamless charging experiences. Further, grid infrastructure limitations and the need for upgrades pose a major obstacle, especially in areas with limited electricity capacity. Regulatory uncertainty and lack of standardization also create significant challenges.
Key Players Shaping the EV Charging Industry Market
- EV Solutions (Webasto)
- ABB Ltd
- ChargePoint Inc
- Chargemaster Limited (BP Pulse)
- Qingdao Tgood Electric Co Ltd
- Leviton Manufacturing Co Inc
- BYD Company
- Siemens AG
- Schneider Electric SE
- EFACEC Power Solutions SGPS
- Evbox (ENGIE)
- Wanbang Digital Energy Pte Ltd (Star Charge)
- Tesla Motors Inc
- SemaConnect Inc
- The Newmotion BV (Acquired by Shell)
Significant EV Charging Industry Industry Milestones
- June 2023: Stellantis launched Free2move Charge, a comprehensive EV charging ecosystem.
- June 2023: Circontrol introduced the Genion One, enabling 100% green energy EV charging.
- June 2023: EVBox unveiled the EVBox Troniq High Power, a 400 kW charging station.
- March 2023: 7-Eleven launched 7Charge, its proprietary EV charging network.
Future Outlook for EV Charging Industry Market
The future of the EV charging industry is bright, driven by a confluence of factors: accelerating EV adoption, government policies promoting clean transportation, technological advancements in charging infrastructure, and growing investments in renewable energy. The market is poised for significant expansion, with substantial opportunities for companies offering innovative, user-friendly, and sustainable charging solutions. The integration of smart grid technologies and the development of V2G capabilities will further enhance the efficiency and sustainability of the EV charging ecosystem.
EV Charging Industry Segmentation
-
1. Vehicle Type
- 1.1. Passenger Cars
- 1.2. Commercial Vehicles
-
2. Charger Type
- 2.1. AC Charging Station
- 2.2. DC Charging Station
-
3. Charging Ownership Type
- 3.1. Public
- 3.2. Private
-
4. Charging Service Type
- 4.1. EV Charging Services
- 4.2. Battery Swapping Services
-
5. Charging Infrastructure Type
- 5.1. Chademo
- 5.2. CCS
- 5.3. GB/T Fast Charge
- 5.4. Tesla Superchargers
- 5.5. Other Charging Infrastructure Types
EV Charging Industry Segmentation By Geography
-
1. North America
- 1.1. United States
- 1.2. Canada
- 1.3. Rest of North America
-
2. Europe
- 2.1. Germany
- 2.2. United Kingdom
- 2.3. France
- 2.4. Italy
- 2.5. Rest of Europe
-
3. Asia Pacific
- 3.1. China
- 3.2. Japan
- 3.3. India
- 3.4. South Korea
- 3.5. Rest of Asia Pacific
-
4. Rest of the World
- 4.1. South America
- 4.2. Middle East and Africa
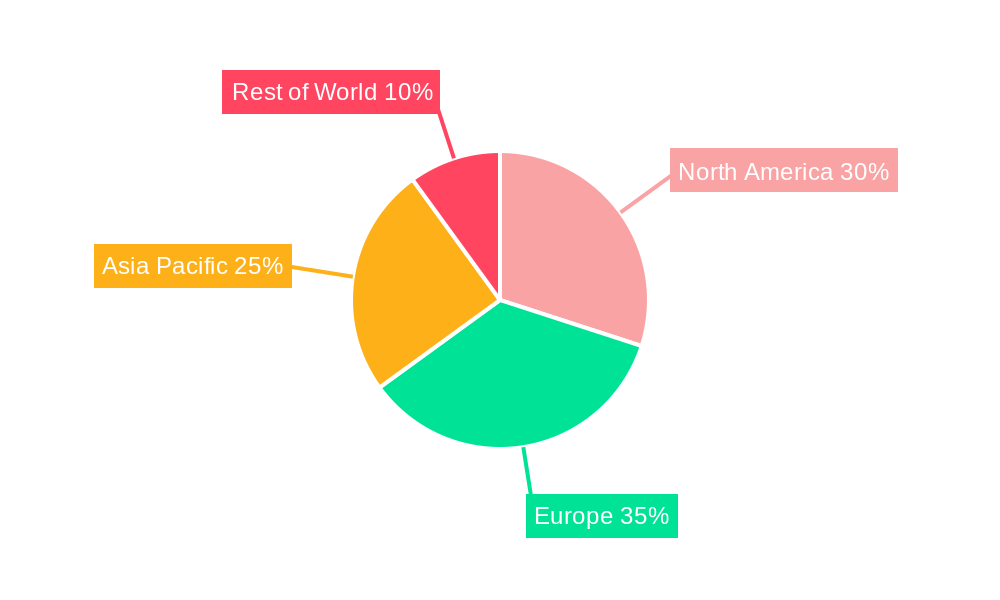
EV Charging Industry Regional Market Share
Geographic Coverage of EV Charging Industry
EV Charging Industry REPORT HIGHLIGHTS
| Aspects | Details |
|---|---|
| Study Period | 2020-2034 |
| Base Year | 2025 |
| Estimated Year | 2026 |
| Forecast Period | 2026-2034 |
| Historical Period | 2020-2025 |
| Growth Rate | CAGR of 25.94% from 2020-2034 |
| Segmentation |
|
Table of Contents
- 1. Introduction
- 1.1. Research Scope
- 1.2. Market Segmentation
- 1.3. Research Objective
- 1.4. Definitions and Assumptions
- 2. Executive Summary
- 2.1. Market Snapshot
- 3. Market Dynamics
- 3.1. Market Drivers
- 3.2. Market Restrains
- 3.3. Market Trends
- 3.4. Market Opportunities
- 4. Market Factor Analysis
- 4.1. Porters Five Forces
- 4.1.1. Bargaining Power of Suppliers
- 4.1.2. Bargaining Power of Buyers
- 4.1.3. Threat of New Entrants
- 4.1.4. Threat of Substitutes
- 4.1.5. Competitive Rivalry
- 4.2. PESTEL analysis
- 4.3. BCG Analysis
- 4.3.1. Stars (High Growth, High Market Share)
- 4.3.2. Cash Cows (Low Growth, High Market Share)
- 4.3.3. Question Mark (High Growth, Low Market Share)
- 4.3.4. Dogs (Low Growth, Low Market Share)
- 4.4. Ansoff Matrix Analysis
- 4.5. Supply Chain Analysis
- 4.6. Regulatory Landscape
- 4.7. Current Market Potential and Opportunity Assessment (TAM–SAM–SOM Framework)
- 4.8. TIR Analyst Note
- 4.1. Porters Five Forces
- 5. Market Analysis, Insights and Forecast 2021-2033
- 5.1. Market Analysis, Insights and Forecast - by Vehicle Type
- 5.1.1. Passenger Cars
- 5.1.2. Commercial Vehicles
- 5.2. Market Analysis, Insights and Forecast - by Charger Type
- 5.2.1. AC Charging Station
- 5.2.2. DC Charging Station
- 5.3. Market Analysis, Insights and Forecast - by Charging Ownership Type
- 5.3.1. Public
- 5.3.2. Private
- 5.4. Market Analysis, Insights and Forecast - by Charging Service Type
- 5.4.1. EV Charging Services
- 5.4.2. Battery Swapping Services
- 5.5. Market Analysis, Insights and Forecast - by Charging Infrastructure Type
- 5.5.1. Chademo
- 5.5.2. CCS
- 5.5.3. GB/T Fast Charge
- 5.5.4. Tesla Superchargers
- 5.5.5. Other Charging Infrastructure Types
- 5.6. Market Analysis, Insights and Forecast - by Region
- 5.6.1. North America
- 5.6.2. Europe
- 5.6.3. Asia Pacific
- 5.6.4. Rest of the World
- 5.1. Market Analysis, Insights and Forecast - by Vehicle Type
- 6. Global EV Charging Industry Analysis, Insights and Forecast, 2021-2033
- 6.1. Market Analysis, Insights and Forecast - by Vehicle Type
- 6.1.1. Passenger Cars
- 6.1.2. Commercial Vehicles
- 6.2. Market Analysis, Insights and Forecast - by Charger Type
- 6.2.1. AC Charging Station
- 6.2.2. DC Charging Station
- 6.3. Market Analysis, Insights and Forecast - by Charging Ownership Type
- 6.3.1. Public
- 6.3.2. Private
- 6.4. Market Analysis, Insights and Forecast - by Charging Service Type
- 6.4.1. EV Charging Services
- 6.4.2. Battery Swapping Services
- 6.5. Market Analysis, Insights and Forecast - by Charging Infrastructure Type
- 6.5.1. Chademo
- 6.5.2. CCS
- 6.5.3. GB/T Fast Charge
- 6.5.4. Tesla Superchargers
- 6.5.5. Other Charging Infrastructure Types
- 6.1. Market Analysis, Insights and Forecast - by Vehicle Type
- 7. North America EV Charging Industry Analysis, Insights and Forecast, 2020-2032
- 7.1. Market Analysis, Insights and Forecast - by Vehicle Type
- 7.1.1. Passenger Cars
- 7.1.2. Commercial Vehicles
- 7.2. Market Analysis, Insights and Forecast - by Charger Type
- 7.2.1. AC Charging Station
- 7.2.2. DC Charging Station
- 7.3. Market Analysis, Insights and Forecast - by Charging Ownership Type
- 7.3.1. Public
- 7.3.2. Private
- 7.4. Market Analysis, Insights and Forecast - by Charging Service Type
- 7.4.1. EV Charging Services
- 7.4.2. Battery Swapping Services
- 7.5. Market Analysis, Insights and Forecast - by Charging Infrastructure Type
- 7.5.1. Chademo
- 7.5.2. CCS
- 7.5.3. GB/T Fast Charge
- 7.5.4. Tesla Superchargers
- 7.5.5. Other Charging Infrastructure Types
- 7.1. Market Analysis, Insights and Forecast - by Vehicle Type
- 8. Europe EV Charging Industry Analysis, Insights and Forecast, 2020-2032
- 8.1. Market Analysis, Insights and Forecast - by Vehicle Type
- 8.1.1. Passenger Cars
- 8.1.2. Commercial Vehicles
- 8.2. Market Analysis, Insights and Forecast - by Charger Type
- 8.2.1. AC Charging Station
- 8.2.2. DC Charging Station
- 8.3. Market Analysis, Insights and Forecast - by Charging Ownership Type
- 8.3.1. Public
- 8.3.2. Private
- 8.4. Market Analysis, Insights and Forecast - by Charging Service Type
- 8.4.1. EV Charging Services
- 8.4.2. Battery Swapping Services
- 8.5. Market Analysis, Insights and Forecast - by Charging Infrastructure Type
- 8.5.1. Chademo
- 8.5.2. CCS
- 8.5.3. GB/T Fast Charge
- 8.5.4. Tesla Superchargers
- 8.5.5. Other Charging Infrastructure Types
- 8.1. Market Analysis, Insights and Forecast - by Vehicle Type
- 9. Asia Pacific EV Charging Industry Analysis, Insights and Forecast, 2020-2032
- 9.1. Market Analysis, Insights and Forecast - by Vehicle Type
- 9.1.1. Passenger Cars
- 9.1.2. Commercial Vehicles
- 9.2. Market Analysis, Insights and Forecast - by Charger Type
- 9.2.1. AC Charging Station
- 9.2.2. DC Charging Station
- 9.3. Market Analysis, Insights and Forecast - by Charging Ownership Type
- 9.3.1. Public
- 9.3.2. Private
- 9.4. Market Analysis, Insights and Forecast - by Charging Service Type
- 9.4.1. EV Charging Services
- 9.4.2. Battery Swapping Services
- 9.5. Market Analysis, Insights and Forecast - by Charging Infrastructure Type
- 9.5.1. Chademo
- 9.5.2. CCS
- 9.5.3. GB/T Fast Charge
- 9.5.4. Tesla Superchargers
- 9.5.5. Other Charging Infrastructure Types
- 9.1. Market Analysis, Insights and Forecast - by Vehicle Type
- 10. Rest of the World EV Charging Industry Analysis, Insights and Forecast, 2020-2032
- 10.1. Market Analysis, Insights and Forecast - by Vehicle Type
- 10.1.1. Passenger Cars
- 10.1.2. Commercial Vehicles
- 10.2. Market Analysis, Insights and Forecast - by Charger Type
- 10.2.1. AC Charging Station
- 10.2.2. DC Charging Station
- 10.3. Market Analysis, Insights and Forecast - by Charging Ownership Type
- 10.3.1. Public
- 10.3.2. Private
- 10.4. Market Analysis, Insights and Forecast - by Charging Service Type
- 10.4.1. EV Charging Services
- 10.4.2. Battery Swapping Services
- 10.5. Market Analysis, Insights and Forecast - by Charging Infrastructure Type
- 10.5.1. Chademo
- 10.5.2. CCS
- 10.5.3. GB/T Fast Charge
- 10.5.4. Tesla Superchargers
- 10.5.5. Other Charging Infrastructure Types
- 10.1. Market Analysis, Insights and Forecast - by Vehicle Type
- 11. Competitive Analysis
- 11.1. Company Profiles
- 11.1.1 EV Solutions (Webasto)
- 11.1.1.1. Company Overview
- 11.1.1.2. Products
- 11.1.1.3. Company Financials
- 11.1.1.4. SWOT Analysis
- 11.1.2 ABB Ltd
- 11.1.2.1. Company Overview
- 11.1.2.2. Products
- 11.1.2.3. Company Financials
- 11.1.2.4. SWOT Analysis
- 11.1.3 ChargePoint Inc
- 11.1.3.1. Company Overview
- 11.1.3.2. Products
- 11.1.3.3. Company Financials
- 11.1.3.4. SWOT Analysis
- 11.1.4 Chargemaster Limited (BP Pulse)
- 11.1.4.1. Company Overview
- 11.1.4.2. Products
- 11.1.4.3. Company Financials
- 11.1.4.4. SWOT Analysis
- 11.1.5 Qingdao Tgood Electric Co Ltd
- 11.1.5.1. Company Overview
- 11.1.5.2. Products
- 11.1.5.3. Company Financials
- 11.1.5.4. SWOT Analysis
- 11.1.6 Leviton Manufacturing Co Inc
- 11.1.6.1. Company Overview
- 11.1.6.2. Products
- 11.1.6.3. Company Financials
- 11.1.6.4. SWOT Analysis
- 11.1.7 BYD Company
- 11.1.7.1. Company Overview
- 11.1.7.2. Products
- 11.1.7.3. Company Financials
- 11.1.7.4. SWOT Analysis
- 11.1.8 Siemens AG
- 11.1.8.1. Company Overview
- 11.1.8.2. Products
- 11.1.8.3. Company Financials
- 11.1.8.4. SWOT Analysis
- 11.1.9 Schneider Electric SE
- 11.1.9.1. Company Overview
- 11.1.9.2. Products
- 11.1.9.3. Company Financials
- 11.1.9.4. SWOT Analysis
- 11.1.10 EFACEC Power Solutions SGPS
- 11.1.10.1. Company Overview
- 11.1.10.2. Products
- 11.1.10.3. Company Financials
- 11.1.10.4. SWOT Analysis
- 11.1.11 Evbox (ENGIE)
- 11.1.11.1. Company Overview
- 11.1.11.2. Products
- 11.1.11.3. Company Financials
- 11.1.11.4. SWOT Analysis
- 11.1.12 Wanbang Digital Energy Pte Ltd (Star Charge
- 11.1.12.1. Company Overview
- 11.1.12.2. Products
- 11.1.12.3. Company Financials
- 11.1.12.4. SWOT Analysis
- 11.1.13 Tesla Motors Inc
- 11.1.13.1. Company Overview
- 11.1.13.2. Products
- 11.1.13.3. Company Financials
- 11.1.13.4. SWOT Analysis
- 11.1.14 SemaConnect Inc
- 11.1.14.1. Company Overview
- 11.1.14.2. Products
- 11.1.14.3. Company Financials
- 11.1.14.4. SWOT Analysis
- 11.1.15 The Newmotion BV (Acquired by Shell)
- 11.1.15.1. Company Overview
- 11.1.15.2. Products
- 11.1.15.3. Company Financials
- 11.1.15.4. SWOT Analysis
- 11.1.1 EV Solutions (Webasto)
- 11.2. Market Entropy
- 11.2.1 Company's Key Areas Served
- 11.2.2 Recent Developments
- 11.3. Company Market Share Analysis 2025
- 11.3.1 Top 5 Companies Market Share Analysis
- 11.3.2 Top 3 Companies Market Share Analysis
- 11.4. List of Potential Customers
- 12. Research Methodology
List of Figures
- Figure 1: Global EV Charging Industry Revenue Breakdown (Million, %) by Region 2025 & 2033
- Figure 2: North America EV Charging Industry Revenue (Million), by Vehicle Type 2025 & 2033
- Figure 3: North America EV Charging Industry Revenue Share (%), by Vehicle Type 2025 & 2033
- Figure 4: North America EV Charging Industry Revenue (Million), by Charger Type 2025 & 2033
- Figure 5: North America EV Charging Industry Revenue Share (%), by Charger Type 2025 & 2033
- Figure 6: North America EV Charging Industry Revenue (Million), by Charging Ownership Type 2025 & 2033
- Figure 7: North America EV Charging Industry Revenue Share (%), by Charging Ownership Type 2025 & 2033
- Figure 8: North America EV Charging Industry Revenue (Million), by Charging Service Type 2025 & 2033
- Figure 9: North America EV Charging Industry Revenue Share (%), by Charging Service Type 2025 & 2033
- Figure 10: North America EV Charging Industry Revenue (Million), by Charging Infrastructure Type 2025 & 2033
- Figure 11: North America EV Charging Industry Revenue Share (%), by Charging Infrastructure Type 2025 & 2033
- Figure 12: North America EV Charging Industry Revenue (Million), by Country 2025 & 2033
- Figure 13: North America EV Charging Industry Revenue Share (%), by Country 2025 & 2033
- Figure 14: Europe EV Charging Industry Revenue (Million), by Vehicle Type 2025 & 2033
- Figure 15: Europe EV Charging Industry Revenue Share (%), by Vehicle Type 2025 & 2033
- Figure 16: Europe EV Charging Industry Revenue (Million), by Charger Type 2025 & 2033
- Figure 17: Europe EV Charging Industry Revenue Share (%), by Charger Type 2025 & 2033
- Figure 18: Europe EV Charging Industry Revenue (Million), by Charging Ownership Type 2025 & 2033
- Figure 19: Europe EV Charging Industry Revenue Share (%), by Charging Ownership Type 2025 & 2033
- Figure 20: Europe EV Charging Industry Revenue (Million), by Charging Service Type 2025 & 2033
- Figure 21: Europe EV Charging Industry Revenue Share (%), by Charging Service Type 2025 & 2033
- Figure 22: Europe EV Charging Industry Revenue (Million), by Charging Infrastructure Type 2025 & 2033
- Figure 23: Europe EV Charging Industry Revenue Share (%), by Charging Infrastructure Type 2025 & 2033
- Figure 24: Europe EV Charging Industry Revenue (Million), by Country 2025 & 2033
- Figure 25: Europe EV Charging Industry Revenue Share (%), by Country 2025 & 2033
- Figure 26: Asia Pacific EV Charging Industry Revenue (Million), by Vehicle Type 2025 & 2033
- Figure 27: Asia Pacific EV Charging Industry Revenue Share (%), by Vehicle Type 2025 & 2033
- Figure 28: Asia Pacific EV Charging Industry Revenue (Million), by Charger Type 2025 & 2033
- Figure 29: Asia Pacific EV Charging Industry Revenue Share (%), by Charger Type 2025 & 2033
- Figure 30: Asia Pacific EV Charging Industry Revenue (Million), by Charging Ownership Type 2025 & 2033
- Figure 31: Asia Pacific EV Charging Industry Revenue Share (%), by Charging Ownership Type 2025 & 2033
- Figure 32: Asia Pacific EV Charging Industry Revenue (Million), by Charging Service Type 2025 & 2033
- Figure 33: Asia Pacific EV Charging Industry Revenue Share (%), by Charging Service Type 2025 & 2033
- Figure 34: Asia Pacific EV Charging Industry Revenue (Million), by Charging Infrastructure Type 2025 & 2033
- Figure 35: Asia Pacific EV Charging Industry Revenue Share (%), by Charging Infrastructure Type 2025 & 2033
- Figure 36: Asia Pacific EV Charging Industry Revenue (Million), by Country 2025 & 2033
- Figure 37: Asia Pacific EV Charging Industry Revenue Share (%), by Country 2025 & 2033
- Figure 38: Rest of the World EV Charging Industry Revenue (Million), by Vehicle Type 2025 & 2033
- Figure 39: Rest of the World EV Charging Industry Revenue Share (%), by Vehicle Type 2025 & 2033
- Figure 40: Rest of the World EV Charging Industry Revenue (Million), by Charger Type 2025 & 2033
- Figure 41: Rest of the World EV Charging Industry Revenue Share (%), by Charger Type 2025 & 2033
- Figure 42: Rest of the World EV Charging Industry Revenue (Million), by Charging Ownership Type 2025 & 2033
- Figure 43: Rest of the World EV Charging Industry Revenue Share (%), by Charging Ownership Type 2025 & 2033
- Figure 44: Rest of the World EV Charging Industry Revenue (Million), by Charging Service Type 2025 & 2033
- Figure 45: Rest of the World EV Charging Industry Revenue Share (%), by Charging Service Type 2025 & 2033
- Figure 46: Rest of the World EV Charging Industry Revenue (Million), by Charging Infrastructure Type 2025 & 2033
- Figure 47: Rest of the World EV Charging Industry Revenue Share (%), by Charging Infrastructure Type 2025 & 2033
- Figure 48: Rest of the World EV Charging Industry Revenue (Million), by Country 2025 & 2033
- Figure 49: Rest of the World EV Charging Industry Revenue Share (%), by Country 2025 & 2033
List of Tables
- Table 1: Global EV Charging Industry Revenue Million Forecast, by Vehicle Type 2020 & 2033
- Table 2: Global EV Charging Industry Revenue Million Forecast, by Charger Type 2020 & 2033
- Table 3: Global EV Charging Industry Revenue Million Forecast, by Charging Ownership Type 2020 & 2033
- Table 4: Global EV Charging Industry Revenue Million Forecast, by Charging Service Type 2020 & 2033
- Table 5: Global EV Charging Industry Revenue Million Forecast, by Charging Infrastructure Type 2020 & 2033
- Table 6: Global EV Charging Industry Revenue Million Forecast, by Region 2020 & 2033
- Table 7: Global EV Charging Industry Revenue Million Forecast, by Vehicle Type 2020 & 2033
- Table 8: Global EV Charging Industry Revenue Million Forecast, by Charger Type 2020 & 2033
- Table 9: Global EV Charging Industry Revenue Million Forecast, by Charging Ownership Type 2020 & 2033
- Table 10: Global EV Charging Industry Revenue Million Forecast, by Charging Service Type 2020 & 2033
- Table 11: Global EV Charging Industry Revenue Million Forecast, by Charging Infrastructure Type 2020 & 2033
- Table 12: Global EV Charging Industry Revenue Million Forecast, by Country 2020 & 2033
- Table 13: United States EV Charging Industry Revenue (Million) Forecast, by Application 2020 & 2033
- Table 14: Canada EV Charging Industry Revenue (Million) Forecast, by Application 2020 & 2033
- Table 15: Rest of North America EV Charging Industry Revenue (Million) Forecast, by Application 2020 & 2033
- Table 16: Global EV Charging Industry Revenue Million Forecast, by Vehicle Type 2020 & 2033
- Table 17: Global EV Charging Industry Revenue Million Forecast, by Charger Type 2020 & 2033
- Table 18: Global EV Charging Industry Revenue Million Forecast, by Charging Ownership Type 2020 & 2033
- Table 19: Global EV Charging Industry Revenue Million Forecast, by Charging Service Type 2020 & 2033
- Table 20: Global EV Charging Industry Revenue Million Forecast, by Charging Infrastructure Type 2020 & 2033
- Table 21: Global EV Charging Industry Revenue Million Forecast, by Country 2020 & 2033
- Table 22: Germany EV Charging Industry Revenue (Million) Forecast, by Application 2020 & 2033
- Table 23: United Kingdom EV Charging Industry Revenue (Million) Forecast, by Application 2020 & 2033
- Table 24: France EV Charging Industry Revenue (Million) Forecast, by Application 2020 & 2033
- Table 25: Italy EV Charging Industry Revenue (Million) Forecast, by Application 2020 & 2033
- Table 26: Rest of Europe EV Charging Industry Revenue (Million) Forecast, by Application 2020 & 2033
- Table 27: Global EV Charging Industry Revenue Million Forecast, by Vehicle Type 2020 & 2033
- Table 28: Global EV Charging Industry Revenue Million Forecast, by Charger Type 2020 & 2033
- Table 29: Global EV Charging Industry Revenue Million Forecast, by Charging Ownership Type 2020 & 2033
- Table 30: Global EV Charging Industry Revenue Million Forecast, by Charging Service Type 2020 & 2033
- Table 31: Global EV Charging Industry Revenue Million Forecast, by Charging Infrastructure Type 2020 & 2033
- Table 32: Global EV Charging Industry Revenue Million Forecast, by Country 2020 & 2033
- Table 33: China EV Charging Industry Revenue (Million) Forecast, by Application 2020 & 2033
- Table 34: Japan EV Charging Industry Revenue (Million) Forecast, by Application 2020 & 2033
- Table 35: India EV Charging Industry Revenue (Million) Forecast, by Application 2020 & 2033
- Table 36: South Korea EV Charging Industry Revenue (Million) Forecast, by Application 2020 & 2033
- Table 37: Rest of Asia Pacific EV Charging Industry Revenue (Million) Forecast, by Application 2020 & 2033
- Table 38: Global EV Charging Industry Revenue Million Forecast, by Vehicle Type 2020 & 2033
- Table 39: Global EV Charging Industry Revenue Million Forecast, by Charger Type 2020 & 2033
- Table 40: Global EV Charging Industry Revenue Million Forecast, by Charging Ownership Type 2020 & 2033
- Table 41: Global EV Charging Industry Revenue Million Forecast, by Charging Service Type 2020 & 2033
- Table 42: Global EV Charging Industry Revenue Million Forecast, by Charging Infrastructure Type 2020 & 2033
- Table 43: Global EV Charging Industry Revenue Million Forecast, by Country 2020 & 2033
- Table 44: South America EV Charging Industry Revenue (Million) Forecast, by Application 2020 & 2033
- Table 45: Middle East and Africa EV Charging Industry Revenue (Million) Forecast, by Application 2020 & 2033
Frequently Asked Questions
1. What is the projected Compound Annual Growth Rate (CAGR) of the EV Charging Industry?
The projected CAGR is approximately 25.94%.
2. Which companies are prominent players in the EV Charging Industry?
Key companies in the market include EV Solutions (Webasto), ABB Ltd, ChargePoint Inc, Chargemaster Limited (BP Pulse), Qingdao Tgood Electric Co Ltd, Leviton Manufacturing Co Inc, BYD Company, Siemens AG, Schneider Electric SE, EFACEC Power Solutions SGPS, Evbox (ENGIE), Wanbang Digital Energy Pte Ltd (Star Charge, Tesla Motors Inc, SemaConnect Inc, The Newmotion BV (Acquired by Shell).
3. What are the main segments of the EV Charging Industry?
The market segments include Vehicle Type, Charger Type, Charging Ownership Type, Charging Service Type, Charging Infrastructure Type.
4. Can you provide details about the market size?
The market size is estimated to be USD 32.86 Million as of 2022.
5. What are some drivers contributing to market growth?
Rising EV Sales and Decreasing EV Prices are Driving the Market.
6. What are the notable trends driving market growth?
Passenger Cars are Leading the Electric Vehicle Charging Station Market.
7. Are there any restraints impacting market growth?
High Initial Cost of Installing and Maintaining a Standard EV Charging Station is a Challenge.
8. Can you provide examples of recent developments in the market?
June 2023: Stellantis introduced Free2move Charge, a comprehensive ecosystem that provides seamless charging and energy management solutions for electric vehicle (EV) customers. This holistic approach caters to EV needs across various scenarios, including home charging, business charging, and on-the-go charging. The initiative is overseen by the newly established Stellantis Charging & Energy Business Unit, emphasizing Stellantis’s commitment to supporting the growing EV market.
9. What pricing options are available for accessing the report?
Pricing options include single-user, multi-user, and enterprise licenses priced at USD 4750, USD 5250, and USD 8750 respectively.
10. Is the market size provided in terms of value or volume?
The market size is provided in terms of value, measured in Million.
11. Are there any specific market keywords associated with the report?
Yes, the market keyword associated with the report is "EV Charging Industry," which aids in identifying and referencing the specific market segment covered.
12. How do I determine which pricing option suits my needs best?
The pricing options vary based on user requirements and access needs. Individual users may opt for single-user licenses, while businesses requiring broader access may choose multi-user or enterprise licenses for cost-effective access to the report.
13. Are there any additional resources or data provided in the EV Charging Industry report?
While the report offers comprehensive insights, it's advisable to review the specific contents or supplementary materials provided to ascertain if additional resources or data are available.
14. How can I stay updated on further developments or reports in the EV Charging Industry?
To stay informed about further developments, trends, and reports in the EV Charging Industry, consider subscribing to industry newsletters, following relevant companies and organizations, or regularly checking reputable industry news sources and publications.
Methodology
Step 1 - Identification of Relevant Samples Size from Population Database


Step 2 - Approaches for Defining Global Market Size (Value, Volume* & Price*)

Note*: In applicable scenarios
Step 3 - Data Sources
Primary Research
- Web Analytics
- Survey Reports
- Research Institute
- Latest Research Reports
- Opinion Leaders
Secondary Research
- Annual Reports
- White Paper
- Latest Press Release
- Industry Association
- Paid Database
- Investor Presentations

Step 4 - Data Triangulation
Involves using different sources of information in order to increase the validity of a study
These sources are likely to be stakeholders in a program - participants, other researchers, program staff, other community members, and so on.
Then we put all data in single framework & apply various statistical tools to find out the dynamic on the market.
During the analysis stage, feedback from the stakeholder groups would be compared to determine areas of agreement as well as areas of divergence