

Key Insights
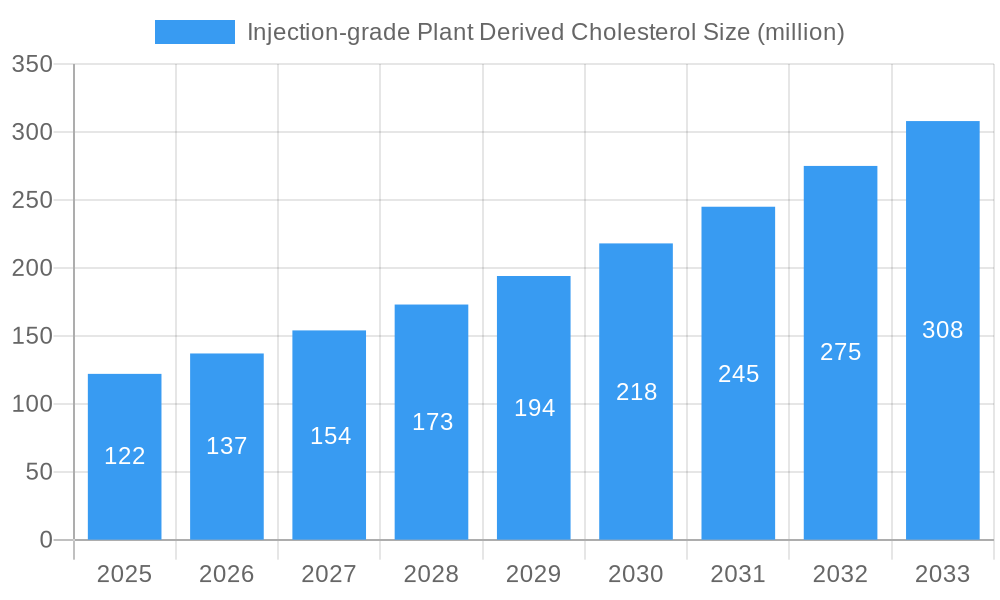
The injection-grade plant-derived cholesterol market, valued at $122 million in 2025, is projected to experience robust growth, driven by increasing demand for bio-based alternatives in pharmaceutical and cosmetic applications. This shift towards plant-derived cholesterol stems from growing consumer preference for natural and sustainable products, coupled with concerns regarding animal-derived cholesterol's variability and potential for contamination. Furthermore, the pharmaceutical industry's focus on developing innovative drug delivery systems and biosimilars is fueling the market's expansion. Key players like Evonik, Merck, and Croda Pharma (Avanti) are actively investing in research and development, enhancing production capabilities to meet the rising global demand. The market's growth is also influenced by technological advancements in extraction and purification techniques, leading to higher-quality plant-derived cholesterol at competitive prices. Stringent regulatory frameworks related to pharmaceutical-grade ingredients, however, could present a challenge, requiring companies to invest in robust quality control measures and regulatory compliance.
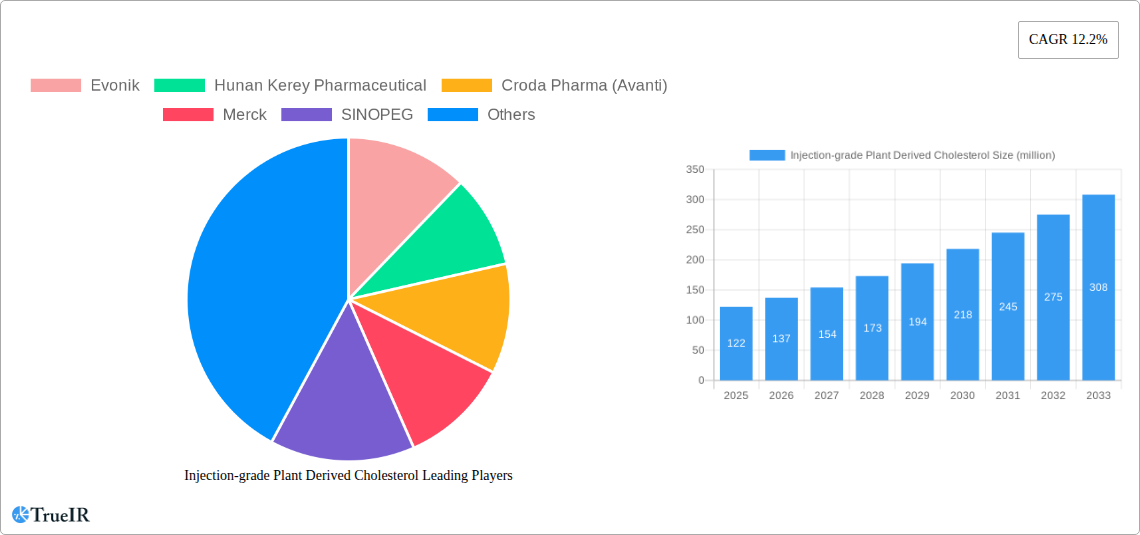
Injection-grade Plant Derived Cholesterol Market Size (In Million)
The market's compound annual growth rate (CAGR) of 12.2% from 2019 to 2033 suggests a significant expansion over the forecast period (2025-2033). This growth is expected to be driven by factors such as the increasing adoption of plant-based ingredients in the pharmaceutical and cosmetic sectors, as well as advancements in upstream and downstream manufacturing processes. While the exact segmentation details are unavailable, it's likely the market is segmented by application (e.g., pharmaceutical excipients, cosmetics), type of cholesterol (e.g., cholesterol, cholesterol derivatives), and geographic region. The competitive landscape, characterized by established players and emerging biotech companies, is expected to remain dynamic, with mergers, acquisitions, and strategic partnerships influencing market dynamics. This competitive environment will further stimulate innovation and potentially lead to price optimization, impacting market growth and penetration.
Injection-grade Plant Derived Cholesterol Company Market Share
Injection-Grade Plant-Derived Cholesterol Market Report: 2019-2033
This comprehensive report provides a detailed analysis of the global injection-grade plant-derived cholesterol market, offering invaluable insights for industry stakeholders, investors, and researchers. Covering the period from 2019 to 2033, with a focus on the estimated year 2025, this report meticulously examines market dynamics, competitive landscapes, and future growth potential. The market is projected to reach xx million by 2033, exhibiting a robust CAGR of xx% during the forecast period (2025-2033).
Injection-grade Plant Derived Cholesterol Market Structure & Competitive Landscape
The injection-grade plant-derived cholesterol market exhibits a moderately concentrated structure, with key players such as Evonik, Hunan Kerey Pharmaceutical, Croda Pharma (Avanti), Merck, SINOPEG, Hunan Furui Biopharma, Biopharma PEG, and IRIS BIOTECH GMBH holding significant market share. The market concentration ratio (CR4) is estimated at xx% in 2025. Innovation in extraction and purification techniques, coupled with increasing demand for bio-based alternatives to animal-derived cholesterol, are driving market growth. Stringent regulatory approvals and potential for product substitution with synthetic alternatives pose challenges. The market is witnessing strategic mergers and acquisitions (M&A) activity, with an estimated xx million in M&A volume in 2024. End-user segmentation includes pharmaceutical companies, research institutions, and contract manufacturers.
- Market Concentration: CR4 estimated at xx% in 2025.
- Innovation Drivers: Advancements in extraction and purification techniques.
- Regulatory Impacts: Stringent regulatory approvals impacting market entry.
- Product Substitutes: Synthetic cholesterol poses a competitive threat.
- End-User Segmentation: Pharmaceutical companies, research institutions, contract manufacturers.
- M&A Trends: xx million in M&A volume in 2024.
Injection-grade Plant Derived Cholesterol Market Trends & Opportunities
The global injection-grade plant-derived cholesterol market is experiencing significant growth, driven by increasing demand for plant-based alternatives in pharmaceutical applications. Technological advancements in extraction and purification processes are enhancing product quality and reducing production costs. Consumer preference for natural and sustainable ingredients is further boosting market expansion. The market is witnessing increased competition, with both established players and new entrants vying for market share. The market size is projected to reach xx million by 2033, with a CAGR of xx% during the forecast period. Market penetration rates are expected to increase significantly, driven by the growing adoption of plant-derived cholesterol in various applications. Significant opportunities exist in emerging markets with a burgeoning pharmaceutical industry.
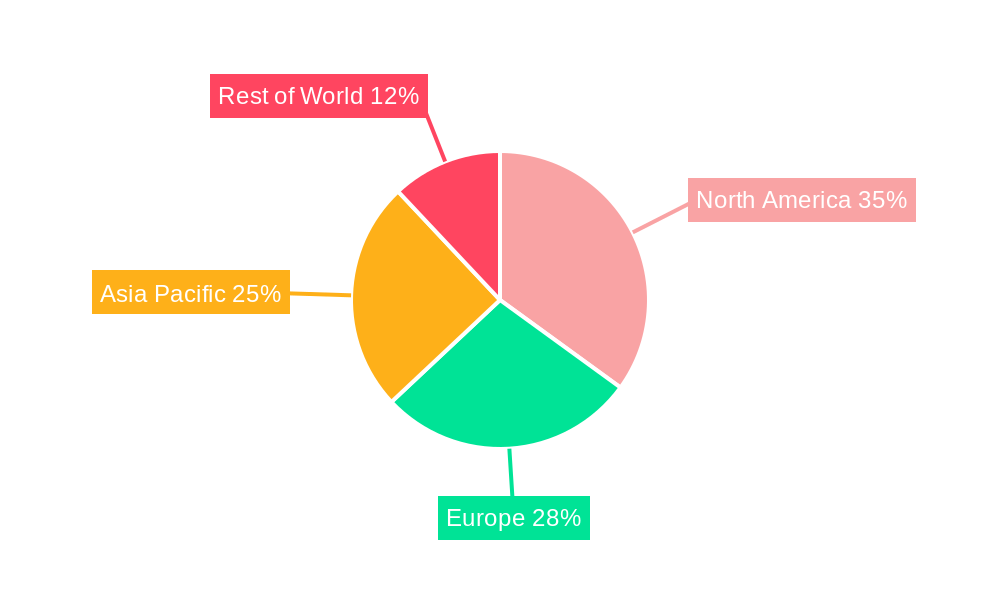
Dominant Markets & Segments in Injection-grade Plant Derived Cholesterol
The North American region currently dominates the injection-grade plant-derived cholesterol market, driven by robust pharmaceutical research and development activities, and stringent regulatory frameworks promoting bio-based alternatives. Europe follows closely, with established pharmaceutical industries and a growing focus on sustainability.
- Key Growth Drivers in North America:
- Strong pharmaceutical R&D activities.
- Favorable regulatory environment for bio-based products.
- High consumer demand for natural and sustainable products.
- Key Growth Drivers in Europe:
- Well-established pharmaceutical industry.
- Increasing focus on sustainability and green chemistry.
- Stringent environmental regulations.
- Asia-Pacific Market Growth: Significant potential, driven by increasing healthcare spending and growing pharmaceutical sector.
Injection-grade Plant Derived Cholesterol Product Analysis
Product innovations focus on enhancing purity, yield, and cost-effectiveness of extraction and purification processes. Applications include drug delivery systems, cholesterol-lowering drugs, and hormone replacement therapies. Competitive advantages stem from superior product quality, cost-effectiveness, and reliable supply chains. Technological advancements such as supercritical fluid extraction and chromatography are improving product quality and reducing production costs, enhancing market competitiveness.
Key Drivers, Barriers & Challenges in Injection-grade Plant Derived Cholesterol
Key Drivers: Growing demand for plant-based alternatives to animal-derived cholesterol, increasing focus on sustainable and ethical sourcing, technological advancements in extraction and purification, and favorable regulatory environments in key markets. For example, the increasing adoption of plant-based cholesterol in pharmaceutical formulations is a significant driver of market growth.
Challenges: High production costs compared to synthetic alternatives, stringent regulatory requirements for pharmaceutical-grade products, and potential supply chain disruptions. The competition from synthetic cholesterol, along with fluctuating raw material prices, poses significant challenges to market growth. Regulatory hurdles and fluctuating raw material prices impact production costs and profitability.
Growth Drivers in the Injection-grade Plant Derived Cholesterol Market
The increasing demand for plant-based alternatives in the pharmaceutical and food industries is a significant growth driver. Technological advancements in extraction and purification methods are reducing costs and improving product quality. Favorable government regulations and initiatives promoting sustainable and ethical sourcing are also positively impacting market growth.
Challenges Impacting Injection-grade Plant Derived Cholesterol Growth
The major challenges are the high production costs compared to synthetic cholesterol, stringent regulatory approvals required for pharmaceutical use, and the potential for supply chain disruptions affecting the availability of raw materials. Competition from synthetic alternatives and price volatility of raw materials further impact market growth.
Key Players Shaping the Injection-grade Plant Derived Cholesterol Market
- Evonik
- Hunan Kerey Pharmaceutical
- Croda Pharma (Avanti)
- Merck
- SINOPEG
- Hunan Furui Biopharma
- Biopharma PEG
- IRIS BIOTECH GMBH
Significant Injection-grade Plant Derived Cholesterol Industry Milestones
- 2020: Evonik launched a new, high-purity plant-derived cholesterol.
- 2021: Croda Pharma (Avanti) expanded its manufacturing capacity for plant-derived cholesterol.
- 2022: Significant investment in R&D announced by several key players.
- 2023: New regulatory guidelines issued regarding the use of plant-derived cholesterol in pharmaceuticals.
Future Outlook for Injection-grade Plant Derived Cholesterol Market
The injection-grade plant-derived cholesterol market is poised for strong growth, driven by increasing demand from the pharmaceutical industry and a growing consumer preference for natural and sustainable ingredients. Strategic partnerships and collaborations among industry players are expected to further fuel market expansion. Emerging markets in Asia-Pacific and Latin America present significant growth opportunities. Continuous advancements in extraction and purification technologies will enhance product quality and competitiveness.
Injection-grade Plant Derived Cholesterol Segmentation
-
1. Application
- 1.1. mRNA Vaccines
- 1.2. Gene Therapy
- 1.3. Cell Culture
- 1.4. Others
-
2. Types
- 2.1. Purity≥98%
- 2.2. Purity≥99%
Injection-grade Plant Derived Cholesterol Segmentation By Geography
-
1. North America
- 1.1. United States
- 1.2. Canada
- 1.3. Mexico
-
2. South America
- 2.1. Brazil
- 2.2. Argentina
- 2.3. Rest of South America
-
3. Europe
- 3.1. United Kingdom
- 3.2. Germany
- 3.3. France
- 3.4. Italy
- 3.5. Spain
- 3.6. Russia
- 3.7. Benelux
- 3.8. Nordics
- 3.9. Rest of Europe
-
4. Middle East & Africa
- 4.1. Turkey
- 4.2. Israel
- 4.3. GCC
- 4.4. North Africa
- 4.5. South Africa
- 4.6. Rest of Middle East & Africa
-
5. Asia Pacific
- 5.1. China
- 5.2. India
- 5.3. Japan
- 5.4. South Korea
- 5.5. ASEAN
- 5.6. Oceania
- 5.7. Rest of Asia Pacific
Injection-grade Plant Derived Cholesterol Regional Market Share
Geographic Coverage of Injection-grade Plant Derived Cholesterol
Injection-grade Plant Derived Cholesterol REPORT HIGHLIGHTS
| Aspects | Details |
|---|---|
| Study Period | 2020-2034 |
| Base Year | 2025 |
| Estimated Year | 2026 |
| Forecast Period | 2026-2034 |
| Historical Period | 2020-2025 |
| Growth Rate | CAGR of 12.2% from 2020-2034 |
| Segmentation |
|
Table of Contents
- 1. Introduction
- 1.1. Research Scope
- 1.2. Market Segmentation
- 1.3. Research Methodology
- 1.4. Definitions and Assumptions
- 2. Executive Summary
- 2.1. Introduction
- 3. Market Dynamics
- 3.1. Introduction
- 3.2. Market Drivers
- 3.3. Market Restrains
- 3.4. Market Trends
- 4. Market Factor Analysis
- 4.1. Porters Five Forces
- 4.2. Supply/Value Chain
- 4.3. PESTEL analysis
- 4.4. Market Entropy
- 4.5. Patent/Trademark Analysis
- 5. Global Injection-grade Plant Derived Cholesterol Analysis, Insights and Forecast, 2020-2032
- 5.1. Market Analysis, Insights and Forecast - by Application
- 5.1.1. mRNA Vaccines
- 5.1.2. Gene Therapy
- 5.1.3. Cell Culture
- 5.1.4. Others
- 5.2. Market Analysis, Insights and Forecast - by Types
- 5.2.1. Purity≥98%
- 5.2.2. Purity≥99%
- 5.3. Market Analysis, Insights and Forecast - by Region
- 5.3.1. North America
- 5.3.2. South America
- 5.3.3. Europe
- 5.3.4. Middle East & Africa
- 5.3.5. Asia Pacific
- 5.1. Market Analysis, Insights and Forecast - by Application
- 6. North America Injection-grade Plant Derived Cholesterol Analysis, Insights and Forecast, 2020-2032
- 6.1. Market Analysis, Insights and Forecast - by Application
- 6.1.1. mRNA Vaccines
- 6.1.2. Gene Therapy
- 6.1.3. Cell Culture
- 6.1.4. Others
- 6.2. Market Analysis, Insights and Forecast - by Types
- 6.2.1. Purity≥98%
- 6.2.2. Purity≥99%
- 6.1. Market Analysis, Insights and Forecast - by Application
- 7. South America Injection-grade Plant Derived Cholesterol Analysis, Insights and Forecast, 2020-2032
- 7.1. Market Analysis, Insights and Forecast - by Application
- 7.1.1. mRNA Vaccines
- 7.1.2. Gene Therapy
- 7.1.3. Cell Culture
- 7.1.4. Others
- 7.2. Market Analysis, Insights and Forecast - by Types
- 7.2.1. Purity≥98%
- 7.2.2. Purity≥99%
- 7.1. Market Analysis, Insights and Forecast - by Application
- 8. Europe Injection-grade Plant Derived Cholesterol Analysis, Insights and Forecast, 2020-2032
- 8.1. Market Analysis, Insights and Forecast - by Application
- 8.1.1. mRNA Vaccines
- 8.1.2. Gene Therapy
- 8.1.3. Cell Culture
- 8.1.4. Others
- 8.2. Market Analysis, Insights and Forecast - by Types
- 8.2.1. Purity≥98%
- 8.2.2. Purity≥99%
- 8.1. Market Analysis, Insights and Forecast - by Application
- 9. Middle East & Africa Injection-grade Plant Derived Cholesterol Analysis, Insights and Forecast, 2020-2032
- 9.1. Market Analysis, Insights and Forecast - by Application
- 9.1.1. mRNA Vaccines
- 9.1.2. Gene Therapy
- 9.1.3. Cell Culture
- 9.1.4. Others
- 9.2. Market Analysis, Insights and Forecast - by Types
- 9.2.1. Purity≥98%
- 9.2.2. Purity≥99%
- 9.1. Market Analysis, Insights and Forecast - by Application
- 10. Asia Pacific Injection-grade Plant Derived Cholesterol Analysis, Insights and Forecast, 2020-2032
- 10.1. Market Analysis, Insights and Forecast - by Application
- 10.1.1. mRNA Vaccines
- 10.1.2. Gene Therapy
- 10.1.3. Cell Culture
- 10.1.4. Others
- 10.2. Market Analysis, Insights and Forecast - by Types
- 10.2.1. Purity≥98%
- 10.2.2. Purity≥99%
- 10.1. Market Analysis, Insights and Forecast - by Application
- 11. Competitive Analysis
- 11.1. Global Market Share Analysis 2025
- 11.2. Company Profiles
- 11.2.1 Evonik
- 11.2.1.1. Overview
- 11.2.1.2. Products
- 11.2.1.3. SWOT Analysis
- 11.2.1.4. Recent Developments
- 11.2.1.5. Financials (Based on Availability)
- 11.2.2 Hunan Kerey Pharmaceutical
- 11.2.2.1. Overview
- 11.2.2.2. Products
- 11.2.2.3. SWOT Analysis
- 11.2.2.4. Recent Developments
- 11.2.2.5. Financials (Based on Availability)
- 11.2.3 Croda Pharma (Avanti)
- 11.2.3.1. Overview
- 11.2.3.2. Products
- 11.2.3.3. SWOT Analysis
- 11.2.3.4. Recent Developments
- 11.2.3.5. Financials (Based on Availability)
- 11.2.4 Merck
- 11.2.4.1. Overview
- 11.2.4.2. Products
- 11.2.4.3. SWOT Analysis
- 11.2.4.4. Recent Developments
- 11.2.4.5. Financials (Based on Availability)
- 11.2.5 SINOPEG
- 11.2.5.1. Overview
- 11.2.5.2. Products
- 11.2.5.3. SWOT Analysis
- 11.2.5.4. Recent Developments
- 11.2.5.5. Financials (Based on Availability)
- 11.2.6 Hunan Furui Biopharma
- 11.2.6.1. Overview
- 11.2.6.2. Products
- 11.2.6.3. SWOT Analysis
- 11.2.6.4. Recent Developments
- 11.2.6.5. Financials (Based on Availability)
- 11.2.7 Biopharma PEG
- 11.2.7.1. Overview
- 11.2.7.2. Products
- 11.2.7.3. SWOT Analysis
- 11.2.7.4. Recent Developments
- 11.2.7.5. Financials (Based on Availability)
- 11.2.8 IRIS BIOTECH GMBH
- 11.2.8.1. Overview
- 11.2.8.2. Products
- 11.2.8.3. SWOT Analysis
- 11.2.8.4. Recent Developments
- 11.2.8.5. Financials (Based on Availability)
- 11.2.1 Evonik
List of Figures
- Figure 1: Global Injection-grade Plant Derived Cholesterol Revenue Breakdown (million, %) by Region 2025 & 2033
- Figure 2: Global Injection-grade Plant Derived Cholesterol Volume Breakdown (K, %) by Region 2025 & 2033
- Figure 3: North America Injection-grade Plant Derived Cholesterol Revenue (million), by Application 2025 & 2033
- Figure 4: North America Injection-grade Plant Derived Cholesterol Volume (K), by Application 2025 & 2033
- Figure 5: North America Injection-grade Plant Derived Cholesterol Revenue Share (%), by Application 2025 & 2033
- Figure 6: North America Injection-grade Plant Derived Cholesterol Volume Share (%), by Application 2025 & 2033
- Figure 7: North America Injection-grade Plant Derived Cholesterol Revenue (million), by Types 2025 & 2033
- Figure 8: North America Injection-grade Plant Derived Cholesterol Volume (K), by Types 2025 & 2033
- Figure 9: North America Injection-grade Plant Derived Cholesterol Revenue Share (%), by Types 2025 & 2033
- Figure 10: North America Injection-grade Plant Derived Cholesterol Volume Share (%), by Types 2025 & 2033
- Figure 11: North America Injection-grade Plant Derived Cholesterol Revenue (million), by Country 2025 & 2033
- Figure 12: North America Injection-grade Plant Derived Cholesterol Volume (K), by Country 2025 & 2033
- Figure 13: North America Injection-grade Plant Derived Cholesterol Revenue Share (%), by Country 2025 & 2033
- Figure 14: North America Injection-grade Plant Derived Cholesterol Volume Share (%), by Country 2025 & 2033
- Figure 15: South America Injection-grade Plant Derived Cholesterol Revenue (million), by Application 2025 & 2033
- Figure 16: South America Injection-grade Plant Derived Cholesterol Volume (K), by Application 2025 & 2033
- Figure 17: South America Injection-grade Plant Derived Cholesterol Revenue Share (%), by Application 2025 & 2033
- Figure 18: South America Injection-grade Plant Derived Cholesterol Volume Share (%), by Application 2025 & 2033
- Figure 19: South America Injection-grade Plant Derived Cholesterol Revenue (million), by Types 2025 & 2033
- Figure 20: South America Injection-grade Plant Derived Cholesterol Volume (K), by Types 2025 & 2033
- Figure 21: South America Injection-grade Plant Derived Cholesterol Revenue Share (%), by Types 2025 & 2033
- Figure 22: South America Injection-grade Plant Derived Cholesterol Volume Share (%), by Types 2025 & 2033
- Figure 23: South America Injection-grade Plant Derived Cholesterol Revenue (million), by Country 2025 & 2033
- Figure 24: South America Injection-grade Plant Derived Cholesterol Volume (K), by Country 2025 & 2033
- Figure 25: South America Injection-grade Plant Derived Cholesterol Revenue Share (%), by Country 2025 & 2033
- Figure 26: South America Injection-grade Plant Derived Cholesterol Volume Share (%), by Country 2025 & 2033
- Figure 27: Europe Injection-grade Plant Derived Cholesterol Revenue (million), by Application 2025 & 2033
- Figure 28: Europe Injection-grade Plant Derived Cholesterol Volume (K), by Application 2025 & 2033
- Figure 29: Europe Injection-grade Plant Derived Cholesterol Revenue Share (%), by Application 2025 & 2033
- Figure 30: Europe Injection-grade Plant Derived Cholesterol Volume Share (%), by Application 2025 & 2033
- Figure 31: Europe Injection-grade Plant Derived Cholesterol Revenue (million), by Types 2025 & 2033
- Figure 32: Europe Injection-grade Plant Derived Cholesterol Volume (K), by Types 2025 & 2033
- Figure 33: Europe Injection-grade Plant Derived Cholesterol Revenue Share (%), by Types 2025 & 2033
- Figure 34: Europe Injection-grade Plant Derived Cholesterol Volume Share (%), by Types 2025 & 2033
- Figure 35: Europe Injection-grade Plant Derived Cholesterol Revenue (million), by Country 2025 & 2033
- Figure 36: Europe Injection-grade Plant Derived Cholesterol Volume (K), by Country 2025 & 2033
- Figure 37: Europe Injection-grade Plant Derived Cholesterol Revenue Share (%), by Country 2025 & 2033
- Figure 38: Europe Injection-grade Plant Derived Cholesterol Volume Share (%), by Country 2025 & 2033
- Figure 39: Middle East & Africa Injection-grade Plant Derived Cholesterol Revenue (million), by Application 2025 & 2033
- Figure 40: Middle East & Africa Injection-grade Plant Derived Cholesterol Volume (K), by Application 2025 & 2033
- Figure 41: Middle East & Africa Injection-grade Plant Derived Cholesterol Revenue Share (%), by Application 2025 & 2033
- Figure 42: Middle East & Africa Injection-grade Plant Derived Cholesterol Volume Share (%), by Application 2025 & 2033
- Figure 43: Middle East & Africa Injection-grade Plant Derived Cholesterol Revenue (million), by Types 2025 & 2033
- Figure 44: Middle East & Africa Injection-grade Plant Derived Cholesterol Volume (K), by Types 2025 & 2033
- Figure 45: Middle East & Africa Injection-grade Plant Derived Cholesterol Revenue Share (%), by Types 2025 & 2033
- Figure 46: Middle East & Africa Injection-grade Plant Derived Cholesterol Volume Share (%), by Types 2025 & 2033
- Figure 47: Middle East & Africa Injection-grade Plant Derived Cholesterol Revenue (million), by Country 2025 & 2033
- Figure 48: Middle East & Africa Injection-grade Plant Derived Cholesterol Volume (K), by Country 2025 & 2033
- Figure 49: Middle East & Africa Injection-grade Plant Derived Cholesterol Revenue Share (%), by Country 2025 & 2033
- Figure 50: Middle East & Africa Injection-grade Plant Derived Cholesterol Volume Share (%), by Country 2025 & 2033
- Figure 51: Asia Pacific Injection-grade Plant Derived Cholesterol Revenue (million), by Application 2025 & 2033
- Figure 52: Asia Pacific Injection-grade Plant Derived Cholesterol Volume (K), by Application 2025 & 2033
- Figure 53: Asia Pacific Injection-grade Plant Derived Cholesterol Revenue Share (%), by Application 2025 & 2033
- Figure 54: Asia Pacific Injection-grade Plant Derived Cholesterol Volume Share (%), by Application 2025 & 2033
- Figure 55: Asia Pacific Injection-grade Plant Derived Cholesterol Revenue (million), by Types 2025 & 2033
- Figure 56: Asia Pacific Injection-grade Plant Derived Cholesterol Volume (K), by Types 2025 & 2033
- Figure 57: Asia Pacific Injection-grade Plant Derived Cholesterol Revenue Share (%), by Types 2025 & 2033
- Figure 58: Asia Pacific Injection-grade Plant Derived Cholesterol Volume Share (%), by Types 2025 & 2033
- Figure 59: Asia Pacific Injection-grade Plant Derived Cholesterol Revenue (million), by Country 2025 & 2033
- Figure 60: Asia Pacific Injection-grade Plant Derived Cholesterol Volume (K), by Country 2025 & 2033
- Figure 61: Asia Pacific Injection-grade Plant Derived Cholesterol Revenue Share (%), by Country 2025 & 2033
- Figure 62: Asia Pacific Injection-grade Plant Derived Cholesterol Volume Share (%), by Country 2025 & 2033
List of Tables
- Table 1: Global Injection-grade Plant Derived Cholesterol Revenue million Forecast, by Application 2020 & 2033
- Table 2: Global Injection-grade Plant Derived Cholesterol Volume K Forecast, by Application 2020 & 2033
- Table 3: Global Injection-grade Plant Derived Cholesterol Revenue million Forecast, by Types 2020 & 2033
- Table 4: Global Injection-grade Plant Derived Cholesterol Volume K Forecast, by Types 2020 & 2033
- Table 5: Global Injection-grade Plant Derived Cholesterol Revenue million Forecast, by Region 2020 & 2033
- Table 6: Global Injection-grade Plant Derived Cholesterol Volume K Forecast, by Region 2020 & 2033
- Table 7: Global Injection-grade Plant Derived Cholesterol Revenue million Forecast, by Application 2020 & 2033
- Table 8: Global Injection-grade Plant Derived Cholesterol Volume K Forecast, by Application 2020 & 2033
- Table 9: Global Injection-grade Plant Derived Cholesterol Revenue million Forecast, by Types 2020 & 2033
- Table 10: Global Injection-grade Plant Derived Cholesterol Volume K Forecast, by Types 2020 & 2033
- Table 11: Global Injection-grade Plant Derived Cholesterol Revenue million Forecast, by Country 2020 & 2033
- Table 12: Global Injection-grade Plant Derived Cholesterol Volume K Forecast, by Country 2020 & 2033
- Table 13: United States Injection-grade Plant Derived Cholesterol Revenue (million) Forecast, by Application 2020 & 2033
- Table 14: United States Injection-grade Plant Derived Cholesterol Volume (K) Forecast, by Application 2020 & 2033
- Table 15: Canada Injection-grade Plant Derived Cholesterol Revenue (million) Forecast, by Application 2020 & 2033
- Table 16: Canada Injection-grade Plant Derived Cholesterol Volume (K) Forecast, by Application 2020 & 2033
- Table 17: Mexico Injection-grade Plant Derived Cholesterol Revenue (million) Forecast, by Application 2020 & 2033
- Table 18: Mexico Injection-grade Plant Derived Cholesterol Volume (K) Forecast, by Application 2020 & 2033
- Table 19: Global Injection-grade Plant Derived Cholesterol Revenue million Forecast, by Application 2020 & 2033
- Table 20: Global Injection-grade Plant Derived Cholesterol Volume K Forecast, by Application 2020 & 2033
- Table 21: Global Injection-grade Plant Derived Cholesterol Revenue million Forecast, by Types 2020 & 2033
- Table 22: Global Injection-grade Plant Derived Cholesterol Volume K Forecast, by Types 2020 & 2033
- Table 23: Global Injection-grade Plant Derived Cholesterol Revenue million Forecast, by Country 2020 & 2033
- Table 24: Global Injection-grade Plant Derived Cholesterol Volume K Forecast, by Country 2020 & 2033
- Table 25: Brazil Injection-grade Plant Derived Cholesterol Revenue (million) Forecast, by Application 2020 & 2033
- Table 26: Brazil Injection-grade Plant Derived Cholesterol Volume (K) Forecast, by Application 2020 & 2033
- Table 27: Argentina Injection-grade Plant Derived Cholesterol Revenue (million) Forecast, by Application 2020 & 2033
- Table 28: Argentina Injection-grade Plant Derived Cholesterol Volume (K) Forecast, by Application 2020 & 2033
- Table 29: Rest of South America Injection-grade Plant Derived Cholesterol Revenue (million) Forecast, by Application 2020 & 2033
- Table 30: Rest of South America Injection-grade Plant Derived Cholesterol Volume (K) Forecast, by Application 2020 & 2033
- Table 31: Global Injection-grade Plant Derived Cholesterol Revenue million Forecast, by Application 2020 & 2033
- Table 32: Global Injection-grade Plant Derived Cholesterol Volume K Forecast, by Application 2020 & 2033
- Table 33: Global Injection-grade Plant Derived Cholesterol Revenue million Forecast, by Types 2020 & 2033
- Table 34: Global Injection-grade Plant Derived Cholesterol Volume K Forecast, by Types 2020 & 2033
- Table 35: Global Injection-grade Plant Derived Cholesterol Revenue million Forecast, by Country 2020 & 2033
- Table 36: Global Injection-grade Plant Derived Cholesterol Volume K Forecast, by Country 2020 & 2033
- Table 37: United Kingdom Injection-grade Plant Derived Cholesterol Revenue (million) Forecast, by Application 2020 & 2033
- Table 38: United Kingdom Injection-grade Plant Derived Cholesterol Volume (K) Forecast, by Application 2020 & 2033
- Table 39: Germany Injection-grade Plant Derived Cholesterol Revenue (million) Forecast, by Application 2020 & 2033
- Table 40: Germany Injection-grade Plant Derived Cholesterol Volume (K) Forecast, by Application 2020 & 2033
- Table 41: France Injection-grade Plant Derived Cholesterol Revenue (million) Forecast, by Application 2020 & 2033
- Table 42: France Injection-grade Plant Derived Cholesterol Volume (K) Forecast, by Application 2020 & 2033
- Table 43: Italy Injection-grade Plant Derived Cholesterol Revenue (million) Forecast, by Application 2020 & 2033
- Table 44: Italy Injection-grade Plant Derived Cholesterol Volume (K) Forecast, by Application 2020 & 2033
- Table 45: Spain Injection-grade Plant Derived Cholesterol Revenue (million) Forecast, by Application 2020 & 2033
- Table 46: Spain Injection-grade Plant Derived Cholesterol Volume (K) Forecast, by Application 2020 & 2033
- Table 47: Russia Injection-grade Plant Derived Cholesterol Revenue (million) Forecast, by Application 2020 & 2033
- Table 48: Russia Injection-grade Plant Derived Cholesterol Volume (K) Forecast, by Application 2020 & 2033
- Table 49: Benelux Injection-grade Plant Derived Cholesterol Revenue (million) Forecast, by Application 2020 & 2033
- Table 50: Benelux Injection-grade Plant Derived Cholesterol Volume (K) Forecast, by Application 2020 & 2033
- Table 51: Nordics Injection-grade Plant Derived Cholesterol Revenue (million) Forecast, by Application 2020 & 2033
- Table 52: Nordics Injection-grade Plant Derived Cholesterol Volume (K) Forecast, by Application 2020 & 2033
- Table 53: Rest of Europe Injection-grade Plant Derived Cholesterol Revenue (million) Forecast, by Application 2020 & 2033
- Table 54: Rest of Europe Injection-grade Plant Derived Cholesterol Volume (K) Forecast, by Application 2020 & 2033
- Table 55: Global Injection-grade Plant Derived Cholesterol Revenue million Forecast, by Application 2020 & 2033
- Table 56: Global Injection-grade Plant Derived Cholesterol Volume K Forecast, by Application 2020 & 2033
- Table 57: Global Injection-grade Plant Derived Cholesterol Revenue million Forecast, by Types 2020 & 2033
- Table 58: Global Injection-grade Plant Derived Cholesterol Volume K Forecast, by Types 2020 & 2033
- Table 59: Global Injection-grade Plant Derived Cholesterol Revenue million Forecast, by Country 2020 & 2033
- Table 60: Global Injection-grade Plant Derived Cholesterol Volume K Forecast, by Country 2020 & 2033
- Table 61: Turkey Injection-grade Plant Derived Cholesterol Revenue (million) Forecast, by Application 2020 & 2033
- Table 62: Turkey Injection-grade Plant Derived Cholesterol Volume (K) Forecast, by Application 2020 & 2033
- Table 63: Israel Injection-grade Plant Derived Cholesterol Revenue (million) Forecast, by Application 2020 & 2033
- Table 64: Israel Injection-grade Plant Derived Cholesterol Volume (K) Forecast, by Application 2020 & 2033
- Table 65: GCC Injection-grade Plant Derived Cholesterol Revenue (million) Forecast, by Application 2020 & 2033
- Table 66: GCC Injection-grade Plant Derived Cholesterol Volume (K) Forecast, by Application 2020 & 2033
- Table 67: North Africa Injection-grade Plant Derived Cholesterol Revenue (million) Forecast, by Application 2020 & 2033
- Table 68: North Africa Injection-grade Plant Derived Cholesterol Volume (K) Forecast, by Application 2020 & 2033
- Table 69: South Africa Injection-grade Plant Derived Cholesterol Revenue (million) Forecast, by Application 2020 & 2033
- Table 70: South Africa Injection-grade Plant Derived Cholesterol Volume (K) Forecast, by Application 2020 & 2033
- Table 71: Rest of Middle East & Africa Injection-grade Plant Derived Cholesterol Revenue (million) Forecast, by Application 2020 & 2033
- Table 72: Rest of Middle East & Africa Injection-grade Plant Derived Cholesterol Volume (K) Forecast, by Application 2020 & 2033
- Table 73: Global Injection-grade Plant Derived Cholesterol Revenue million Forecast, by Application 2020 & 2033
- Table 74: Global Injection-grade Plant Derived Cholesterol Volume K Forecast, by Application 2020 & 2033
- Table 75: Global Injection-grade Plant Derived Cholesterol Revenue million Forecast, by Types 2020 & 2033
- Table 76: Global Injection-grade Plant Derived Cholesterol Volume K Forecast, by Types 2020 & 2033
- Table 77: Global Injection-grade Plant Derived Cholesterol Revenue million Forecast, by Country 2020 & 2033
- Table 78: Global Injection-grade Plant Derived Cholesterol Volume K Forecast, by Country 2020 & 2033
- Table 79: China Injection-grade Plant Derived Cholesterol Revenue (million) Forecast, by Application 2020 & 2033
- Table 80: China Injection-grade Plant Derived Cholesterol Volume (K) Forecast, by Application 2020 & 2033
- Table 81: India Injection-grade Plant Derived Cholesterol Revenue (million) Forecast, by Application 2020 & 2033
- Table 82: India Injection-grade Plant Derived Cholesterol Volume (K) Forecast, by Application 2020 & 2033
- Table 83: Japan Injection-grade Plant Derived Cholesterol Revenue (million) Forecast, by Application 2020 & 2033
- Table 84: Japan Injection-grade Plant Derived Cholesterol Volume (K) Forecast, by Application 2020 & 2033
- Table 85: South Korea Injection-grade Plant Derived Cholesterol Revenue (million) Forecast, by Application 2020 & 2033
- Table 86: South Korea Injection-grade Plant Derived Cholesterol Volume (K) Forecast, by Application 2020 & 2033
- Table 87: ASEAN Injection-grade Plant Derived Cholesterol Revenue (million) Forecast, by Application 2020 & 2033
- Table 88: ASEAN Injection-grade Plant Derived Cholesterol Volume (K) Forecast, by Application 2020 & 2033
- Table 89: Oceania Injection-grade Plant Derived Cholesterol Revenue (million) Forecast, by Application 2020 & 2033
- Table 90: Oceania Injection-grade Plant Derived Cholesterol Volume (K) Forecast, by Application 2020 & 2033
- Table 91: Rest of Asia Pacific Injection-grade Plant Derived Cholesterol Revenue (million) Forecast, by Application 2020 & 2033
- Table 92: Rest of Asia Pacific Injection-grade Plant Derived Cholesterol Volume (K) Forecast, by Application 2020 & 2033
Frequently Asked Questions
1. What is the projected Compound Annual Growth Rate (CAGR) of the Injection-grade Plant Derived Cholesterol?
The projected CAGR is approximately 12.2%.
2. Which companies are prominent players in the Injection-grade Plant Derived Cholesterol?
Key companies in the market include Evonik, Hunan Kerey Pharmaceutical, Croda Pharma (Avanti), Merck, SINOPEG, Hunan Furui Biopharma, Biopharma PEG, IRIS BIOTECH GMBH.
3. What are the main segments of the Injection-grade Plant Derived Cholesterol?
The market segments include Application, Types.
4. Can you provide details about the market size?
The market size is estimated to be USD 122 million as of 2022.
5. What are some drivers contributing to market growth?
N/A
6. What are the notable trends driving market growth?
N/A
7. Are there any restraints impacting market growth?
N/A
8. Can you provide examples of recent developments in the market?
N/A
9. What pricing options are available for accessing the report?
Pricing options include single-user, multi-user, and enterprise licenses priced at USD 4350.00, USD 6525.00, and USD 8700.00 respectively.
10. Is the market size provided in terms of value or volume?
The market size is provided in terms of value, measured in million and volume, measured in K.
11. Are there any specific market keywords associated with the report?
Yes, the market keyword associated with the report is "Injection-grade Plant Derived Cholesterol," which aids in identifying and referencing the specific market segment covered.
12. How do I determine which pricing option suits my needs best?
The pricing options vary based on user requirements and access needs. Individual users may opt for single-user licenses, while businesses requiring broader access may choose multi-user or enterprise licenses for cost-effective access to the report.
13. Are there any additional resources or data provided in the Injection-grade Plant Derived Cholesterol report?
While the report offers comprehensive insights, it's advisable to review the specific contents or supplementary materials provided to ascertain if additional resources or data are available.
14. How can I stay updated on further developments or reports in the Injection-grade Plant Derived Cholesterol?
To stay informed about further developments, trends, and reports in the Injection-grade Plant Derived Cholesterol, consider subscribing to industry newsletters, following relevant companies and organizations, or regularly checking reputable industry news sources and publications.
Methodology
Step 1 - Identification of Relevant Samples Size from Population Database


Step 2 - Approaches for Defining Global Market Size (Value, Volume* & Price*)

Note*: In applicable scenarios
Step 3 - Data Sources
Primary Research
- Web Analytics
- Survey Reports
- Research Institute
- Latest Research Reports
- Opinion Leaders
Secondary Research
- Annual Reports
- White Paper
- Latest Press Release
- Industry Association
- Paid Database
- Investor Presentations

Step 4 - Data Triangulation
Involves using different sources of information in order to increase the validity of a study
These sources are likely to be stakeholders in a program - participants, other researchers, program staff, other community members, and so on.
Then we put all data in single framework & apply various statistical tools to find out the dynamic on the market.
During the analysis stage, feedback from the stakeholder groups would be compared to determine areas of agreement as well as areas of divergence