

Key Insights
The Platinum Group Metals (PGM) market is experiencing robust growth, projected to reach an estimated $41.59 billion in 2024, driven by sustained demand across diverse industrial applications. The market is anticipated to expand at a Compound Annual Growth Rate (CAGR) of 3.31% from 2025 to 2033, indicating a healthy and steady upward trajectory. Key to this expansion is the indispensable role of PGMs in automotive catalysts, a sector that continues to evolve with stricter emission standards and the ongoing development of cleaner combustion engines. Beyond automotive, the increasing adoption of PGMs in the electrical and electronics industry, fueled by advancements in consumer electronics and industrial machinery, further bolsters market performance. Emerging applications in fuel cells, a critical component of the renewable energy transition, are poised to become significant growth drivers in the coming years, presenting substantial opportunities for PGM producers.
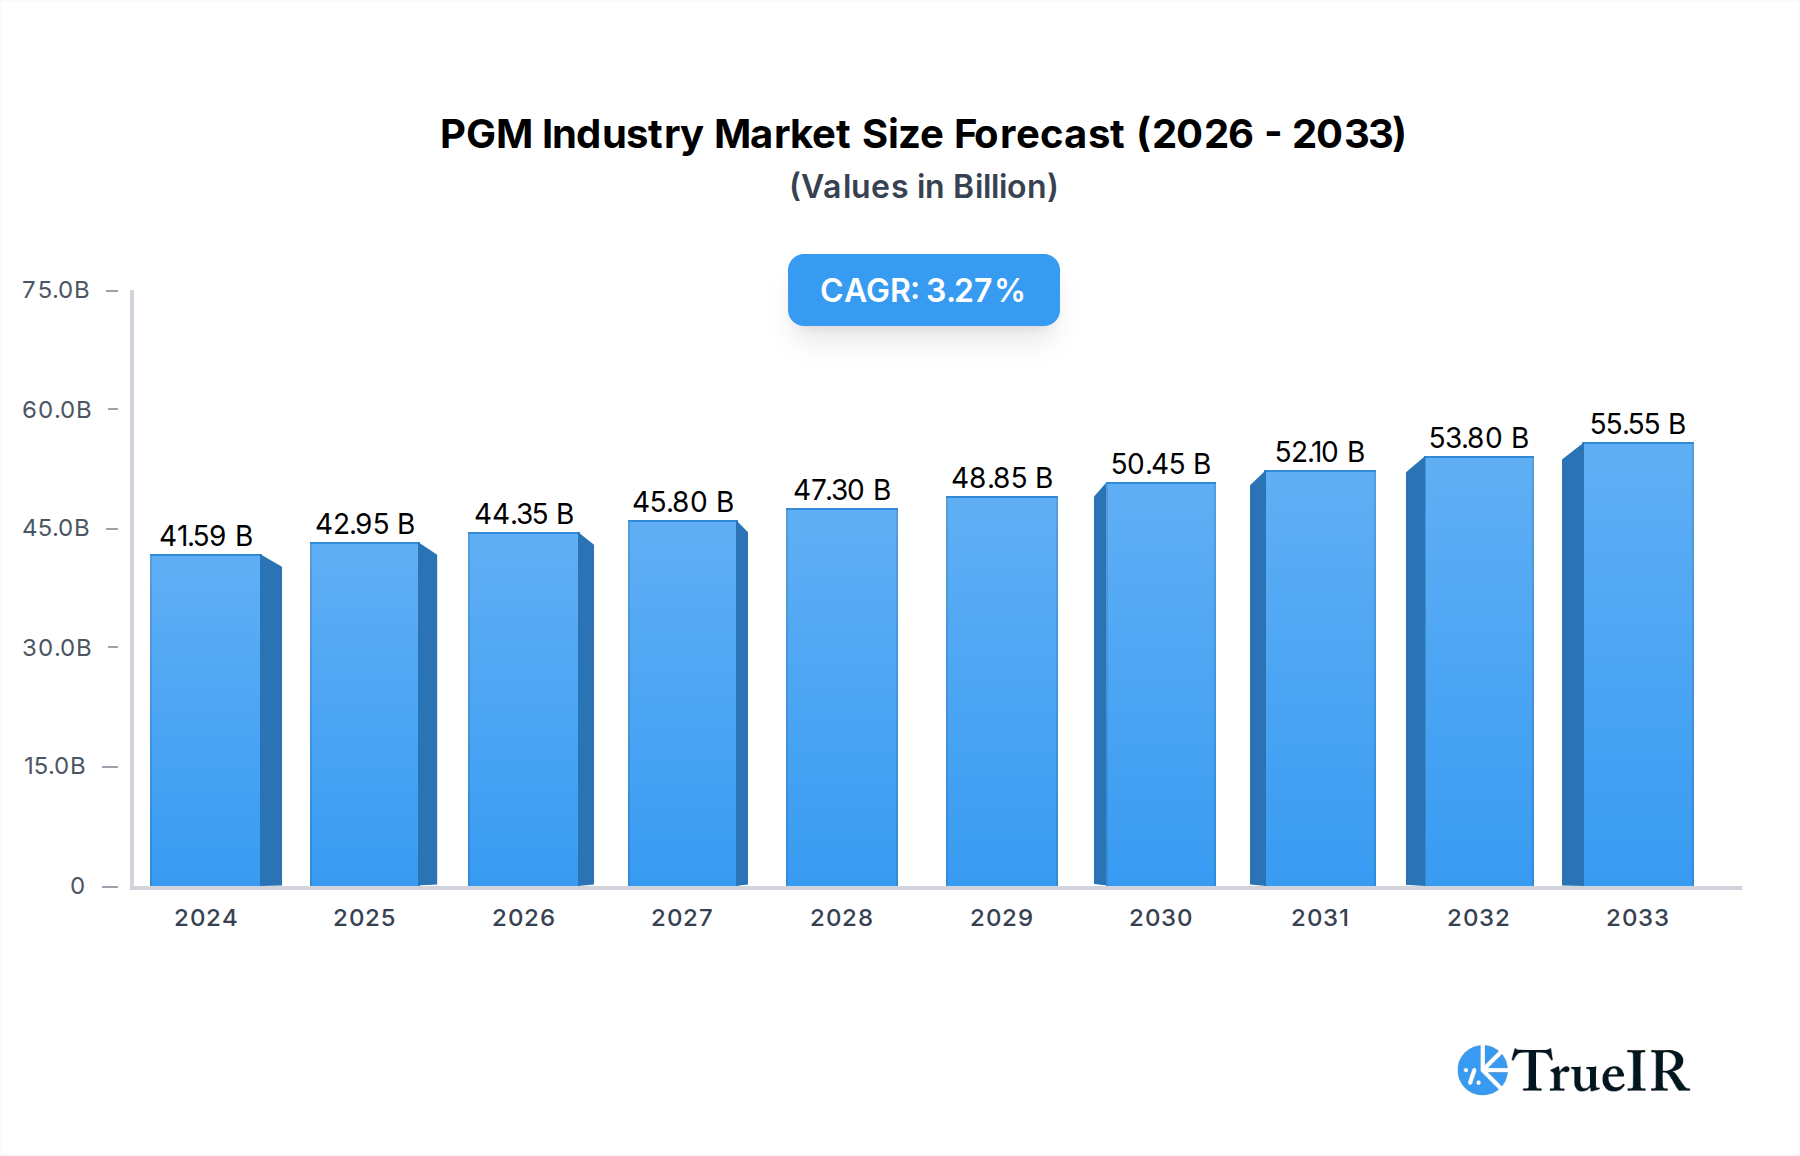
PGM Industry Market Size (In Billion)
The PGM market's dynamism is also shaped by evolving trends and specific metal performances. Palladium, a primary component in catalytic converters, has seen its demand significantly influenced by automotive production cycles and the shift towards hybrid and electric vehicles. Rhodium, valued for its exceptional catalytic properties and rarity, continues to command premium pricing, largely driven by stringent emissions regulations in key automotive markets. Platinum's versatile applications, spanning jewelry, medical devices, and industrial processes, provide a stable demand base, while its potential in hydrogen fuel cells is a key area of future growth. Despite the strong growth outlook, the PGM market faces restraints such as price volatility, driven by geopolitical factors and supply-demand imbalances, and the ongoing R&D efforts to develop alternative materials that could reduce reliance on specific PGMs in certain applications. The competitive landscape features major global players, including Anglo American Platinum Limited, Implats Platinum Limited, and Sibanye-Stillwater, all actively involved in the extraction, refining, and marketing of these precious metals, with significant regional contributions from South Africa and North America.

PGM Industry Company Market Share
Unveiling the Future: Platinum Group Metals (PGM) Industry Market Analysis and Forecast 2019-2033
This comprehensive report provides an in-depth analysis of the global Platinum Group Metals (PGM) industry, offering critical insights into market dynamics, key players, emerging trends, and future growth trajectories. Spanning a study period from 2019 to 2033, with a base and estimated year of 2025 and a forecast period of 2025–2033, this report is an indispensable resource for stakeholders seeking to navigate the complexities and capitalize on the opportunities within this vital sector. The analysis leverages high-volume SEO keywords to ensure maximum visibility and engagement with industry professionals.
PGM Industry Market Structure & Competitive Landscape
The PGM industry exhibits a moderately concentrated market structure, characterized by the dominance of a few major players, including ANGLO AMERICAN PLATINUM LIMITED, Implats Platinum Limited, Vale, Norilsk Nickel, African Rainbow Minerals Limited, GLENCORE, Northam Platinum Holdings Limited, Johnson Matthey, Sibanye-Stillwater, and Platinum Group Metals Ltd. These entities collectively command a significant portion of global production and downstream processing. Innovation drivers are primarily focused on enhancing extraction efficiency, developing novel applications for PGMs, and improving recycling technologies. Regulatory impacts are substantial, influencing environmental standards, mining permits, and international trade agreements. Product substitutes, while limited for certain critical applications like catalytic converters, are an ongoing area of research, particularly in the context of electric vehicle adoption. End-user segmentation reveals a strong reliance on the automotive sector, followed by electrical and electronics, chemical industries, and growing demand from fuel cells. Mergers and acquisitions (M&A) trends are notable, with recent activities reflecting strategic consolidation and the pursuit of vertical integration. For instance, Sibanye-Stillwater's acquisition of Reldan signals a growing emphasis on the circular economy and PGM recycling. The overall M&A volume is estimated in the billions, underscoring the significant capital deployed in shaping the competitive landscape.
PGM Industry Market Trends & Opportunities
The PGM industry is poised for significant market size growth driven by a confluence of technological advancements, evolving consumer preferences, and dynamic competitive forces. The global PGM market is projected to witness a compound annual growth rate (CAGR) of approximately 6.5% between 2025 and 2033, reaching an estimated value exceeding 30 billion USD. This expansion is largely propelled by the escalating demand for platinum and palladium in automotive catalytic converters, crucial for emissions control. However, the automotive sector's transition towards electric vehicles presents a dual-edged sword, potentially reducing demand for traditional internal combustion engine catalysts while simultaneously boosting the need for PGMs in fuel cell technology. This shift represents a significant opportunity for innovation and market penetration. The burgeoning fuel cell market, particularly for hydrogen-powered vehicles and stationary power generation, is emerging as a key growth segment, with PGM catalysts being indispensable for their efficiency. Furthermore, the increasing adoption of advanced electronics and the growing utilization of PGMs in medical applications, such as pharmaceuticals and dental prosthetics, are contributing to market diversification. The chemical industry's continued reliance on PGMs as catalysts for various industrial processes also underpins stable demand. The development of more efficient PGM recovery and recycling processes from spent catalysts and electronic waste is becoming paramount, offering substantial cost savings and environmental benefits, contributing to a more sustainable PGM ecosystem. The investment in new mining technologies and exploration, alongside strategic collaborations between mining companies and end-users, will be critical in meeting future demand and maintaining competitive advantage. The PGM market penetration in emerging economies, driven by industrialization and rising disposable incomes, is expected to accelerate, opening up new avenues for market expansion and development.
Dominant Markets & Segments in PGM Industry
The Platinum Group Metals (PGM) industry's dominance is clearly established across specific metal types and application segments, driven by a combination of essential properties and burgeoning demand.
Metal Type Dominance:
- Platinum (Pt): This metal consistently holds the largest market share due to its extensive use in automotive catalysts for emission control and its significant role in jewelry. Its exceptional durability and corrosion resistance make it indispensable.
- Palladium (Pd): While historically second to platinum, palladium has experienced periods of heightened demand, particularly in gasoline vehicle catalytic converters, driven by stricter emissions regulations worldwide. Its market share is substantial and directly linked to automotive production.
- Rhodium (Rh): Critical for its ability to withstand high temperatures and corrosive environments, rhodium is essential in diesel catalytic converters and increasingly vital in hydrogen fuel cells. Its scarcity and high price contribute to its specialized market dominance.
- Iridium (Ir), Ruthenium (Ru), Osmium (Os): These platinum-group metals, while less dominant in terms of volume, hold critical niche applications. Iridium is used in spark plugs and crucibles for high-temperature applications, while Ruthenium finds use in electronics and catalysts. Osmium, though rare, has specialized uses in alloys and scientific instruments.
Application Dominance:
- Auto Catalysts: This remains the single largest application for PGMs, particularly platinum and palladium, accounting for over 70% of global demand. Stringent emissions standards globally are the primary growth driver.
- Electrical and Electronics: The use of PGMs in connectors, sensors, and other components in a wide array of electronic devices continues to expand, fueled by the relentless growth of the consumer electronics and telecommunications sectors.
- Fuel Cells: This segment represents a significant emerging market. Platinum is the key catalyst in proton-exchange membrane (PEM) fuel cells, crucial for the burgeoning hydrogen economy and electric vehicle revolution.
- Chemical Industry: PGMs serve as vital catalysts in numerous chemical processes, including petrochemical refining, hydrogenation, and the production of various chemicals. This segment provides a stable and consistent demand base.
- Glass, Ceramics, and Pigments: Platinum's inertness makes it valuable in the production of specialized glass, high-performance ceramics, and certain pigments where purity and resistance to extreme conditions are paramount.
- Jewellery: Platinum and palladium are highly sought after in the jewelry market for their rarity, beauty, and durability, contributing a notable portion to overall demand.
- Medical (Dental and Pharmaceuticals): PGMs are utilized in dental alloys for their biocompatibility and in pharmaceuticals, particularly in cancer treatments and medical devices, highlighting their therapeutic and technological significance.
Geographically, Asia-Pacific, led by China and Japan, is a dominant region due to its massive automotive manufacturing base and its growing electronics industry. North America and Europe remain significant markets, driven by advanced automotive technologies and strong healthcare sectors.
PGM Industry Product Analysis
The PGM industry is characterized by a continuous drive for product innovation, focusing on enhancing catalyst efficiency, durability, and cost-effectiveness. Key product innovations revolve around developing more sophisticated catalyst formulations for emission control, optimizing PGM utilization in fuel cells to reduce reliance on scarce metals, and creating advanced PGM-based materials for electronics and medical applications. Competitive advantages are derived from proprietary catalyst technologies, advanced refining processes that maximize PGM recovery, and the ability to supply highly pure, specialized PGM compounds tailored to specific end-user requirements.
Key Drivers, Barriers & Challenges in PGM Industry
Key Drivers:
- Stringent Emission Regulations: Global mandates for reduced vehicle emissions remain a primary driver, increasing the demand for catalytic converters utilizing platinum and palladium.
- Growth of Hydrogen Fuel Cells: The emerging hydrogen economy and the adoption of fuel cell electric vehicles (FCEVs) are creating substantial new demand for platinum catalysts.
- Technological Advancements in Electronics: Miniaturization and increased functionality in electronic devices necessitate the use of PGMs in components.
- Industrial Catalysis Demand: The chemical and petrochemical industries' continuous need for efficient catalysts fuels consistent PGM demand.
Barriers & Challenges:
- Price Volatility: Fluctuations in PGM prices, influenced by supply and demand dynamics, geopolitical events, and speculation, create significant financial risks for the industry.
- Supply Chain Vulnerabilities: Geopolitical instability in major producing regions, such as South Africa and Russia, can disrupt PGM supply chains.
- Competition from Substitute Technologies: The transition to electric vehicles without fuel cells poses a long-term challenge to the traditional automotive catalyst market.
- Environmental and Social Governance (ESG) Pressures: Mining operations face increasing scrutiny regarding their environmental impact and labor practices, necessitating significant investment in sustainable operations.
- Recycling Efficiency: While growing, the efficiency and widespread adoption of PGM recycling processes still present a challenge in fully closing the loop on PGM usage.
Growth Drivers in the PGM Industry Market
The PGM industry market is primarily propelled by technological advancements in emission control for internal combustion engines and the burgeoning adoption of hydrogen fuel cell technology, especially in the automotive sector. Regulatory mandates for cleaner air globally continue to be a significant economic driver, enforcing the use of PGM-based catalysts. Furthermore, the increasing demand for advanced electronics and the critical role of PGMs in various chemical processes provide a stable and growing foundation for market expansion. Strategic collaborations between PGM producers and end-users, such as the October 2023 agreement between Anglo-American, BMW Group South Africa, and Sasol South Africa Limited, underscore the industry's proactive approach to innovation and market development in the fuel cell space.
Challenges Impacting PGM Industry Growth
Regulatory complexities surrounding mining and environmental standards can impact production costs and timelines. Supply chain issues, exacerbated by geopolitical instabilities in key PGM-producing regions, pose a constant threat to market stability. Competitive pressures, including the potential displacement of PGM-dependent technologies by alternatives in the long term, particularly with the rise of battery electric vehicles, also present a significant challenge. The price volatility of PGMs, influenced by global economic factors and speculative trading, creates uncertainty and can hinder investment decisions. Overcoming these challenges requires continuous innovation in mining, refining, recycling, and the development of new, high-value applications for PGMs.
Key Players Shaping the PGM Industry Market
- ANGLO AMERICAN PLATINUM LIMITED
- Implats Platinum Limited
- Vale
- Norilsk Nickel
- African Rainbow Minerals Limited
- GLENCORE
- Northam Platinum Holdings Limited
- Johnson Matthey
- Sibanye-Stillwater
- Platinum Group Metals Ltd
Significant PGM Industry Industry Milestones
- November 2023: Sibanye-Stillwater agreed to acquire Reldan, a metal recycler based in the United States. Reldan is a Pennsylvania-based recycling group that reprocesses various waste streams, including industrial and electronic waste, to recycle green precious metals such as platinum and palladium. This acquisition significantly bolsters Sibanye-Stillwater's position in the circular economy and PGM recycling market.
- October 2023: Anglo-American collaborated with BMW Group South Africa and Sasol South Africa Limited. Under the collaboration agreements, BMW will provide the hydrogen fuel-cell electric vehicles (FCEVs), Sasol will supply the green hydrogen and mobile refueler, and Anglo American will provide platinum group metals (PGMs) used in FCEVs. This partnership is a crucial step in advancing the adoption of hydrogen mobility.
Future Outlook for PGM Industry Market
The future outlook for the PGM industry market is characterized by robust growth fueled by the sustained demand in automotive catalysts, the accelerating adoption of hydrogen fuel cell technology, and continued innovation in electronics and medical applications. Strategic investments in recycling infrastructure and the development of more efficient PGM recovery processes will play a pivotal role in ensuring a sustainable supply chain and mitigating price volatility. The industry is expected to see increased collaboration among stakeholders to drive innovation and navigate the evolving energy landscape, positioning PGMs as critical enablers of a cleaner and more technologically advanced future.
PGM Industry Segmentation
-
1. Metal Type
- 1.1. Platinum
- 1.2. Palladium
- 1.3. Rhodium
- 1.4. Iridium
- 1.5. Ruthenium
- 1.6. Osmium
-
2. Application
- 2.1. Auto Catalysts
- 2.2. Electrical and Electronics
- 2.3. Fuel Cells
- 2.4. Glass, Ceramics, and Pigments
- 2.5. Jewellery
- 2.6. Medical (Dental and Pharmaceuticals)
- 2.7. Chemical Industry
- 2.8. Other Ap
PGM Industry Segmentation By Geography
-
1. Asia Pacific
- 1.1. China
- 1.2. India
- 1.3. Japan
- 1.4. South Korea
- 1.5. ASEAN Countries
- 1.6. Rest of Asia Pacific
-
2. North America
- 2.1. United States
- 2.2. Canada
- 2.3. Mexico
-
3. Europe
- 3.1. Germany
- 3.2. United Kingdom
- 3.3. Italy
- 3.4. France
- 3.5. Rest of Europe
-
4. South America
- 4.1. Brazil
- 4.2. Argentina
- 4.3. Rest of South America
-
5. Middle East and Africa
- 5.1. Saudi Arabia
- 5.2. South Africa
- 5.3. Rest of Middle East and Africa
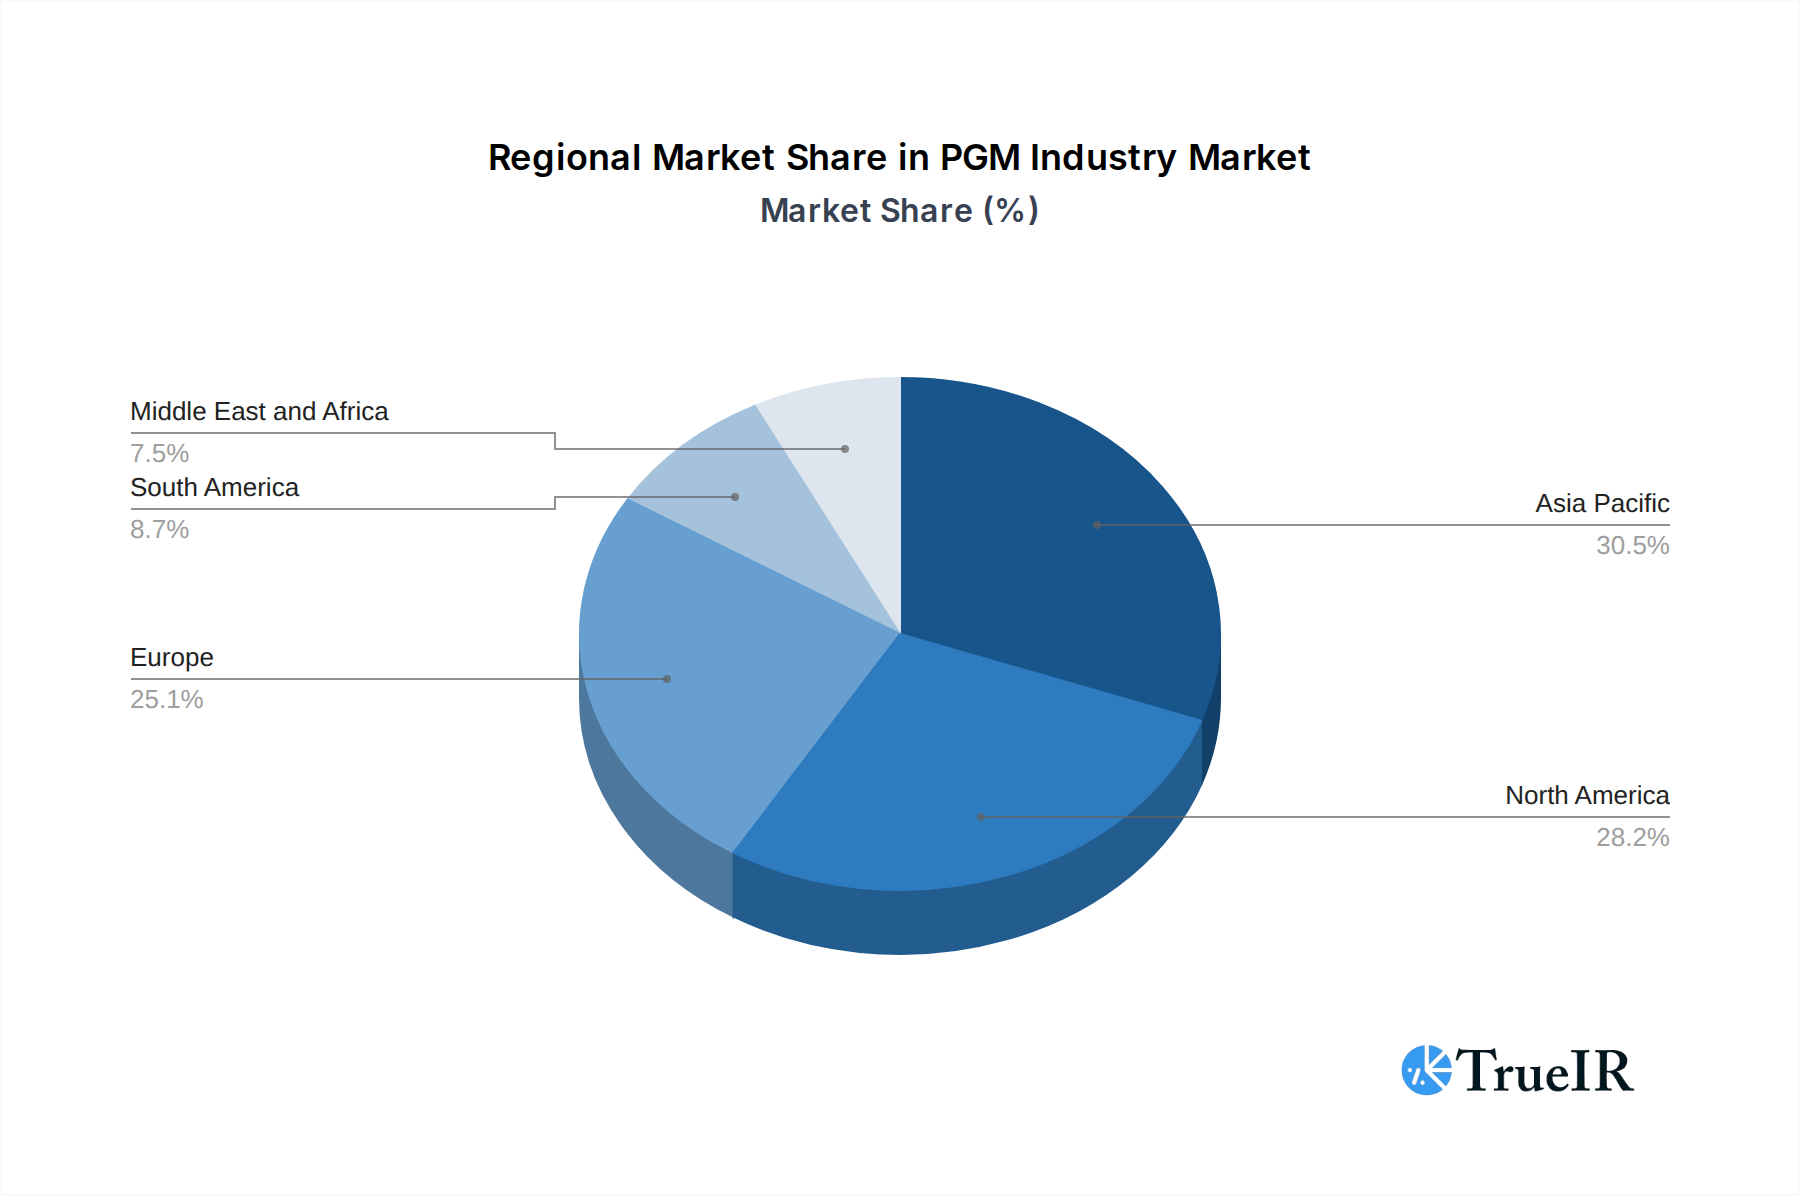
PGM Industry Regional Market Share
Geographic Coverage of PGM Industry
PGM Industry REPORT HIGHLIGHTS
| Aspects | Details |
|---|---|
| Study Period | 2020-2034 |
| Base Year | 2025 |
| Estimated Year | 2026 |
| Forecast Period | 2026-2034 |
| Historical Period | 2020-2025 |
| Growth Rate | CAGR of 3.31% from 2020-2034 |
| Segmentation |
|
Table of Contents
- 1. Introduction
- 1.1. Research Scope
- 1.2. Market Segmentation
- 1.3. Research Objective
- 1.4. Definitions and Assumptions
- 2. Executive Summary
- 2.1. Market Snapshot
- 3. Market Dynamics
- 3.1. Market Drivers
- 3.2. Market Restrains
- 3.3. Market Trends
- 3.4. Market Opportunities
- 4. Market Factor Analysis
- 4.1. Porters Five Forces
- 4.1.1. Bargaining Power of Suppliers
- 4.1.2. Bargaining Power of Buyers
- 4.1.3. Threat of New Entrants
- 4.1.4. Threat of Substitutes
- 4.1.5. Competitive Rivalry
- 4.2. PESTEL analysis
- 4.3. BCG Analysis
- 4.3.1. Stars (High Growth, High Market Share)
- 4.3.2. Cash Cows (Low Growth, High Market Share)
- 4.3.3. Question Mark (High Growth, Low Market Share)
- 4.3.4. Dogs (Low Growth, Low Market Share)
- 4.4. Ansoff Matrix Analysis
- 4.5. Supply Chain Analysis
- 4.6. Regulatory Landscape
- 4.7. Current Market Potential and Opportunity Assessment (TAM–SAM–SOM Framework)
- 4.8. TIR Analyst Note
- 4.1. Porters Five Forces
- 5. Market Analysis, Insights and Forecast 2021-2033
- 5.1. Market Analysis, Insights and Forecast - by Metal Type
- 5.1.1. Platinum
- 5.1.2. Palladium
- 5.1.3. Rhodium
- 5.1.4. Iridium
- 5.1.5. Ruthenium
- 5.1.6. Osmium
- 5.2. Market Analysis, Insights and Forecast - by Application
- 5.2.1. Auto Catalysts
- 5.2.2. Electrical and Electronics
- 5.2.3. Fuel Cells
- 5.2.4. Glass, Ceramics, and Pigments
- 5.2.5. Jewellery
- 5.2.6. Medical (Dental and Pharmaceuticals)
- 5.2.7. Chemical Industry
- 5.2.8. Other Ap
- 5.3. Market Analysis, Insights and Forecast - by Region
- 5.3.1. Asia Pacific
- 5.3.2. North America
- 5.3.3. Europe
- 5.3.4. South America
- 5.3.5. Middle East and Africa
- 5.1. Market Analysis, Insights and Forecast - by Metal Type
- 6. Global PGM Industry Analysis, Insights and Forecast, 2021-2033
- 6.1. Market Analysis, Insights and Forecast - by Metal Type
- 6.1.1. Platinum
- 6.1.2. Palladium
- 6.1.3. Rhodium
- 6.1.4. Iridium
- 6.1.5. Ruthenium
- 6.1.6. Osmium
- 6.2. Market Analysis, Insights and Forecast - by Application
- 6.2.1. Auto Catalysts
- 6.2.2. Electrical and Electronics
- 6.2.3. Fuel Cells
- 6.2.4. Glass, Ceramics, and Pigments
- 6.2.5. Jewellery
- 6.2.6. Medical (Dental and Pharmaceuticals)
- 6.2.7. Chemical Industry
- 6.2.8. Other Ap
- 6.1. Market Analysis, Insights and Forecast - by Metal Type
- 7. Asia Pacific PGM Industry Analysis, Insights and Forecast, 2020-2032
- 7.1. Market Analysis, Insights and Forecast - by Metal Type
- 7.1.1. Platinum
- 7.1.2. Palladium
- 7.1.3. Rhodium
- 7.1.4. Iridium
- 7.1.5. Ruthenium
- 7.1.6. Osmium
- 7.2. Market Analysis, Insights and Forecast - by Application
- 7.2.1. Auto Catalysts
- 7.2.2. Electrical and Electronics
- 7.2.3. Fuel Cells
- 7.2.4. Glass, Ceramics, and Pigments
- 7.2.5. Jewellery
- 7.2.6. Medical (Dental and Pharmaceuticals)
- 7.2.7. Chemical Industry
- 7.2.8. Other Ap
- 7.1. Market Analysis, Insights and Forecast - by Metal Type
- 8. North America PGM Industry Analysis, Insights and Forecast, 2020-2032
- 8.1. Market Analysis, Insights and Forecast - by Metal Type
- 8.1.1. Platinum
- 8.1.2. Palladium
- 8.1.3. Rhodium
- 8.1.4. Iridium
- 8.1.5. Ruthenium
- 8.1.6. Osmium
- 8.2. Market Analysis, Insights and Forecast - by Application
- 8.2.1. Auto Catalysts
- 8.2.2. Electrical and Electronics
- 8.2.3. Fuel Cells
- 8.2.4. Glass, Ceramics, and Pigments
- 8.2.5. Jewellery
- 8.2.6. Medical (Dental and Pharmaceuticals)
- 8.2.7. Chemical Industry
- 8.2.8. Other Ap
- 8.1. Market Analysis, Insights and Forecast - by Metal Type
- 9. Europe PGM Industry Analysis, Insights and Forecast, 2020-2032
- 9.1. Market Analysis, Insights and Forecast - by Metal Type
- 9.1.1. Platinum
- 9.1.2. Palladium
- 9.1.3. Rhodium
- 9.1.4. Iridium
- 9.1.5. Ruthenium
- 9.1.6. Osmium
- 9.2. Market Analysis, Insights and Forecast - by Application
- 9.2.1. Auto Catalysts
- 9.2.2. Electrical and Electronics
- 9.2.3. Fuel Cells
- 9.2.4. Glass, Ceramics, and Pigments
- 9.2.5. Jewellery
- 9.2.6. Medical (Dental and Pharmaceuticals)
- 9.2.7. Chemical Industry
- 9.2.8. Other Ap
- 9.1. Market Analysis, Insights and Forecast - by Metal Type
- 10. South America PGM Industry Analysis, Insights and Forecast, 2020-2032
- 10.1. Market Analysis, Insights and Forecast - by Metal Type
- 10.1.1. Platinum
- 10.1.2. Palladium
- 10.1.3. Rhodium
- 10.1.4. Iridium
- 10.1.5. Ruthenium
- 10.1.6. Osmium
- 10.2. Market Analysis, Insights and Forecast - by Application
- 10.2.1. Auto Catalysts
- 10.2.2. Electrical and Electronics
- 10.2.3. Fuel Cells
- 10.2.4. Glass, Ceramics, and Pigments
- 10.2.5. Jewellery
- 10.2.6. Medical (Dental and Pharmaceuticals)
- 10.2.7. Chemical Industry
- 10.2.8. Other Ap
- 10.1. Market Analysis, Insights and Forecast - by Metal Type
- 11. Middle East and Africa PGM Industry Analysis, Insights and Forecast, 2020-2032
- 11.1. Market Analysis, Insights and Forecast - by Metal Type
- 11.1.1. Platinum
- 11.1.2. Palladium
- 11.1.3. Rhodium
- 11.1.4. Iridium
- 11.1.5. Ruthenium
- 11.1.6. Osmium
- 11.2. Market Analysis, Insights and Forecast - by Application
- 11.2.1. Auto Catalysts
- 11.2.2. Electrical and Electronics
- 11.2.3. Fuel Cells
- 11.2.4. Glass, Ceramics, and Pigments
- 11.2.5. Jewellery
- 11.2.6. Medical (Dental and Pharmaceuticals)
- 11.2.7. Chemical Industry
- 11.2.8. Other Ap
- 11.1. Market Analysis, Insights and Forecast - by Metal Type
- 12. Competitive Analysis
- 12.1. Company Profiles
- 12.1.1 ANGLO AMERICAN PLATINUM LIMITED
- 12.1.1.1. Company Overview
- 12.1.1.2. Products
- 12.1.1.3. Company Financials
- 12.1.1.4. SWOT Analysis
- 12.1.2 Implats Platinum Limited
- 12.1.2.1. Company Overview
- 12.1.2.2. Products
- 12.1.2.3. Company Financials
- 12.1.2.4. SWOT Analysis
- 12.1.3 Vale*List Not Exhaustive
- 12.1.3.1. Company Overview
- 12.1.3.2. Products
- 12.1.3.3. Company Financials
- 12.1.3.4. SWOT Analysis
- 12.1.4 Norilsk Nickel
- 12.1.4.1. Company Overview
- 12.1.4.2. Products
- 12.1.4.3. Company Financials
- 12.1.4.4. SWOT Analysis
- 12.1.5 African Rainbow Minerals Limited
- 12.1.5.1. Company Overview
- 12.1.5.2. Products
- 12.1.5.3. Company Financials
- 12.1.5.4. SWOT Analysis
- 12.1.6 GLENCORE
- 12.1.6.1. Company Overview
- 12.1.6.2. Products
- 12.1.6.3. Company Financials
- 12.1.6.4. SWOT Analysis
- 12.1.7 Northam Platinum Holdings Limited
- 12.1.7.1. Company Overview
- 12.1.7.2. Products
- 12.1.7.3. Company Financials
- 12.1.7.4. SWOT Analysis
- 12.1.8 Johnson Matthey
- 12.1.8.1. Company Overview
- 12.1.8.2. Products
- 12.1.8.3. Company Financials
- 12.1.8.4. SWOT Analysis
- 12.1.9 Sibanye-Stillwater
- 12.1.9.1. Company Overview
- 12.1.9.2. Products
- 12.1.9.3. Company Financials
- 12.1.9.4. SWOT Analysis
- 12.1.10 Platinum Group Metals Ltd
- 12.1.10.1. Company Overview
- 12.1.10.2. Products
- 12.1.10.3. Company Financials
- 12.1.10.4. SWOT Analysis
- 12.1.1 ANGLO AMERICAN PLATINUM LIMITED
- 12.2. Market Entropy
- 12.2.1 Company's Key Areas Served
- 12.2.2 Recent Developments
- 12.3. Company Market Share Analysis 2025
- 12.3.1 Top 5 Companies Market Share Analysis
- 12.3.2 Top 3 Companies Market Share Analysis
- 12.4. List of Potential Customers
- 13. Research Methodology
List of Figures
- Figure 1: Global PGM Industry Revenue Breakdown (billion, %) by Region 2025 & 2033
- Figure 2: Global PGM Industry Volume Breakdown (tons, %) by Region 2025 & 2033
- Figure 3: Asia Pacific PGM Industry Revenue (billion), by Metal Type 2025 & 2033
- Figure 4: Asia Pacific PGM Industry Volume (tons), by Metal Type 2025 & 2033
- Figure 5: Asia Pacific PGM Industry Revenue Share (%), by Metal Type 2025 & 2033
- Figure 6: Asia Pacific PGM Industry Volume Share (%), by Metal Type 2025 & 2033
- Figure 7: Asia Pacific PGM Industry Revenue (billion), by Application 2025 & 2033
- Figure 8: Asia Pacific PGM Industry Volume (tons), by Application 2025 & 2033
- Figure 9: Asia Pacific PGM Industry Revenue Share (%), by Application 2025 & 2033
- Figure 10: Asia Pacific PGM Industry Volume Share (%), by Application 2025 & 2033
- Figure 11: Asia Pacific PGM Industry Revenue (billion), by Country 2025 & 2033
- Figure 12: Asia Pacific PGM Industry Volume (tons), by Country 2025 & 2033
- Figure 13: Asia Pacific PGM Industry Revenue Share (%), by Country 2025 & 2033
- Figure 14: Asia Pacific PGM Industry Volume Share (%), by Country 2025 & 2033
- Figure 15: North America PGM Industry Revenue (billion), by Metal Type 2025 & 2033
- Figure 16: North America PGM Industry Volume (tons), by Metal Type 2025 & 2033
- Figure 17: North America PGM Industry Revenue Share (%), by Metal Type 2025 & 2033
- Figure 18: North America PGM Industry Volume Share (%), by Metal Type 2025 & 2033
- Figure 19: North America PGM Industry Revenue (billion), by Application 2025 & 2033
- Figure 20: North America PGM Industry Volume (tons), by Application 2025 & 2033
- Figure 21: North America PGM Industry Revenue Share (%), by Application 2025 & 2033
- Figure 22: North America PGM Industry Volume Share (%), by Application 2025 & 2033
- Figure 23: North America PGM Industry Revenue (billion), by Country 2025 & 2033
- Figure 24: North America PGM Industry Volume (tons), by Country 2025 & 2033
- Figure 25: North America PGM Industry Revenue Share (%), by Country 2025 & 2033
- Figure 26: North America PGM Industry Volume Share (%), by Country 2025 & 2033
- Figure 27: Europe PGM Industry Revenue (billion), by Metal Type 2025 & 2033
- Figure 28: Europe PGM Industry Volume (tons), by Metal Type 2025 & 2033
- Figure 29: Europe PGM Industry Revenue Share (%), by Metal Type 2025 & 2033
- Figure 30: Europe PGM Industry Volume Share (%), by Metal Type 2025 & 2033
- Figure 31: Europe PGM Industry Revenue (billion), by Application 2025 & 2033
- Figure 32: Europe PGM Industry Volume (tons), by Application 2025 & 2033
- Figure 33: Europe PGM Industry Revenue Share (%), by Application 2025 & 2033
- Figure 34: Europe PGM Industry Volume Share (%), by Application 2025 & 2033
- Figure 35: Europe PGM Industry Revenue (billion), by Country 2025 & 2033
- Figure 36: Europe PGM Industry Volume (tons), by Country 2025 & 2033
- Figure 37: Europe PGM Industry Revenue Share (%), by Country 2025 & 2033
- Figure 38: Europe PGM Industry Volume Share (%), by Country 2025 & 2033
- Figure 39: South America PGM Industry Revenue (billion), by Metal Type 2025 & 2033
- Figure 40: South America PGM Industry Volume (tons), by Metal Type 2025 & 2033
- Figure 41: South America PGM Industry Revenue Share (%), by Metal Type 2025 & 2033
- Figure 42: South America PGM Industry Volume Share (%), by Metal Type 2025 & 2033
- Figure 43: South America PGM Industry Revenue (billion), by Application 2025 & 2033
- Figure 44: South America PGM Industry Volume (tons), by Application 2025 & 2033
- Figure 45: South America PGM Industry Revenue Share (%), by Application 2025 & 2033
- Figure 46: South America PGM Industry Volume Share (%), by Application 2025 & 2033
- Figure 47: South America PGM Industry Revenue (billion), by Country 2025 & 2033
- Figure 48: South America PGM Industry Volume (tons), by Country 2025 & 2033
- Figure 49: South America PGM Industry Revenue Share (%), by Country 2025 & 2033
- Figure 50: South America PGM Industry Volume Share (%), by Country 2025 & 2033
- Figure 51: Middle East and Africa PGM Industry Revenue (billion), by Metal Type 2025 & 2033
- Figure 52: Middle East and Africa PGM Industry Volume (tons), by Metal Type 2025 & 2033
- Figure 53: Middle East and Africa PGM Industry Revenue Share (%), by Metal Type 2025 & 2033
- Figure 54: Middle East and Africa PGM Industry Volume Share (%), by Metal Type 2025 & 2033
- Figure 55: Middle East and Africa PGM Industry Revenue (billion), by Application 2025 & 2033
- Figure 56: Middle East and Africa PGM Industry Volume (tons), by Application 2025 & 2033
- Figure 57: Middle East and Africa PGM Industry Revenue Share (%), by Application 2025 & 2033
- Figure 58: Middle East and Africa PGM Industry Volume Share (%), by Application 2025 & 2033
- Figure 59: Middle East and Africa PGM Industry Revenue (billion), by Country 2025 & 2033
- Figure 60: Middle East and Africa PGM Industry Volume (tons), by Country 2025 & 2033
- Figure 61: Middle East and Africa PGM Industry Revenue Share (%), by Country 2025 & 2033
- Figure 62: Middle East and Africa PGM Industry Volume Share (%), by Country 2025 & 2033
List of Tables
- Table 1: Global PGM Industry Revenue billion Forecast, by Metal Type 2020 & 2033
- Table 2: Global PGM Industry Volume tons Forecast, by Metal Type 2020 & 2033
- Table 3: Global PGM Industry Revenue billion Forecast, by Application 2020 & 2033
- Table 4: Global PGM Industry Volume tons Forecast, by Application 2020 & 2033
- Table 5: Global PGM Industry Revenue billion Forecast, by Region 2020 & 2033
- Table 6: Global PGM Industry Volume tons Forecast, by Region 2020 & 2033
- Table 7: Global PGM Industry Revenue billion Forecast, by Metal Type 2020 & 2033
- Table 8: Global PGM Industry Volume tons Forecast, by Metal Type 2020 & 2033
- Table 9: Global PGM Industry Revenue billion Forecast, by Application 2020 & 2033
- Table 10: Global PGM Industry Volume tons Forecast, by Application 2020 & 2033
- Table 11: Global PGM Industry Revenue billion Forecast, by Country 2020 & 2033
- Table 12: Global PGM Industry Volume tons Forecast, by Country 2020 & 2033
- Table 13: China PGM Industry Revenue (billion) Forecast, by Application 2020 & 2033
- Table 14: China PGM Industry Volume (tons) Forecast, by Application 2020 & 2033
- Table 15: India PGM Industry Revenue (billion) Forecast, by Application 2020 & 2033
- Table 16: India PGM Industry Volume (tons) Forecast, by Application 2020 & 2033
- Table 17: Japan PGM Industry Revenue (billion) Forecast, by Application 2020 & 2033
- Table 18: Japan PGM Industry Volume (tons) Forecast, by Application 2020 & 2033
- Table 19: South Korea PGM Industry Revenue (billion) Forecast, by Application 2020 & 2033
- Table 20: South Korea PGM Industry Volume (tons) Forecast, by Application 2020 & 2033
- Table 21: ASEAN Countries PGM Industry Revenue (billion) Forecast, by Application 2020 & 2033
- Table 22: ASEAN Countries PGM Industry Volume (tons) Forecast, by Application 2020 & 2033
- Table 23: Rest of Asia Pacific PGM Industry Revenue (billion) Forecast, by Application 2020 & 2033
- Table 24: Rest of Asia Pacific PGM Industry Volume (tons) Forecast, by Application 2020 & 2033
- Table 25: Global PGM Industry Revenue billion Forecast, by Metal Type 2020 & 2033
- Table 26: Global PGM Industry Volume tons Forecast, by Metal Type 2020 & 2033
- Table 27: Global PGM Industry Revenue billion Forecast, by Application 2020 & 2033
- Table 28: Global PGM Industry Volume tons Forecast, by Application 2020 & 2033
- Table 29: Global PGM Industry Revenue billion Forecast, by Country 2020 & 2033
- Table 30: Global PGM Industry Volume tons Forecast, by Country 2020 & 2033
- Table 31: United States PGM Industry Revenue (billion) Forecast, by Application 2020 & 2033
- Table 32: United States PGM Industry Volume (tons) Forecast, by Application 2020 & 2033
- Table 33: Canada PGM Industry Revenue (billion) Forecast, by Application 2020 & 2033
- Table 34: Canada PGM Industry Volume (tons) Forecast, by Application 2020 & 2033
- Table 35: Mexico PGM Industry Revenue (billion) Forecast, by Application 2020 & 2033
- Table 36: Mexico PGM Industry Volume (tons) Forecast, by Application 2020 & 2033
- Table 37: Global PGM Industry Revenue billion Forecast, by Metal Type 2020 & 2033
- Table 38: Global PGM Industry Volume tons Forecast, by Metal Type 2020 & 2033
- Table 39: Global PGM Industry Revenue billion Forecast, by Application 2020 & 2033
- Table 40: Global PGM Industry Volume tons Forecast, by Application 2020 & 2033
- Table 41: Global PGM Industry Revenue billion Forecast, by Country 2020 & 2033
- Table 42: Global PGM Industry Volume tons Forecast, by Country 2020 & 2033
- Table 43: Germany PGM Industry Revenue (billion) Forecast, by Application 2020 & 2033
- Table 44: Germany PGM Industry Volume (tons) Forecast, by Application 2020 & 2033
- Table 45: United Kingdom PGM Industry Revenue (billion) Forecast, by Application 2020 & 2033
- Table 46: United Kingdom PGM Industry Volume (tons) Forecast, by Application 2020 & 2033
- Table 47: Italy PGM Industry Revenue (billion) Forecast, by Application 2020 & 2033
- Table 48: Italy PGM Industry Volume (tons) Forecast, by Application 2020 & 2033
- Table 49: France PGM Industry Revenue (billion) Forecast, by Application 2020 & 2033
- Table 50: France PGM Industry Volume (tons) Forecast, by Application 2020 & 2033
- Table 51: Rest of Europe PGM Industry Revenue (billion) Forecast, by Application 2020 & 2033
- Table 52: Rest of Europe PGM Industry Volume (tons) Forecast, by Application 2020 & 2033
- Table 53: Global PGM Industry Revenue billion Forecast, by Metal Type 2020 & 2033
- Table 54: Global PGM Industry Volume tons Forecast, by Metal Type 2020 & 2033
- Table 55: Global PGM Industry Revenue billion Forecast, by Application 2020 & 2033
- Table 56: Global PGM Industry Volume tons Forecast, by Application 2020 & 2033
- Table 57: Global PGM Industry Revenue billion Forecast, by Country 2020 & 2033
- Table 58: Global PGM Industry Volume tons Forecast, by Country 2020 & 2033
- Table 59: Brazil PGM Industry Revenue (billion) Forecast, by Application 2020 & 2033
- Table 60: Brazil PGM Industry Volume (tons) Forecast, by Application 2020 & 2033
- Table 61: Argentina PGM Industry Revenue (billion) Forecast, by Application 2020 & 2033
- Table 62: Argentina PGM Industry Volume (tons) Forecast, by Application 2020 & 2033
- Table 63: Rest of South America PGM Industry Revenue (billion) Forecast, by Application 2020 & 2033
- Table 64: Rest of South America PGM Industry Volume (tons) Forecast, by Application 2020 & 2033
- Table 65: Global PGM Industry Revenue billion Forecast, by Metal Type 2020 & 2033
- Table 66: Global PGM Industry Volume tons Forecast, by Metal Type 2020 & 2033
- Table 67: Global PGM Industry Revenue billion Forecast, by Application 2020 & 2033
- Table 68: Global PGM Industry Volume tons Forecast, by Application 2020 & 2033
- Table 69: Global PGM Industry Revenue billion Forecast, by Country 2020 & 2033
- Table 70: Global PGM Industry Volume tons Forecast, by Country 2020 & 2033
- Table 71: Saudi Arabia PGM Industry Revenue (billion) Forecast, by Application 2020 & 2033
- Table 72: Saudi Arabia PGM Industry Volume (tons) Forecast, by Application 2020 & 2033
- Table 73: South Africa PGM Industry Revenue (billion) Forecast, by Application 2020 & 2033
- Table 74: South Africa PGM Industry Volume (tons) Forecast, by Application 2020 & 2033
- Table 75: Rest of Middle East and Africa PGM Industry Revenue (billion) Forecast, by Application 2020 & 2033
- Table 76: Rest of Middle East and Africa PGM Industry Volume (tons) Forecast, by Application 2020 & 2033
Frequently Asked Questions
1. What is the projected Compound Annual Growth Rate (CAGR) of the PGM Industry?
The projected CAGR is approximately 3.31%.
2. Which companies are prominent players in the PGM Industry?
Key companies in the market include ANGLO AMERICAN PLATINUM LIMITED, Implats Platinum Limited, Vale*List Not Exhaustive, Norilsk Nickel, African Rainbow Minerals Limited, GLENCORE, Northam Platinum Holdings Limited, Johnson Matthey, Sibanye-Stillwater, Platinum Group Metals Ltd.
3. What are the main segments of the PGM Industry?
The market segments include Metal Type, Application.
4. Can you provide details about the market size?
The market size is estimated to be USD 41.59 billion as of 2022.
5. What are some drivers contributing to market growth?
Growing Demand for Catalytic Converters from the Automotive Industry; Increasing Demand for Platinum. Palladium. and Ruthenium from the Electronics Industry; Growing Jewelry Consumption in Asia-Pacific Countries.
6. What are the notable trends driving market growth?
Autocatalysts Segment to Dominate the Market.
7. Are there any restraints impacting market growth?
High Costs Involved in Production and Maintenance; Other Restraints.
8. Can you provide examples of recent developments in the market?
November 2023: Sibanye-Stillwater agreed to acquire Reldan, a metal recycler based in the United States. Reldan is a Pennsylvania-based recycling group that reprocesses various waste streams, including industrial and electronic waste, to recycle green precious metals such as platinum and palladium.
9. What pricing options are available for accessing the report?
Pricing options include single-user, multi-user, and enterprise licenses priced at USD 4750, USD 5250, and USD 8750 respectively.
10. Is the market size provided in terms of value or volume?
The market size is provided in terms of value, measured in billion and volume, measured in tons.
11. Are there any specific market keywords associated with the report?
Yes, the market keyword associated with the report is "PGM Industry," which aids in identifying and referencing the specific market segment covered.
12. How do I determine which pricing option suits my needs best?
The pricing options vary based on user requirements and access needs. Individual users may opt for single-user licenses, while businesses requiring broader access may choose multi-user or enterprise licenses for cost-effective access to the report.
13. Are there any additional resources or data provided in the PGM Industry report?
While the report offers comprehensive insights, it's advisable to review the specific contents or supplementary materials provided to ascertain if additional resources or data are available.
14. How can I stay updated on further developments or reports in the PGM Industry?
To stay informed about further developments, trends, and reports in the PGM Industry, consider subscribing to industry newsletters, following relevant companies and organizations, or regularly checking reputable industry news sources and publications.
Methodology
Step 1 - Identification of Relevant Samples Size from Population Database


Step 2 - Approaches for Defining Global Market Size (Value, Volume* & Price*)

Note*: In applicable scenarios
Step 3 - Data Sources
Primary Research
- Web Analytics
- Survey Reports
- Research Institute
- Latest Research Reports
- Opinion Leaders
Secondary Research
- Annual Reports
- White Paper
- Latest Press Release
- Industry Association
- Paid Database
- Investor Presentations

Step 4 - Data Triangulation
Involves using different sources of information in order to increase the validity of a study
These sources are likely to be stakeholders in a program - participants, other researchers, program staff, other community members, and so on.
Then we put all data in single framework & apply various statistical tools to find out the dynamic on the market.
During the analysis stage, feedback from the stakeholder groups would be compared to determine areas of agreement as well as areas of divergence