

Key Insights
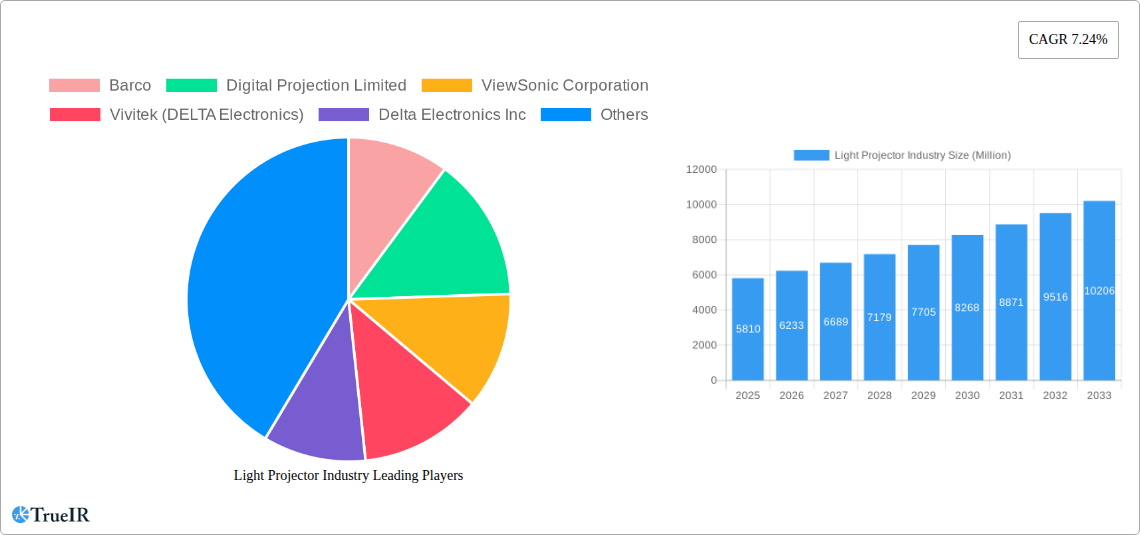
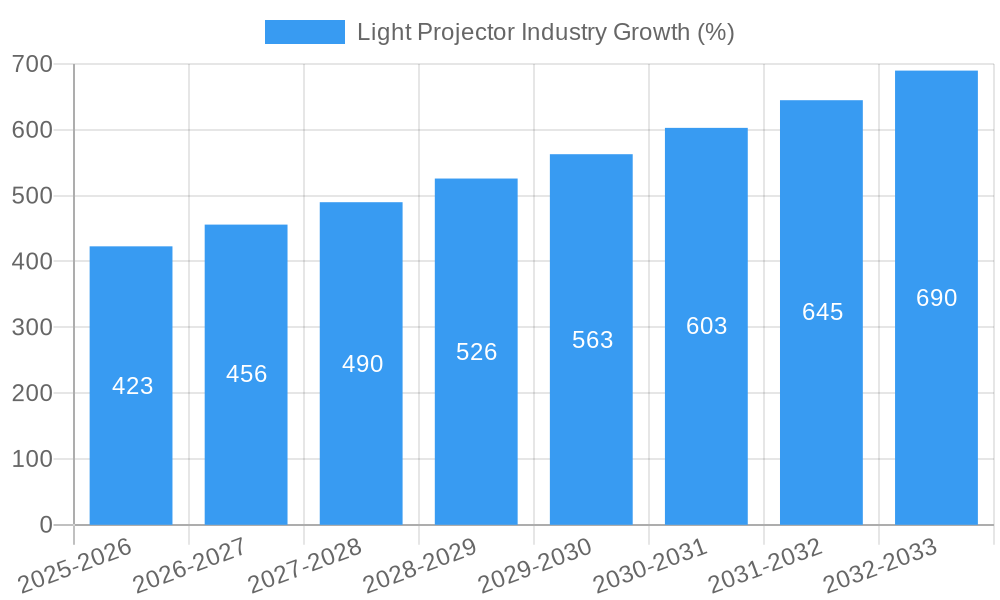
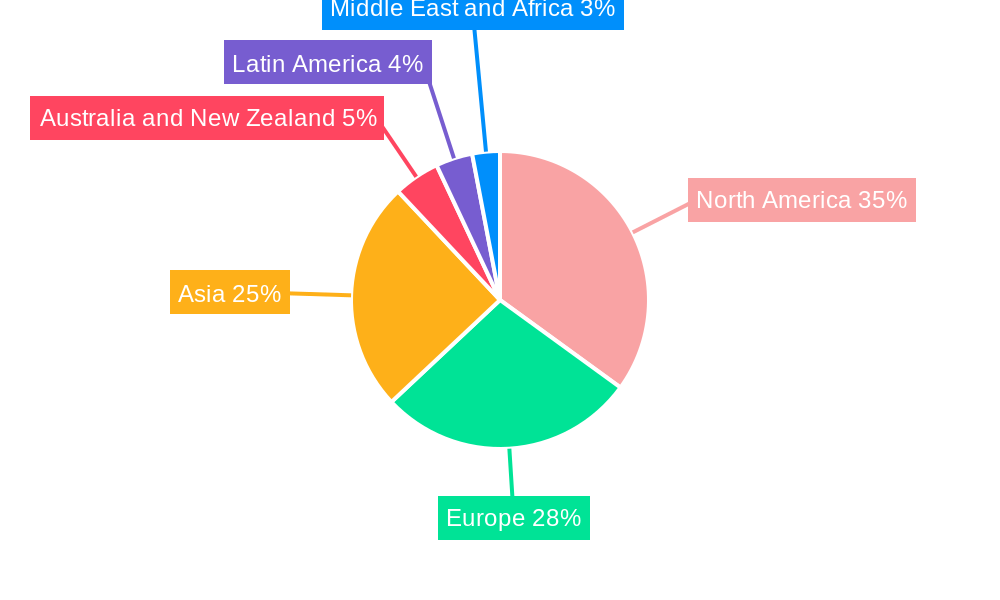
The global light projector market, valued at $5.81 billion in 2025, is projected to experience robust growth, driven by increasing demand across diverse sectors. A Compound Annual Growth Rate (CAGR) of 7.24% from 2025 to 2033 indicates a significant expansion, primarily fueled by advancements in LED and laser technologies offering improved brightness, resolution, and energy efficiency. The shift towards smart classrooms and hybrid work models in education and business sectors is further boosting market growth. The increasing adoption of home theaters and the rising popularity of immersive entertainment experiences are also key drivers. Market segmentation reveals strong growth in LED projectors due to their cost-effectiveness and longer lifespan compared to traditional lamp-based projectors. The short-throw and ultra-short-throw projector segments are experiencing rapid expansion, driven by their space-saving design and ease of use in various applications. While the market faces potential restraints like the high initial cost of high-end models and competition from alternative display technologies, the overall growth trajectory remains positive. The North American and European markets currently hold significant shares, but the Asia-Pacific region is expected to witness the fastest growth owing to its expanding middle class and rising disposable income.
The competitive landscape is characterized by a mix of established players like Barco, BenQ, and Epson, and emerging companies vying for market share. Product innovation, focusing on features like improved portability, enhanced connectivity (Wi-Fi, Bluetooth), and integration with smart home ecosystems, will be crucial for success. Strategic partnerships and mergers and acquisitions are also anticipated to shape the industry dynamics. The increasing focus on sustainability and the development of energy-efficient projectors will play a vital role in influencing consumer choices and driving market growth. Over the forecast period, the market is likely to see further consolidation and an increase in the demand for specialized projectors tailored to niche applications, such as medical imaging and interactive displays. This continued diversification and technological advancement will ensure the sustained growth of the light projector market in the coming years.
Light Projector Industry Market Report: 2019-2033
This comprehensive report provides an in-depth analysis of the global light projector industry, offering valuable insights for businesses, investors, and researchers. With a focus on market trends, competitive dynamics, and future growth potential, this report covers the period from 2019 to 2033, with a base year of 2025 and a forecast period of 2025-2033. The report projects a market size exceeding $XX Billion by 2033. Key players like Barco, Digital Projection Limited, ViewSonic Corporation, and others are analyzed in detail.
Light Projector Industry Market Structure & Competitive Landscape
The light projector market exhibits a moderately concentrated structure, with a handful of major players controlling a significant portion of the global market share. However, the market is also characterized by the presence of numerous smaller players, especially in niche segments. This report analyzes the market concentration through metrics like the Herfindahl-Hirschman Index (HHI) and the four-firm concentration ratio (4-firm CR) for the historical period (2019-2024) and projects these values for the forecast period (2025-2033), revealing the evolving dynamics of market consolidation. Innovation, driven by technological advancements in light source technology (LED, Laser), chip models (One Chip, Three Chip), and throw distance (Normal Throw, Short Throw, Ultra-Short Throw), is a key driver of competition. Regulatory changes concerning energy efficiency and material usage significantly impact manufacturing processes and product development. The increasing availability of substitute technologies, such as large-format displays, poses a challenge to market growth.
The end-user segments—Home Entertainment and Cinema, Business, Education and Government, Large Venues, and Other Applications—show varied growth rates, influenced by technological adoption, budget allocations, and specific application needs. The report assesses the impact of mergers and acquisitions (M&A) activities, including the volume and value of transactions over the study period, on market consolidation and technological integration. A detailed analysis of historical M&A activity (2019-2024) and projections for the forecast period (2025-2033) are included, offering insights into the strategic alliances shaping the competitive landscape. The estimated total M&A volume for the period 2019-2024 was $XX Billion and is projected to reach $XX Billion by 2033.
Light Projector Industry Market Trends & Opportunities
The global light projector market is experiencing significant growth, driven by increasing demand across diverse applications. The Compound Annual Growth Rate (CAGR) for the period 2019-2024 was XX%, and the report projects a CAGR of XX% for the forecast period (2025-2033). This growth is fueled by several factors including the rising adoption of technologically advanced projectors with improved image quality, portability, and features in various sectors. The shift towards LED and laser light sources is driving market penetration rates for energy-efficient and long-lasting projectors. Consumer preferences are increasingly tilting towards higher resolutions, smarter features, and compact designs.
The competitive dynamics are marked by continuous product innovation, strategic partnerships, and geographic expansion by key players. The market penetration rate of laser projectors, for example, is expected to rise from XX% in 2024 to XX% in 2033. The report examines the changing consumer preferences including growing demand for 4K resolution, portable projectors, and smart functionalities. It also meticulously analyzes the competitive strategies employed by leading players which include pricing strategies, new product launches, technological collaborations, and market expansion efforts.
Dominant Markets & Segments in Light Projector Industry
The Asia-Pacific region dominates the global light projector market, driven by strong economic growth, increasing infrastructure development, and high demand from emerging economies. However, North America and Europe are also significant markets, with steady growth projected throughout the forecast period.
By Light Source: The LED segment is experiencing the fastest growth, due to its cost-effectiveness and energy efficiency compared to traditional lamp-based projectors. Laser technology is gaining traction in high-end applications, offering superior brightness and color accuracy. The Lamp segment, while mature, retains a significant market share, particularly in budget-conscious segments.
By Chip Model: Three-chip DLP projectors maintain dominance in high-end applications due to their superior color performance, while one-chip DLP projectors cater to the more price-sensitive segments.
By Throw Distance: Short-throw and ultra-short-throw projectors are rapidly gaining popularity, particularly in educational and business settings, due to their space-saving capabilities and ease of installation.
By Application: The Business sector displays robust growth driven by the increasing adoption of projectors in corporate meetings, presentations, and training sessions. The Education and Government sector represents a significant market, with consistent demand for interactive projectors in classrooms and public venues. The Home Entertainment and Cinema segment, while mature, demonstrates consistent demand for high-quality home theater projectors.
Key growth drivers vary across segments. Infrastructure investments play a significant role in Large Venues, while government policies supporting education and technological advancement bolster the Education and Government sector.
Light Projector Industry Product Analysis
Recent product innovations focus on enhancing image quality (higher resolutions, improved color accuracy), improving energy efficiency (LED and laser light sources), and increasing user-friendliness (integrated smart features, simplified installation). The competitive advantages stem from offering superior image quality, longer lifespan, enhanced features, and cost-effectiveness, all tailored to specific applications. This leads to a wider array of models, from compact and portable units for home use to sophisticated large-venue projectors with advanced features, each with a defined target market. The market is highly competitive and requires continuous innovation to remain relevant.
Key Drivers, Barriers & Challenges in Light Projector Industry
Key Drivers:
Technological advancements in light sources (LED, laser), chip technology, and display resolutions are primary growth drivers. Economic factors like increased disposable incomes and rising investments in infrastructure (especially in emerging economies) also fuel demand. Favorable government policies promoting digitalization and education further bolster market growth.
Key Challenges:
Supply chain disruptions (component shortages, logistical delays) have led to production bottlenecks and price fluctuations, impacting profitability. Increasing competition, both from established players and new entrants, puts pressure on pricing and margins. Stringent regulatory requirements, concerning energy consumption and environmental impact, increase compliance costs for manufacturers. These factors lead to fluctuating market stability and require proactive adaptations from industry players.
Growth Drivers in the Light Projector Industry Market
Technological advancements (higher resolutions, improved light sources), increasing disposable income driving consumer spending, and rising investments in infrastructure (especially in emerging economies) are key drivers. Government initiatives promoting digital literacy and educational infrastructure further stimulate growth.
Challenges Impacting Light Projector Industry Growth
Supply chain constraints (raw material shortages, logistical bottlenecks), intensifying competition from established and new players, and stringent environmental regulations impacting production costs pose significant challenges. Economic downturns can also curb demand, especially in discretionary sectors.
Key Players Shaping the Light Projector Industry Market
- Barco
- Digital Projection Limited
- ViewSonic Corporation
- Vivitek (DELTA Electronics)
- Delta Electronics Inc
- Acer Inc
- Texas Instruments Inc
- BenQ Corporation
- Panasonic Corporation
- Optoma Corporation (Coretronic Corp)
- NEC Corporation
- Sharp Corporation
Significant Light Projector Industry Milestones
- February 2023: Digital Projection International received the TNT (Top New Technologies) award from CE Pro magazine for its HIGHlite 4K UHD Reference Satellite Modular Light Source (MLS) projection system. This highlights the ongoing innovation in high-end projector technology and its market recognition.
- January 2023: Epson announced the launch of new projectors and visual solutions, showcasing a strong commitment to diverse market segments (business, education) and indicating a positive outlook for short-throw and laser projector technologies.
Future Outlook for Light Projector Industry Market
The light projector market is poised for continued growth, driven by ongoing technological innovation, increasing demand across various sectors, and expansion into new applications. Strategic opportunities lie in developing energy-efficient, high-resolution projectors with advanced smart features. The market's potential is substantial, particularly in emerging markets with growing infrastructure investments and expanding digitalization efforts.
Light Projector Industry Segmentation
-
1. Light Source
- 1.1. Lamp
- 1.2. LED
- 1.3. Laser
-
2. Chip Model
- 2.1. One Chip
- 2.2. Three Chip
-
3. Throw Distance
- 3.1. Normal Throw
- 3.2. Short Throw
- 3.3. Ultra-Short Throw
-
4. Application
- 4.1. Home Entertainment and Cinema
- 4.2. Business
- 4.3. Education and Government
- 4.4. Large Venues
- 4.5. Other Applications
Light Projector Industry Segmentation By Geography
- 1. North America
- 2. Europe
- 3. Asia
- 4. Australia and New Zealand
- 5. Latin America
- 6. Middle East and Africa
Light Projector Industry REPORT HIGHLIGHTS
| Aspects | Details |
|---|---|
| Study Period | 2019-2033 |
| Base Year | 2024 |
| Estimated Year | 2025 |
| Forecast Period | 2025-2033 |
| Historical Period | 2019-2024 |
| Growth Rate | CAGR of 7.24% from 2019-2033 |
| Segmentation |
|
Table of Contents
- 1. Introduction
- 1.1. Research Scope
- 1.2. Market Segmentation
- 1.3. Research Methodology
- 1.4. Definitions and Assumptions
- 2. Executive Summary
- 2.1. Introduction
- 3. Market Dynamics
- 3.1. Introduction
- 3.2. Market Drivers
- 3.2.1. Increment in the Demand of DLP Projector in the Entertainment Industry; Increasing Digitalization Process in the Education Sector
- 3.3. Market Restrains
- 3.3.1 High Cost and Lack of Knowledge; Stiff Competition from Other Projection Technologies such as LCD
- 3.3.2 LCOS
- 3.4. Market Trends
- 3.4.1. Increasing Demand of DLP Projector in the Home Entertainment and Cinema Industry to Drive the Market
- 4. Market Factor Analysis
- 4.1. Porters Five Forces
- 4.2. Supply/Value Chain
- 4.3. PESTEL analysis
- 4.4. Market Entropy
- 4.5. Patent/Trademark Analysis
- 5. Global Light Projector Industry Analysis, Insights and Forecast, 2019-2031
- 5.1. Market Analysis, Insights and Forecast - by Light Source
- 5.1.1. Lamp
- 5.1.2. LED
- 5.1.3. Laser
- 5.2. Market Analysis, Insights and Forecast - by Chip Model
- 5.2.1. One Chip
- 5.2.2. Three Chip
- 5.3. Market Analysis, Insights and Forecast - by Throw Distance
- 5.3.1. Normal Throw
- 5.3.2. Short Throw
- 5.3.3. Ultra-Short Throw
- 5.4. Market Analysis, Insights and Forecast - by Application
- 5.4.1. Home Entertainment and Cinema
- 5.4.2. Business
- 5.4.3. Education and Government
- 5.4.4. Large Venues
- 5.4.5. Other Applications
- 5.5. Market Analysis, Insights and Forecast - by Region
- 5.5.1. North America
- 5.5.2. Europe
- 5.5.3. Asia
- 5.5.4. Australia and New Zealand
- 5.5.5. Latin America
- 5.5.6. Middle East and Africa
- 5.1. Market Analysis, Insights and Forecast - by Light Source
- 6. North America Light Projector Industry Analysis, Insights and Forecast, 2019-2031
- 6.1. Market Analysis, Insights and Forecast - by Light Source
- 6.1.1. Lamp
- 6.1.2. LED
- 6.1.3. Laser
- 6.2. Market Analysis, Insights and Forecast - by Chip Model
- 6.2.1. One Chip
- 6.2.2. Three Chip
- 6.3. Market Analysis, Insights and Forecast - by Throw Distance
- 6.3.1. Normal Throw
- 6.3.2. Short Throw
- 6.3.3. Ultra-Short Throw
- 6.4. Market Analysis, Insights and Forecast - by Application
- 6.4.1. Home Entertainment and Cinema
- 6.4.2. Business
- 6.4.3. Education and Government
- 6.4.4. Large Venues
- 6.4.5. Other Applications
- 6.1. Market Analysis, Insights and Forecast - by Light Source
- 7. Europe Light Projector Industry Analysis, Insights and Forecast, 2019-2031
- 7.1. Market Analysis, Insights and Forecast - by Light Source
- 7.1.1. Lamp
- 7.1.2. LED
- 7.1.3. Laser
- 7.2. Market Analysis, Insights and Forecast - by Chip Model
- 7.2.1. One Chip
- 7.2.2. Three Chip
- 7.3. Market Analysis, Insights and Forecast - by Throw Distance
- 7.3.1. Normal Throw
- 7.3.2. Short Throw
- 7.3.3. Ultra-Short Throw
- 7.4. Market Analysis, Insights and Forecast - by Application
- 7.4.1. Home Entertainment and Cinema
- 7.4.2. Business
- 7.4.3. Education and Government
- 7.4.4. Large Venues
- 7.4.5. Other Applications
- 7.1. Market Analysis, Insights and Forecast - by Light Source
- 8. Asia Light Projector Industry Analysis, Insights and Forecast, 2019-2031
- 8.1. Market Analysis, Insights and Forecast - by Light Source
- 8.1.1. Lamp
- 8.1.2. LED
- 8.1.3. Laser
- 8.2. Market Analysis, Insights and Forecast - by Chip Model
- 8.2.1. One Chip
- 8.2.2. Three Chip
- 8.3. Market Analysis, Insights and Forecast - by Throw Distance
- 8.3.1. Normal Throw
- 8.3.2. Short Throw
- 8.3.3. Ultra-Short Throw
- 8.4. Market Analysis, Insights and Forecast - by Application
- 8.4.1. Home Entertainment and Cinema
- 8.4.2. Business
- 8.4.3. Education and Government
- 8.4.4. Large Venues
- 8.4.5. Other Applications
- 8.1. Market Analysis, Insights and Forecast - by Light Source
- 9. Australia and New Zealand Light Projector Industry Analysis, Insights and Forecast, 2019-2031
- 9.1. Market Analysis, Insights and Forecast - by Light Source
- 9.1.1. Lamp
- 9.1.2. LED
- 9.1.3. Laser
- 9.2. Market Analysis, Insights and Forecast - by Chip Model
- 9.2.1. One Chip
- 9.2.2. Three Chip
- 9.3. Market Analysis, Insights and Forecast - by Throw Distance
- 9.3.1. Normal Throw
- 9.3.2. Short Throw
- 9.3.3. Ultra-Short Throw
- 9.4. Market Analysis, Insights and Forecast - by Application
- 9.4.1. Home Entertainment and Cinema
- 9.4.2. Business
- 9.4.3. Education and Government
- 9.4.4. Large Venues
- 9.4.5. Other Applications
- 9.1. Market Analysis, Insights and Forecast - by Light Source
- 10. Latin America Light Projector Industry Analysis, Insights and Forecast, 2019-2031
- 10.1. Market Analysis, Insights and Forecast - by Light Source
- 10.1.1. Lamp
- 10.1.2. LED
- 10.1.3. Laser
- 10.2. Market Analysis, Insights and Forecast - by Chip Model
- 10.2.1. One Chip
- 10.2.2. Three Chip
- 10.3. Market Analysis, Insights and Forecast - by Throw Distance
- 10.3.1. Normal Throw
- 10.3.2. Short Throw
- 10.3.3. Ultra-Short Throw
- 10.4. Market Analysis, Insights and Forecast - by Application
- 10.4.1. Home Entertainment and Cinema
- 10.4.2. Business
- 10.4.3. Education and Government
- 10.4.4. Large Venues
- 10.4.5. Other Applications
- 10.1. Market Analysis, Insights and Forecast - by Light Source
- 11. Middle East and Africa Light Projector Industry Analysis, Insights and Forecast, 2019-2031
- 11.1. Market Analysis, Insights and Forecast - by Light Source
- 11.1.1. Lamp
- 11.1.2. LED
- 11.1.3. Laser
- 11.2. Market Analysis, Insights and Forecast - by Chip Model
- 11.2.1. One Chip
- 11.2.2. Three Chip
- 11.3. Market Analysis, Insights and Forecast - by Throw Distance
- 11.3.1. Normal Throw
- 11.3.2. Short Throw
- 11.3.3. Ultra-Short Throw
- 11.4. Market Analysis, Insights and Forecast - by Application
- 11.4.1. Home Entertainment and Cinema
- 11.4.2. Business
- 11.4.3. Education and Government
- 11.4.4. Large Venues
- 11.4.5. Other Applications
- 11.1. Market Analysis, Insights and Forecast - by Light Source
- 12. North America Light Projector Industry Analysis, Insights and Forecast, 2019-2031
- 12.1. Market Analysis, Insights and Forecast - By Country/Sub-region
- 12.1.1.
- 13. Europe Light Projector Industry Analysis, Insights and Forecast, 2019-2031
- 13.1. Market Analysis, Insights and Forecast - By Country/Sub-region
- 13.1.1.
- 14. Asia Light Projector Industry Analysis, Insights and Forecast, 2019-2031
- 14.1. Market Analysis, Insights and Forecast - By Country/Sub-region
- 14.1.1.
- 15. Australia and New Zealand Light Projector Industry Analysis, Insights and Forecast, 2019-2031
- 15.1. Market Analysis, Insights and Forecast - By Country/Sub-region
- 15.1.1.
- 16. Latin America Light Projector Industry Analysis, Insights and Forecast, 2019-2031
- 16.1. Market Analysis, Insights and Forecast - By Country/Sub-region
- 16.1.1.
- 17. Middle East and Africa Light Projector Industry Analysis, Insights and Forecast, 2019-2031
- 17.1. Market Analysis, Insights and Forecast - By Country/Sub-region
- 17.1.1.
- 18. Competitive Analysis
- 18.1. Global Market Share Analysis 2024
- 18.2. Company Profiles
- 18.2.1 Barco
- 18.2.1.1. Overview
- 18.2.1.2. Products
- 18.2.1.3. SWOT Analysis
- 18.2.1.4. Recent Developments
- 18.2.1.5. Financials (Based on Availability)
- 18.2.2 Digital Projection Limited
- 18.2.2.1. Overview
- 18.2.2.2. Products
- 18.2.2.3. SWOT Analysis
- 18.2.2.4. Recent Developments
- 18.2.2.5. Financials (Based on Availability)
- 18.2.3 ViewSonic Corporation
- 18.2.3.1. Overview
- 18.2.3.2. Products
- 18.2.3.3. SWOT Analysis
- 18.2.3.4. Recent Developments
- 18.2.3.5. Financials (Based on Availability)
- 18.2.4 Vivitek (DELTA Electronics)
- 18.2.4.1. Overview
- 18.2.4.2. Products
- 18.2.4.3. SWOT Analysis
- 18.2.4.4. Recent Developments
- 18.2.4.5. Financials (Based on Availability)
- 18.2.5 Delta Electronics Inc
- 18.2.5.1. Overview
- 18.2.5.2. Products
- 18.2.5.3. SWOT Analysis
- 18.2.5.4. Recent Developments
- 18.2.5.5. Financials (Based on Availability)
- 18.2.6 Acer Inc
- 18.2.6.1. Overview
- 18.2.6.2. Products
- 18.2.6.3. SWOT Analysis
- 18.2.6.4. Recent Developments
- 18.2.6.5. Financials (Based on Availability)
- 18.2.7 Texas Instruments Inc
- 18.2.7.1. Overview
- 18.2.7.2. Products
- 18.2.7.3. SWOT Analysis
- 18.2.7.4. Recent Developments
- 18.2.7.5. Financials (Based on Availability)
- 18.2.8 BenQ Corporation
- 18.2.8.1. Overview
- 18.2.8.2. Products
- 18.2.8.3. SWOT Analysis
- 18.2.8.4. Recent Developments
- 18.2.8.5. Financials (Based on Availability)
- 18.2.9 Panasonic Corporation*List Not Exhaustive
- 18.2.9.1. Overview
- 18.2.9.2. Products
- 18.2.9.3. SWOT Analysis
- 18.2.9.4. Recent Developments
- 18.2.9.5. Financials (Based on Availability)
- 18.2.10 Optoma Corporation (Coretronic Corp )
- 18.2.10.1. Overview
- 18.2.10.2. Products
- 18.2.10.3. SWOT Analysis
- 18.2.10.4. Recent Developments
- 18.2.10.5. Financials (Based on Availability)
- 18.2.11 NEC Corporation
- 18.2.11.1. Overview
- 18.2.11.2. Products
- 18.2.11.3. SWOT Analysis
- 18.2.11.4. Recent Developments
- 18.2.11.5. Financials (Based on Availability)
- 18.2.12 Sharp Corporation
- 18.2.12.1. Overview
- 18.2.12.2. Products
- 18.2.12.3. SWOT Analysis
- 18.2.12.4. Recent Developments
- 18.2.12.5. Financials (Based on Availability)
- 18.2.1 Barco
List of Figures
- Figure 1: Global Light Projector Industry Revenue Breakdown (Million, %) by Region 2024 & 2032
- Figure 2: North America Light Projector Industry Revenue (Million), by Country 2024 & 2032
- Figure 3: North America Light Projector Industry Revenue Share (%), by Country 2024 & 2032
- Figure 4: Europe Light Projector Industry Revenue (Million), by Country 2024 & 2032
- Figure 5: Europe Light Projector Industry Revenue Share (%), by Country 2024 & 2032
- Figure 6: Asia Light Projector Industry Revenue (Million), by Country 2024 & 2032
- Figure 7: Asia Light Projector Industry Revenue Share (%), by Country 2024 & 2032
- Figure 8: Australia and New Zealand Light Projector Industry Revenue (Million), by Country 2024 & 2032
- Figure 9: Australia and New Zealand Light Projector Industry Revenue Share (%), by Country 2024 & 2032
- Figure 10: Latin America Light Projector Industry Revenue (Million), by Country 2024 & 2032
- Figure 11: Latin America Light Projector Industry Revenue Share (%), by Country 2024 & 2032
- Figure 12: Middle East and Africa Light Projector Industry Revenue (Million), by Country 2024 & 2032
- Figure 13: Middle East and Africa Light Projector Industry Revenue Share (%), by Country 2024 & 2032
- Figure 14: North America Light Projector Industry Revenue (Million), by Light Source 2024 & 2032
- Figure 15: North America Light Projector Industry Revenue Share (%), by Light Source 2024 & 2032
- Figure 16: North America Light Projector Industry Revenue (Million), by Chip Model 2024 & 2032
- Figure 17: North America Light Projector Industry Revenue Share (%), by Chip Model 2024 & 2032
- Figure 18: North America Light Projector Industry Revenue (Million), by Throw Distance 2024 & 2032
- Figure 19: North America Light Projector Industry Revenue Share (%), by Throw Distance 2024 & 2032
- Figure 20: North America Light Projector Industry Revenue (Million), by Application 2024 & 2032
- Figure 21: North America Light Projector Industry Revenue Share (%), by Application 2024 & 2032
- Figure 22: North America Light Projector Industry Revenue (Million), by Country 2024 & 2032
- Figure 23: North America Light Projector Industry Revenue Share (%), by Country 2024 & 2032
- Figure 24: Europe Light Projector Industry Revenue (Million), by Light Source 2024 & 2032
- Figure 25: Europe Light Projector Industry Revenue Share (%), by Light Source 2024 & 2032
- Figure 26: Europe Light Projector Industry Revenue (Million), by Chip Model 2024 & 2032
- Figure 27: Europe Light Projector Industry Revenue Share (%), by Chip Model 2024 & 2032
- Figure 28: Europe Light Projector Industry Revenue (Million), by Throw Distance 2024 & 2032
- Figure 29: Europe Light Projector Industry Revenue Share (%), by Throw Distance 2024 & 2032
- Figure 30: Europe Light Projector Industry Revenue (Million), by Application 2024 & 2032
- Figure 31: Europe Light Projector Industry Revenue Share (%), by Application 2024 & 2032
- Figure 32: Europe Light Projector Industry Revenue (Million), by Country 2024 & 2032
- Figure 33: Europe Light Projector Industry Revenue Share (%), by Country 2024 & 2032
- Figure 34: Asia Light Projector Industry Revenue (Million), by Light Source 2024 & 2032
- Figure 35: Asia Light Projector Industry Revenue Share (%), by Light Source 2024 & 2032
- Figure 36: Asia Light Projector Industry Revenue (Million), by Chip Model 2024 & 2032
- Figure 37: Asia Light Projector Industry Revenue Share (%), by Chip Model 2024 & 2032
- Figure 38: Asia Light Projector Industry Revenue (Million), by Throw Distance 2024 & 2032
- Figure 39: Asia Light Projector Industry Revenue Share (%), by Throw Distance 2024 & 2032
- Figure 40: Asia Light Projector Industry Revenue (Million), by Application 2024 & 2032
- Figure 41: Asia Light Projector Industry Revenue Share (%), by Application 2024 & 2032
- Figure 42: Asia Light Projector Industry Revenue (Million), by Country 2024 & 2032
- Figure 43: Asia Light Projector Industry Revenue Share (%), by Country 2024 & 2032
- Figure 44: Australia and New Zealand Light Projector Industry Revenue (Million), by Light Source 2024 & 2032
- Figure 45: Australia and New Zealand Light Projector Industry Revenue Share (%), by Light Source 2024 & 2032
- Figure 46: Australia and New Zealand Light Projector Industry Revenue (Million), by Chip Model 2024 & 2032
- Figure 47: Australia and New Zealand Light Projector Industry Revenue Share (%), by Chip Model 2024 & 2032
- Figure 48: Australia and New Zealand Light Projector Industry Revenue (Million), by Throw Distance 2024 & 2032
- Figure 49: Australia and New Zealand Light Projector Industry Revenue Share (%), by Throw Distance 2024 & 2032
- Figure 50: Australia and New Zealand Light Projector Industry Revenue (Million), by Application 2024 & 2032
- Figure 51: Australia and New Zealand Light Projector Industry Revenue Share (%), by Application 2024 & 2032
- Figure 52: Australia and New Zealand Light Projector Industry Revenue (Million), by Country 2024 & 2032
- Figure 53: Australia and New Zealand Light Projector Industry Revenue Share (%), by Country 2024 & 2032
- Figure 54: Latin America Light Projector Industry Revenue (Million), by Light Source 2024 & 2032
- Figure 55: Latin America Light Projector Industry Revenue Share (%), by Light Source 2024 & 2032
- Figure 56: Latin America Light Projector Industry Revenue (Million), by Chip Model 2024 & 2032
- Figure 57: Latin America Light Projector Industry Revenue Share (%), by Chip Model 2024 & 2032
- Figure 58: Latin America Light Projector Industry Revenue (Million), by Throw Distance 2024 & 2032
- Figure 59: Latin America Light Projector Industry Revenue Share (%), by Throw Distance 2024 & 2032
- Figure 60: Latin America Light Projector Industry Revenue (Million), by Application 2024 & 2032
- Figure 61: Latin America Light Projector Industry Revenue Share (%), by Application 2024 & 2032
- Figure 62: Latin America Light Projector Industry Revenue (Million), by Country 2024 & 2032
- Figure 63: Latin America Light Projector Industry Revenue Share (%), by Country 2024 & 2032
- Figure 64: Middle East and Africa Light Projector Industry Revenue (Million), by Light Source 2024 & 2032
- Figure 65: Middle East and Africa Light Projector Industry Revenue Share (%), by Light Source 2024 & 2032
- Figure 66: Middle East and Africa Light Projector Industry Revenue (Million), by Chip Model 2024 & 2032
- Figure 67: Middle East and Africa Light Projector Industry Revenue Share (%), by Chip Model 2024 & 2032
- Figure 68: Middle East and Africa Light Projector Industry Revenue (Million), by Throw Distance 2024 & 2032
- Figure 69: Middle East and Africa Light Projector Industry Revenue Share (%), by Throw Distance 2024 & 2032
- Figure 70: Middle East and Africa Light Projector Industry Revenue (Million), by Application 2024 & 2032
- Figure 71: Middle East and Africa Light Projector Industry Revenue Share (%), by Application 2024 & 2032
- Figure 72: Middle East and Africa Light Projector Industry Revenue (Million), by Country 2024 & 2032
- Figure 73: Middle East and Africa Light Projector Industry Revenue Share (%), by Country 2024 & 2032
List of Tables
- Table 1: Global Light Projector Industry Revenue Million Forecast, by Region 2019 & 2032
- Table 2: Global Light Projector Industry Revenue Million Forecast, by Light Source 2019 & 2032
- Table 3: Global Light Projector Industry Revenue Million Forecast, by Chip Model 2019 & 2032
- Table 4: Global Light Projector Industry Revenue Million Forecast, by Throw Distance 2019 & 2032
- Table 5: Global Light Projector Industry Revenue Million Forecast, by Application 2019 & 2032
- Table 6: Global Light Projector Industry Revenue Million Forecast, by Region 2019 & 2032
- Table 7: Global Light Projector Industry Revenue Million Forecast, by Country 2019 & 2032
- Table 8: Light Projector Industry Revenue (Million) Forecast, by Application 2019 & 2032
- Table 9: Global Light Projector Industry Revenue Million Forecast, by Country 2019 & 2032
- Table 10: Light Projector Industry Revenue (Million) Forecast, by Application 2019 & 2032
- Table 11: Global Light Projector Industry Revenue Million Forecast, by Country 2019 & 2032
- Table 12: Light Projector Industry Revenue (Million) Forecast, by Application 2019 & 2032
- Table 13: Global Light Projector Industry Revenue Million Forecast, by Country 2019 & 2032
- Table 14: Light Projector Industry Revenue (Million) Forecast, by Application 2019 & 2032
- Table 15: Global Light Projector Industry Revenue Million Forecast, by Country 2019 & 2032
- Table 16: Light Projector Industry Revenue (Million) Forecast, by Application 2019 & 2032
- Table 17: Global Light Projector Industry Revenue Million Forecast, by Country 2019 & 2032
- Table 18: Light Projector Industry Revenue (Million) Forecast, by Application 2019 & 2032
- Table 19: Global Light Projector Industry Revenue Million Forecast, by Light Source 2019 & 2032
- Table 20: Global Light Projector Industry Revenue Million Forecast, by Chip Model 2019 & 2032
- Table 21: Global Light Projector Industry Revenue Million Forecast, by Throw Distance 2019 & 2032
- Table 22: Global Light Projector Industry Revenue Million Forecast, by Application 2019 & 2032
- Table 23: Global Light Projector Industry Revenue Million Forecast, by Country 2019 & 2032
- Table 24: Global Light Projector Industry Revenue Million Forecast, by Light Source 2019 & 2032
- Table 25: Global Light Projector Industry Revenue Million Forecast, by Chip Model 2019 & 2032
- Table 26: Global Light Projector Industry Revenue Million Forecast, by Throw Distance 2019 & 2032
- Table 27: Global Light Projector Industry Revenue Million Forecast, by Application 2019 & 2032
- Table 28: Global Light Projector Industry Revenue Million Forecast, by Country 2019 & 2032
- Table 29: Global Light Projector Industry Revenue Million Forecast, by Light Source 2019 & 2032
- Table 30: Global Light Projector Industry Revenue Million Forecast, by Chip Model 2019 & 2032
- Table 31: Global Light Projector Industry Revenue Million Forecast, by Throw Distance 2019 & 2032
- Table 32: Global Light Projector Industry Revenue Million Forecast, by Application 2019 & 2032
- Table 33: Global Light Projector Industry Revenue Million Forecast, by Country 2019 & 2032
- Table 34: Global Light Projector Industry Revenue Million Forecast, by Light Source 2019 & 2032
- Table 35: Global Light Projector Industry Revenue Million Forecast, by Chip Model 2019 & 2032
- Table 36: Global Light Projector Industry Revenue Million Forecast, by Throw Distance 2019 & 2032
- Table 37: Global Light Projector Industry Revenue Million Forecast, by Application 2019 & 2032
- Table 38: Global Light Projector Industry Revenue Million Forecast, by Country 2019 & 2032
- Table 39: Global Light Projector Industry Revenue Million Forecast, by Light Source 2019 & 2032
- Table 40: Global Light Projector Industry Revenue Million Forecast, by Chip Model 2019 & 2032
- Table 41: Global Light Projector Industry Revenue Million Forecast, by Throw Distance 2019 & 2032
- Table 42: Global Light Projector Industry Revenue Million Forecast, by Application 2019 & 2032
- Table 43: Global Light Projector Industry Revenue Million Forecast, by Country 2019 & 2032
- Table 44: Global Light Projector Industry Revenue Million Forecast, by Light Source 2019 & 2032
- Table 45: Global Light Projector Industry Revenue Million Forecast, by Chip Model 2019 & 2032
- Table 46: Global Light Projector Industry Revenue Million Forecast, by Throw Distance 2019 & 2032
- Table 47: Global Light Projector Industry Revenue Million Forecast, by Application 2019 & 2032
- Table 48: Global Light Projector Industry Revenue Million Forecast, by Country 2019 & 2032
Frequently Asked Questions
1. What is the projected Compound Annual Growth Rate (CAGR) of the Light Projector Industry?
The projected CAGR is approximately 7.24%.
2. Which companies are prominent players in the Light Projector Industry?
Key companies in the market include Barco, Digital Projection Limited, ViewSonic Corporation, Vivitek (DELTA Electronics), Delta Electronics Inc, Acer Inc, Texas Instruments Inc, BenQ Corporation, Panasonic Corporation*List Not Exhaustive, Optoma Corporation (Coretronic Corp ), NEC Corporation, Sharp Corporation.
3. What are the main segments of the Light Projector Industry?
The market segments include Light Source, Chip Model, Throw Distance, Application.
4. Can you provide details about the market size?
The market size is estimated to be USD 5.81 Million as of 2022.
5. What are some drivers contributing to market growth?
Increment in the Demand of DLP Projector in the Entertainment Industry; Increasing Digitalization Process in the Education Sector.
6. What are the notable trends driving market growth?
Increasing Demand of DLP Projector in the Home Entertainment and Cinema Industry to Drive the Market.
7. Are there any restraints impacting market growth?
High Cost and Lack of Knowledge; Stiff Competition from Other Projection Technologies such as LCD. LCOS.
8. Can you provide examples of recent developments in the market?
February 2023 - Digital Projection International received the coveted TNT (Top New Technologies) award from CE Pro magazine for its HIGHlite 4K UHD Reference Satellite Modular Light Source (MLS) projection system.
9. What pricing options are available for accessing the report?
Pricing options include single-user, multi-user, and enterprise licenses priced at USD 4750, USD 5250, and USD 8750 respectively.
10. Is the market size provided in terms of value or volume?
The market size is provided in terms of value, measured in Million.
11. Are there any specific market keywords associated with the report?
Yes, the market keyword associated with the report is "Light Projector Industry," which aids in identifying and referencing the specific market segment covered.
12. How do I determine which pricing option suits my needs best?
The pricing options vary based on user requirements and access needs. Individual users may opt for single-user licenses, while businesses requiring broader access may choose multi-user or enterprise licenses for cost-effective access to the report.
13. Are there any additional resources or data provided in the Light Projector Industry report?
While the report offers comprehensive insights, it's advisable to review the specific contents or supplementary materials provided to ascertain if additional resources or data are available.
14. How can I stay updated on further developments or reports in the Light Projector Industry?
To stay informed about further developments, trends, and reports in the Light Projector Industry, consider subscribing to industry newsletters, following relevant companies and organizations, or regularly checking reputable industry news sources and publications.
Methodology
Step 1 - Identification of Relevant Samples Size from Population Database


Step 2 - Approaches for Defining Global Market Size (Value, Volume* & Price*)

Note*: In applicable scenarios
Step 3 - Data Sources
Primary Research
- Web Analytics
- Survey Reports
- Research Institute
- Latest Research Reports
- Opinion Leaders
Secondary Research
- Annual Reports
- White Paper
- Latest Press Release
- Industry Association
- Paid Database
- Investor Presentations

Step 4 - Data Triangulation
Involves using different sources of information in order to increase the validity of a study
These sources are likely to be stakeholders in a program - participants, other researchers, program staff, other community members, and so on.
Then we put all data in single framework & apply various statistical tools to find out the dynamic on the market.
During the analysis stage, feedback from the stakeholder groups would be compared to determine areas of agreement as well as areas of divergence
