

Key Insights
The marine battery market is poised for substantial growth, driven by the increasing demand for sustainable and efficient maritime power solutions. A projected Compound Annual Growth Rate (CAGR) of 17.89% from 2025 to 2033 underscores this upward trajectory. Key growth drivers include stringent global emission regulations promoting cleaner energy adoption, the rising popularity of hybrid and electric vessels across commercial and recreational segments, and continuous advancements in battery technology enhancing energy density, lifespan, and safety. Lithium-ion batteries lead market adoption due to their superior performance over traditional lead-acid alternatives, while fuel cells and nickel-cadmium technologies serve niche applications. The commercial shipping segment dominates market share, driven by economic and environmental benefits. The defense sector represents a significant growth opportunity with increasing adoption of advanced propulsion systems in military vessels requiring high reliability.
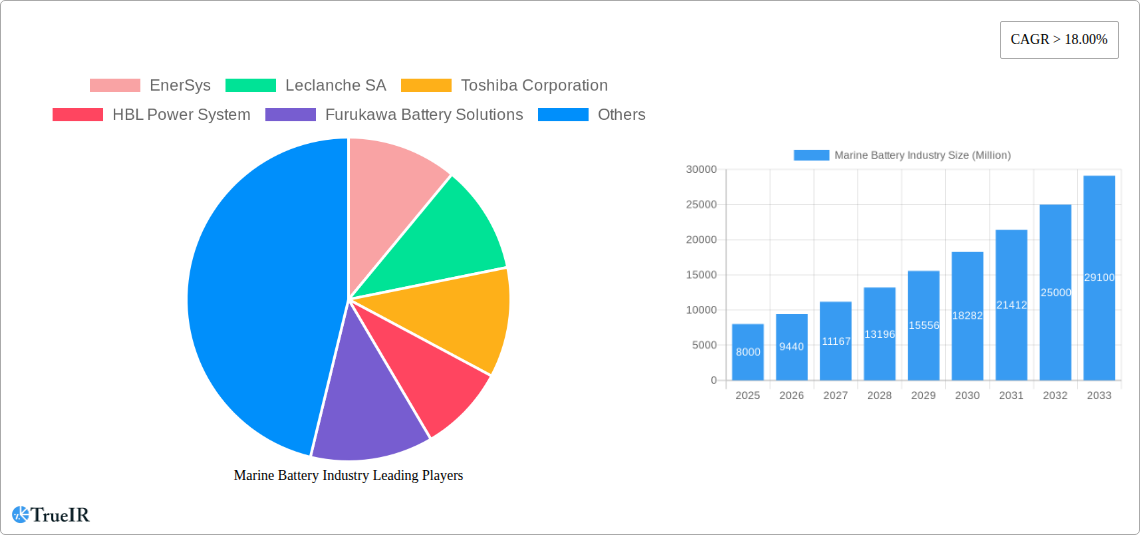
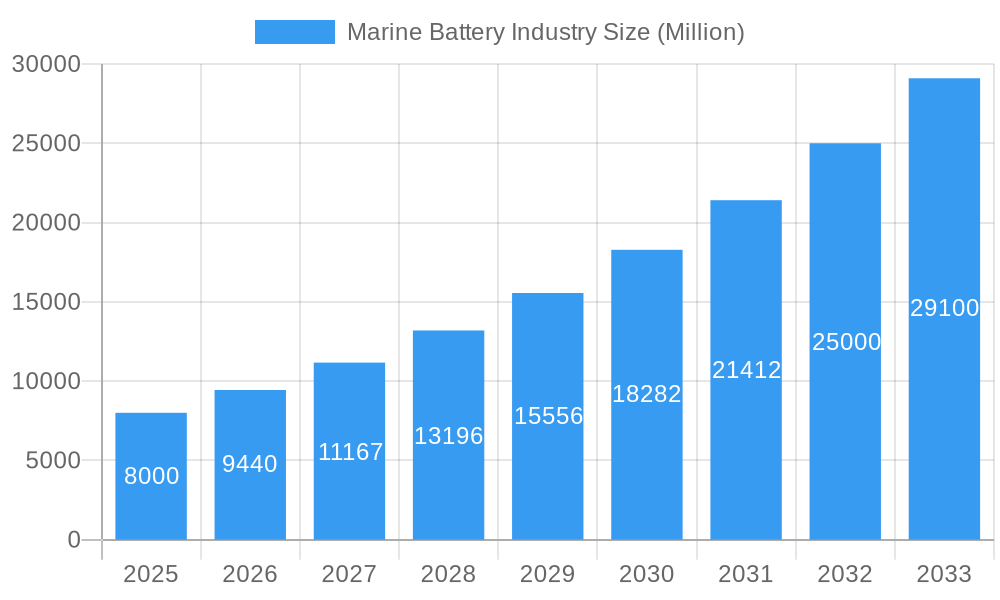
Marine Battery Industry Market Size (In Billion)
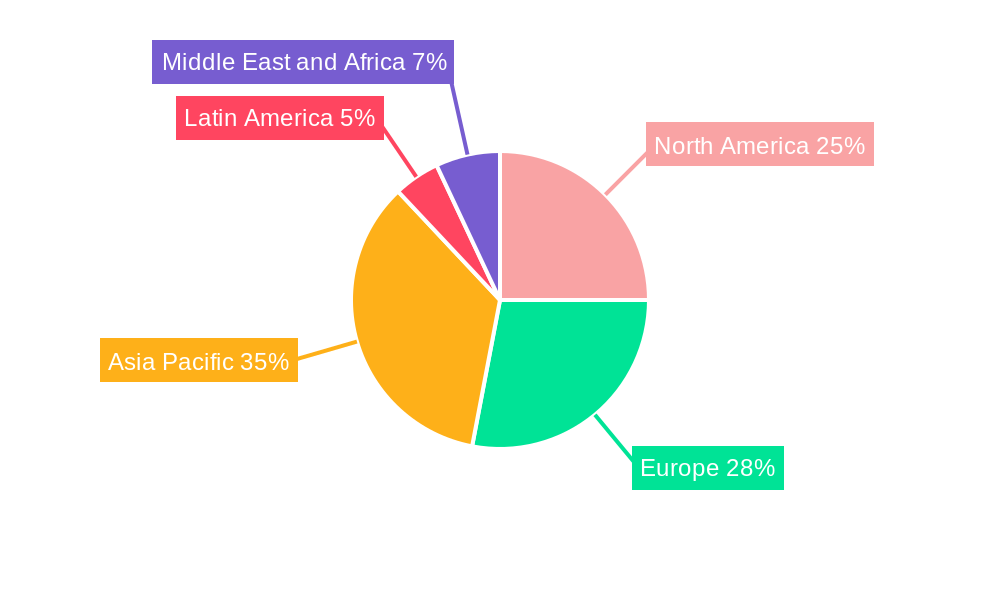
Geographically, the Asia-Pacific region, particularly China and India, is experiencing robust growth fueled by expanding maritime sectors and governmental support for green initiatives. North America and Europe also hold significant market presence, supported by mature shipping industries and a strong focus on regulatory compliance.
Marine Battery Industry Company Market Share
Market restraints include the high initial investment for new battery technologies, particularly for larger vessels. Concerns regarding battery safety, lifecycle management, and charging infrastructure availability present adoption challenges. However, ongoing technological innovation, supportive government policies, and incentives aimed at reducing shipping emissions are expected to mitigate these restraints. Future market expansion will depend on further innovation in battery chemistry and design, developing more cost-effective, higher-performing solutions, and the establishment of a comprehensive charging and maintenance infrastructure. The expanding global shipping industry and heightened environmental awareness will continue to drive growth in this dynamic sector. The market size is estimated at $1.54 billion in the base year of 2025.
Marine Battery Industry Market Report: 2019-2033
This comprehensive report provides a detailed analysis of the global marine battery industry, encompassing market size, growth drivers, competitive landscape, and future outlook from 2019 to 2033. The study period covers 2019-2024 (historical period), with 2025 as the base and estimated year, and a forecast period extending to 2033. The report is designed for industry professionals, investors, and researchers seeking in-depth insights into this rapidly evolving sector. Expect granular data and expert analysis of key trends shaping the future of marine battery technology. The market value in 2025 is estimated at $XX Million.
Marine Battery Industry Market Structure & Competitive Landscape
The marine battery market is characterized by a moderately concentrated competitive landscape, with several major players holding significant market share. Key players include EnerSys, Leclanche SA, Toshiba Corporation, HBL Power System, Furukawa Battery Solutions, Siemens AG, BorgWarner Inc, Wärtsilä, Saft, and Exide Technologies. The market structure is influenced by factors such as technological innovation, regulatory changes, and the increasing demand for sustainable and efficient marine propulsion systems.
- Market Concentration: The Herfindahl-Hirschman Index (HHI) is estimated at xx, indicating a moderately concentrated market.
- Innovation Drivers: Continuous advancements in battery technologies, such as lithium-ion, fuel cells, and improved lead-acid batteries, are driving market growth.
- Regulatory Impacts: Stringent environmental regulations aimed at reducing greenhouse gas emissions from ships are pushing the adoption of cleaner energy solutions, including marine batteries.
- Product Substitutes: Alternative propulsion technologies, like hydrogen fuel cells and hybrid systems, pose competitive pressure to marine batteries.
- End-User Segmentation: The market is segmented by ship type (commercial, defense), and battery type (lithium-ion, nickel-cadmium, fuel cell, lead-acid).
- M&A Trends: The marine battery sector has witnessed xx number of mergers and acquisitions in the past five years, primarily driven by the consolidation of market players and technological advancements. The total value of these deals is estimated at $xx Million.
Marine Battery Industry Market Trends & Opportunities
The global marine battery market is experiencing substantial growth, driven by increasing demand for eco-friendly marine propulsion systems and the continuous development of advanced battery technologies. The market is projected to reach $XX Million by 2033, exhibiting a Compound Annual Growth Rate (CAGR) of xx% during the forecast period (2025-2033). This growth is fueled by several key factors, including the rising adoption of electric and hybrid vessels in the commercial and defense sectors, stringent environmental regulations, and advancements in battery technology leading to improved performance, lifespan, and energy density. Consumer preferences are shifting towards environmentally friendly options, further boosting the demand for marine batteries. The market penetration rate for lithium-ion batteries is expected to increase significantly, surpassing xx% by 2033, while the adoption of fuel cell technology is anticipated to grow at a faster pace, fueled by government initiatives and technological advancements. Increased investments in R&D and strategic partnerships among key players are shaping the competitive landscape and accelerating innovation in the marine battery sector. The market is expected to witness strong growth across various segments, with the lithium-ion battery segment gaining significant traction due to its high energy density and improved performance.
Dominant Markets & Segments in Marine Battery Industry
The Asia-Pacific region is projected to dominate the marine battery market throughout the forecast period, driven by substantial growth in the shipbuilding and shipping industries in countries like China, Japan, South Korea, and India. Europe and North America are also expected to witness considerable growth, fueled by stringent environmental regulations and government incentives for the adoption of green technologies.
- Leading Regions: Asia-Pacific, Europe, and North America are the dominant markets.
- Leading Segments:
- Battery Type: Lithium-ion batteries are expected to dominate due to their high energy density and long lifespan.
- Ship Type: The commercial shipping segment is expected to drive the majority of market growth.
Growth Drivers:
- Stringent Environmental Regulations: International Maritime Organization (IMO) regulations on reducing greenhouse gas emissions are driving the adoption of battery-powered vessels.
- Government Incentives: Government subsidies and tax breaks aimed at promoting sustainable shipping are stimulating market growth.
- Technological Advancements: Improvements in battery technology, such as increased energy density and reduced costs, are making battery-powered vessels more economically viable.
- Infrastructure Development: Investments in charging infrastructure and supporting technologies are facilitating wider adoption of marine batteries.
Marine Battery Industry Product Analysis
The marine battery industry is witnessing significant innovation in battery technologies, with a focus on enhancing energy density, lifespan, and safety features. Lithium-ion batteries are gaining prominence due to their superior performance compared to traditional lead-acid batteries. Fuel cell technology is also emerging as a promising alternative, offering high efficiency and zero emissions. The key competitive advantages of these advanced battery technologies lie in their ability to offer extended operational range, reduced maintenance requirements, and improved environmental sustainability, thereby meeting the growing demand for eco-friendly marine propulsion solutions.
Key Drivers, Barriers & Challenges in Marine Battery Industry
Key Drivers:
- Growing demand for sustainable marine transportation: The increasing need to reduce greenhouse gas emissions from ships is driving the adoption of marine batteries.
- Technological advancements: Improvements in battery technology, such as higher energy density and longer lifespan, are making them more attractive to ship owners.
- Government regulations and incentives: Stringent environmental regulations and supportive government policies are encouraging the use of marine batteries.
Key Challenges:
- High initial investment costs: The high cost of marine batteries is a significant barrier to wider adoption.
- Limited charging infrastructure: The lack of sufficient charging infrastructure is a major challenge for the widespread deployment of electric ships.
- Safety concerns: Concerns about battery safety and fire hazards remain a significant challenge that requires careful mitigation strategies. This results in approximately $xx Million in lost revenue annually.
Growth Drivers in the Marine Battery Industry Market
The marine battery industry is experiencing rapid growth due to several key factors: Stringent environmental regulations aimed at reducing emissions from ships are driving the adoption of cleaner alternatives, including electric propulsion powered by advanced marine batteries. Technological advancements, such as improved energy density and lifespan of lithium-ion batteries, make them a more compelling option for ship operators. Government incentives and supportive policies in various regions further accelerate market expansion.
Challenges Impacting Marine Battery Industry Growth
Despite the positive growth trajectory, the marine battery industry faces challenges including the high initial cost of batteries, which can be a barrier to entry for smaller operators. The limited availability of charging infrastructure in ports and harbors hinders the wider adoption of electric ships. Furthermore, safety concerns regarding battery performance and potential risks remain an area requiring continued attention and technological development. These factors result in approximately $xx Million in lost opportunities annually.
Key Players Shaping the Marine Battery Industry Market
- EnerSys
- Leclanche SA
- Toshiba Corporation
- HBL Power System
- Furukawa Battery Solutions
- Siemens AG
- BorgWarner Inc
- Wärtsilä
- Saft
- Exide Technologies
Significant Marine Battery Industry Industry Milestones
- October 2022: ABS signed a cooperation agreement with CATL to research lithium battery propulsion for next-generation vessels, focusing on safety-related technologies like charging systems and fire control. This significantly boosts the development and standardization of safer lithium-ion battery systems for marine applications.
- January 2022: Vision Marine Technologies partnered with Octillion Power Systems to develop a high-voltage battery pack for recreational boating, indicating growth in the smaller vessel market.
Future Outlook for Marine Battery Industry Market
The future of the marine battery industry looks promising, with continued growth driven by technological advancements, supportive government policies, and the increasing demand for sustainable shipping solutions. Strategic investments in research and development, along with collaborations between battery manufacturers and shipbuilders, are expected to lead to further innovation and the introduction of more efficient and cost-effective marine battery technologies. The market is poised for significant expansion, with considerable potential for growth across various ship types and regions.
Marine Battery Industry Segmentation
-
1. Battery
- 1.1. Lithium-ion
- 1.2. Nickel-Cadmium
- 1.3. Fuel Cell
- 1.4. Lead Acid
-
2. Ship Type
- 2.1. Commercial
- 2.2. Defense
Marine Battery Industry Segmentation By Geography
-
1. North America
- 1.1. United States
- 1.2. Canada
-
2. Europe
- 2.1. Germany
- 2.2. United Kingdom
- 2.3. France
- 2.4. Russia
- 2.5. Rest of Europe
-
3. Asia Pacific
- 3.1. India
- 3.2. China
- 3.3. Japan
- 3.4. South Korea
- 3.5. Rest of Asia Pacific
-
4. Latin America
- 4.1. Brazil
- 4.2. Rest of Latin America
-
5. Middle East and Africa
- 5.1. United Arab Emirates
- 5.2. Saudi Arabia
- 5.3. Israel
- 5.4. South Africa
- 5.5. Rest of Middle East and Africa
Marine Battery Industry Regional Market Share
Geographic Coverage of Marine Battery Industry
Marine Battery Industry REPORT HIGHLIGHTS
| Aspects | Details |
|---|---|
| Study Period | 2020-2034 |
| Base Year | 2025 |
| Estimated Year | 2026 |
| Forecast Period | 2026-2034 |
| Historical Period | 2020-2025 |
| Growth Rate | CAGR of 17.89% from 2020-2034 |
| Segmentation |
|
Table of Contents
- 1. Introduction
- 1.1. Research Scope
- 1.2. Market Segmentation
- 1.3. Research Objective
- 1.4. Definitions and Assumptions
- 2. Executive Summary
- 2.1. Market Snapshot
- 3. Market Dynamics
- 3.1. Market Drivers
- 3.2. Market Restrains
- 3.3. Market Trends
- 3.4. Market Opportunities
- 4. Market Factor Analysis
- 4.1. Porters Five Forces
- 4.1.1. Bargaining Power of Suppliers
- 4.1.2. Bargaining Power of Buyers
- 4.1.3. Threat of New Entrants
- 4.1.4. Threat of Substitutes
- 4.1.5. Competitive Rivalry
- 4.2. PESTEL analysis
- 4.3. BCG Analysis
- 4.3.1. Stars (High Growth, High Market Share)
- 4.3.2. Cash Cows (Low Growth, High Market Share)
- 4.3.3. Question Mark (High Growth, Low Market Share)
- 4.3.4. Dogs (Low Growth, Low Market Share)
- 4.4. Ansoff Matrix Analysis
- 4.5. Supply Chain Analysis
- 4.6. Regulatory Landscape
- 4.7. Current Market Potential and Opportunity Assessment (TAM–SAM–SOM Framework)
- 4.8. TIR Analyst Note
- 4.1. Porters Five Forces
- 5. Market Analysis, Insights and Forecast 2021-2033
- 5.1. Market Analysis, Insights and Forecast - by Battery
- 5.1.1. Lithium-ion
- 5.1.2. Nickel-Cadmium
- 5.1.3. Fuel Cell
- 5.1.4. Lead Acid
- 5.2. Market Analysis, Insights and Forecast - by Ship Type
- 5.2.1. Commercial
- 5.2.2. Defense
- 5.3. Market Analysis, Insights and Forecast - by Region
- 5.3.1. North America
- 5.3.2. Europe
- 5.3.3. Asia Pacific
- 5.3.4. Latin America
- 5.3.5. Middle East and Africa
- 5.1. Market Analysis, Insights and Forecast - by Battery
- 6. Global Marine Battery Industry Analysis, Insights and Forecast, 2021-2033
- 6.1. Market Analysis, Insights and Forecast - by Battery
- 6.1.1. Lithium-ion
- 6.1.2. Nickel-Cadmium
- 6.1.3. Fuel Cell
- 6.1.4. Lead Acid
- 6.2. Market Analysis, Insights and Forecast - by Ship Type
- 6.2.1. Commercial
- 6.2.2. Defense
- 6.1. Market Analysis, Insights and Forecast - by Battery
- 7. North America Marine Battery Industry Analysis, Insights and Forecast, 2020-2032
- 7.1. Market Analysis, Insights and Forecast - by Battery
- 7.1.1. Lithium-ion
- 7.1.2. Nickel-Cadmium
- 7.1.3. Fuel Cell
- 7.1.4. Lead Acid
- 7.2. Market Analysis, Insights and Forecast - by Ship Type
- 7.2.1. Commercial
- 7.2.2. Defense
- 7.1. Market Analysis, Insights and Forecast - by Battery
- 8. Europe Marine Battery Industry Analysis, Insights and Forecast, 2020-2032
- 8.1. Market Analysis, Insights and Forecast - by Battery
- 8.1.1. Lithium-ion
- 8.1.2. Nickel-Cadmium
- 8.1.3. Fuel Cell
- 8.1.4. Lead Acid
- 8.2. Market Analysis, Insights and Forecast - by Ship Type
- 8.2.1. Commercial
- 8.2.2. Defense
- 8.1. Market Analysis, Insights and Forecast - by Battery
- 9. Asia Pacific Marine Battery Industry Analysis, Insights and Forecast, 2020-2032
- 9.1. Market Analysis, Insights and Forecast - by Battery
- 9.1.1. Lithium-ion
- 9.1.2. Nickel-Cadmium
- 9.1.3. Fuel Cell
- 9.1.4. Lead Acid
- 9.2. Market Analysis, Insights and Forecast - by Ship Type
- 9.2.1. Commercial
- 9.2.2. Defense
- 9.1. Market Analysis, Insights and Forecast - by Battery
- 10. Latin America Marine Battery Industry Analysis, Insights and Forecast, 2020-2032
- 10.1. Market Analysis, Insights and Forecast - by Battery
- 10.1.1. Lithium-ion
- 10.1.2. Nickel-Cadmium
- 10.1.3. Fuel Cell
- 10.1.4. Lead Acid
- 10.2. Market Analysis, Insights and Forecast - by Ship Type
- 10.2.1. Commercial
- 10.2.2. Defense
- 10.1. Market Analysis, Insights and Forecast - by Battery
- 11. Middle East and Africa Marine Battery Industry Analysis, Insights and Forecast, 2020-2032
- 11.1. Market Analysis, Insights and Forecast - by Battery
- 11.1.1. Lithium-ion
- 11.1.2. Nickel-Cadmium
- 11.1.3. Fuel Cell
- 11.1.4. Lead Acid
- 11.2. Market Analysis, Insights and Forecast - by Ship Type
- 11.2.1. Commercial
- 11.2.2. Defense
- 11.1. Market Analysis, Insights and Forecast - by Battery
- 12. Competitive Analysis
- 12.1. Company Profiles
- 12.1.1 EnerSys
- 12.1.1.1. Company Overview
- 12.1.1.2. Products
- 12.1.1.3. Company Financials
- 12.1.1.4. SWOT Analysis
- 12.1.2 Leclanche SA
- 12.1.2.1. Company Overview
- 12.1.2.2. Products
- 12.1.2.3. Company Financials
- 12.1.2.4. SWOT Analysis
- 12.1.3 Toshiba Corporation
- 12.1.3.1. Company Overview
- 12.1.3.2. Products
- 12.1.3.3. Company Financials
- 12.1.3.4. SWOT Analysis
- 12.1.4 HBL Power System
- 12.1.4.1. Company Overview
- 12.1.4.2. Products
- 12.1.4.3. Company Financials
- 12.1.4.4. SWOT Analysis
- 12.1.5 Furukawa Battery Solutions
- 12.1.5.1. Company Overview
- 12.1.5.2. Products
- 12.1.5.3. Company Financials
- 12.1.5.4. SWOT Analysis
- 12.1.6 Siemens AG
- 12.1.6.1. Company Overview
- 12.1.6.2. Products
- 12.1.6.3. Company Financials
- 12.1.6.4. SWOT Analysis
- 12.1.7 BorgWarner Inc
- 12.1.7.1. Company Overview
- 12.1.7.2. Products
- 12.1.7.3. Company Financials
- 12.1.7.4. SWOT Analysis
- 12.1.8 Wartsila
- 12.1.8.1. Company Overview
- 12.1.8.2. Products
- 12.1.8.3. Company Financials
- 12.1.8.4. SWOT Analysis
- 12.1.9 Saft
- 12.1.9.1. Company Overview
- 12.1.9.2. Products
- 12.1.9.3. Company Financials
- 12.1.9.4. SWOT Analysis
- 12.1.10 Exide Technologies
- 12.1.10.1. Company Overview
- 12.1.10.2. Products
- 12.1.10.3. Company Financials
- 12.1.10.4. SWOT Analysis
- 12.1.1 EnerSys
- 12.2. Market Entropy
- 12.2.1 Company's Key Areas Served
- 12.2.2 Recent Developments
- 12.3. Company Market Share Analysis 2025
- 12.3.1 Top 5 Companies Market Share Analysis
- 12.3.2 Top 3 Companies Market Share Analysis
- 12.4. List of Potential Customers
- 13. Research Methodology
List of Figures
- Figure 1: Global Marine Battery Industry Revenue Breakdown (billion, %) by Region 2025 & 2033
- Figure 2: North America Marine Battery Industry Revenue (billion), by Battery 2025 & 2033
- Figure 3: North America Marine Battery Industry Revenue Share (%), by Battery 2025 & 2033
- Figure 4: North America Marine Battery Industry Revenue (billion), by Ship Type 2025 & 2033
- Figure 5: North America Marine Battery Industry Revenue Share (%), by Ship Type 2025 & 2033
- Figure 6: North America Marine Battery Industry Revenue (billion), by Country 2025 & 2033
- Figure 7: North America Marine Battery Industry Revenue Share (%), by Country 2025 & 2033
- Figure 8: Europe Marine Battery Industry Revenue (billion), by Battery 2025 & 2033
- Figure 9: Europe Marine Battery Industry Revenue Share (%), by Battery 2025 & 2033
- Figure 10: Europe Marine Battery Industry Revenue (billion), by Ship Type 2025 & 2033
- Figure 11: Europe Marine Battery Industry Revenue Share (%), by Ship Type 2025 & 2033
- Figure 12: Europe Marine Battery Industry Revenue (billion), by Country 2025 & 2033
- Figure 13: Europe Marine Battery Industry Revenue Share (%), by Country 2025 & 2033
- Figure 14: Asia Pacific Marine Battery Industry Revenue (billion), by Battery 2025 & 2033
- Figure 15: Asia Pacific Marine Battery Industry Revenue Share (%), by Battery 2025 & 2033
- Figure 16: Asia Pacific Marine Battery Industry Revenue (billion), by Ship Type 2025 & 2033
- Figure 17: Asia Pacific Marine Battery Industry Revenue Share (%), by Ship Type 2025 & 2033
- Figure 18: Asia Pacific Marine Battery Industry Revenue (billion), by Country 2025 & 2033
- Figure 19: Asia Pacific Marine Battery Industry Revenue Share (%), by Country 2025 & 2033
- Figure 20: Latin America Marine Battery Industry Revenue (billion), by Battery 2025 & 2033
- Figure 21: Latin America Marine Battery Industry Revenue Share (%), by Battery 2025 & 2033
- Figure 22: Latin America Marine Battery Industry Revenue (billion), by Ship Type 2025 & 2033
- Figure 23: Latin America Marine Battery Industry Revenue Share (%), by Ship Type 2025 & 2033
- Figure 24: Latin America Marine Battery Industry Revenue (billion), by Country 2025 & 2033
- Figure 25: Latin America Marine Battery Industry Revenue Share (%), by Country 2025 & 2033
- Figure 26: Middle East and Africa Marine Battery Industry Revenue (billion), by Battery 2025 & 2033
- Figure 27: Middle East and Africa Marine Battery Industry Revenue Share (%), by Battery 2025 & 2033
- Figure 28: Middle East and Africa Marine Battery Industry Revenue (billion), by Ship Type 2025 & 2033
- Figure 29: Middle East and Africa Marine Battery Industry Revenue Share (%), by Ship Type 2025 & 2033
- Figure 30: Middle East and Africa Marine Battery Industry Revenue (billion), by Country 2025 & 2033
- Figure 31: Middle East and Africa Marine Battery Industry Revenue Share (%), by Country 2025 & 2033
List of Tables
- Table 1: Global Marine Battery Industry Revenue billion Forecast, by Battery 2020 & 2033
- Table 2: Global Marine Battery Industry Revenue billion Forecast, by Ship Type 2020 & 2033
- Table 3: Global Marine Battery Industry Revenue billion Forecast, by Region 2020 & 2033
- Table 4: Global Marine Battery Industry Revenue billion Forecast, by Battery 2020 & 2033
- Table 5: Global Marine Battery Industry Revenue billion Forecast, by Ship Type 2020 & 2033
- Table 6: Global Marine Battery Industry Revenue billion Forecast, by Country 2020 & 2033
- Table 7: United States Marine Battery Industry Revenue (billion) Forecast, by Application 2020 & 2033
- Table 8: Canada Marine Battery Industry Revenue (billion) Forecast, by Application 2020 & 2033
- Table 9: Global Marine Battery Industry Revenue billion Forecast, by Battery 2020 & 2033
- Table 10: Global Marine Battery Industry Revenue billion Forecast, by Ship Type 2020 & 2033
- Table 11: Global Marine Battery Industry Revenue billion Forecast, by Country 2020 & 2033
- Table 12: Germany Marine Battery Industry Revenue (billion) Forecast, by Application 2020 & 2033
- Table 13: United Kingdom Marine Battery Industry Revenue (billion) Forecast, by Application 2020 & 2033
- Table 14: France Marine Battery Industry Revenue (billion) Forecast, by Application 2020 & 2033
- Table 15: Russia Marine Battery Industry Revenue (billion) Forecast, by Application 2020 & 2033
- Table 16: Rest of Europe Marine Battery Industry Revenue (billion) Forecast, by Application 2020 & 2033
- Table 17: Global Marine Battery Industry Revenue billion Forecast, by Battery 2020 & 2033
- Table 18: Global Marine Battery Industry Revenue billion Forecast, by Ship Type 2020 & 2033
- Table 19: Global Marine Battery Industry Revenue billion Forecast, by Country 2020 & 2033
- Table 20: India Marine Battery Industry Revenue (billion) Forecast, by Application 2020 & 2033
- Table 21: China Marine Battery Industry Revenue (billion) Forecast, by Application 2020 & 2033
- Table 22: Japan Marine Battery Industry Revenue (billion) Forecast, by Application 2020 & 2033
- Table 23: South Korea Marine Battery Industry Revenue (billion) Forecast, by Application 2020 & 2033
- Table 24: Rest of Asia Pacific Marine Battery Industry Revenue (billion) Forecast, by Application 2020 & 2033
- Table 25: Global Marine Battery Industry Revenue billion Forecast, by Battery 2020 & 2033
- Table 26: Global Marine Battery Industry Revenue billion Forecast, by Ship Type 2020 & 2033
- Table 27: Global Marine Battery Industry Revenue billion Forecast, by Country 2020 & 2033
- Table 28: Brazil Marine Battery Industry Revenue (billion) Forecast, by Application 2020 & 2033
- Table 29: Rest of Latin America Marine Battery Industry Revenue (billion) Forecast, by Application 2020 & 2033
- Table 30: Global Marine Battery Industry Revenue billion Forecast, by Battery 2020 & 2033
- Table 31: Global Marine Battery Industry Revenue billion Forecast, by Ship Type 2020 & 2033
- Table 32: Global Marine Battery Industry Revenue billion Forecast, by Country 2020 & 2033
- Table 33: United Arab Emirates Marine Battery Industry Revenue (billion) Forecast, by Application 2020 & 2033
- Table 34: Saudi Arabia Marine Battery Industry Revenue (billion) Forecast, by Application 2020 & 2033
- Table 35: Israel Marine Battery Industry Revenue (billion) Forecast, by Application 2020 & 2033
- Table 36: South Africa Marine Battery Industry Revenue (billion) Forecast, by Application 2020 & 2033
- Table 37: Rest of Middle East and Africa Marine Battery Industry Revenue (billion) Forecast, by Application 2020 & 2033
Frequently Asked Questions
1. What is the projected Compound Annual Growth Rate (CAGR) of the Marine Battery Industry?
The projected CAGR is approximately 17.89%.
2. Which companies are prominent players in the Marine Battery Industry?
Key companies in the market include EnerSys, Leclanche SA, Toshiba Corporation, HBL Power System, Furukawa Battery Solutions, Siemens AG, BorgWarner Inc, Wartsila, Saft, Exide Technologies.
3. What are the main segments of the Marine Battery Industry?
The market segments include Battery, Ship Type.
4. Can you provide details about the market size?
The market size is estimated to be USD 1.54 billion as of 2022.
5. What are some drivers contributing to market growth?
Increasing Adoption of 2-wheelers across the Globe.
6. What are the notable trends driving market growth?
Lithium-ion Segment is Projected to Highest Growth During the Forecast Period.
7. Are there any restraints impacting market growth?
Rise in demand of Electric Vehicles.
8. Can you provide examples of recent developments in the market?
October 2022: ABS signed a cooperation agreement with Contemporary Amperex Technology Co., Limited (CATL) to work together and research lithium battery propulsion for next-generation vessels. Under the agreement, the two companies would carry out research on the technical standards for battery-powered vessels, which includes key safety-related technologies such as the charging system, power battery compartment layout, propulsion system, and fire control.
9. What pricing options are available for accessing the report?
Pricing options include single-user, multi-user, and enterprise licenses priced at USD 4750, USD 5250, and USD 8750 respectively.
10. Is the market size provided in terms of value or volume?
The market size is provided in terms of value, measured in billion.
11. Are there any specific market keywords associated with the report?
Yes, the market keyword associated with the report is "Marine Battery Industry," which aids in identifying and referencing the specific market segment covered.
12. How do I determine which pricing option suits my needs best?
The pricing options vary based on user requirements and access needs. Individual users may opt for single-user licenses, while businesses requiring broader access may choose multi-user or enterprise licenses for cost-effective access to the report.
13. Are there any additional resources or data provided in the Marine Battery Industry report?
While the report offers comprehensive insights, it's advisable to review the specific contents or supplementary materials provided to ascertain if additional resources or data are available.
14. How can I stay updated on further developments or reports in the Marine Battery Industry?
To stay informed about further developments, trends, and reports in the Marine Battery Industry, consider subscribing to industry newsletters, following relevant companies and organizations, or regularly checking reputable industry news sources and publications.
Methodology
Step 1 - Identification of Relevant Samples Size from Population Database


Step 2 - Approaches for Defining Global Market Size (Value, Volume* & Price*)

Note*: In applicable scenarios
Step 3 - Data Sources
Primary Research
- Web Analytics
- Survey Reports
- Research Institute
- Latest Research Reports
- Opinion Leaders
Secondary Research
- Annual Reports
- White Paper
- Latest Press Release
- Industry Association
- Paid Database
- Investor Presentations

Step 4 - Data Triangulation
Involves using different sources of information in order to increase the validity of a study
These sources are likely to be stakeholders in a program - participants, other researchers, program staff, other community members, and so on.
Then we put all data in single framework & apply various statistical tools to find out the dynamic on the market.
During the analysis stage, feedback from the stakeholder groups would be compared to determine areas of agreement as well as areas of divergence