

Key Insights
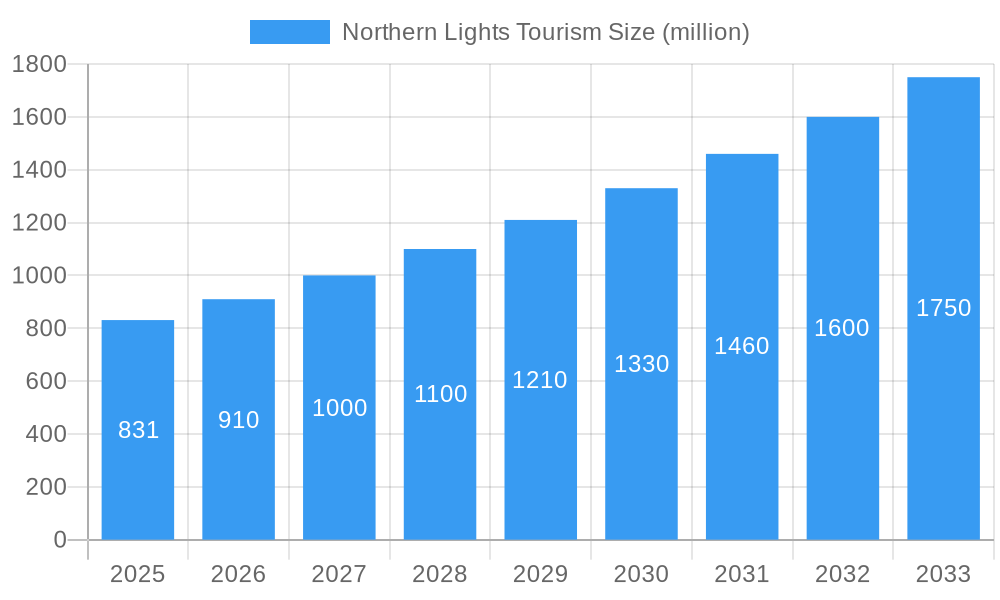
The Northern Lights tourism market, valued at $831 million in 2025, is experiencing robust growth, projected to expand at a compound annual growth rate (CAGR) of 9.6% from 2025 to 2033. This expansion is driven by several factors. Increased accessibility through improved infrastructure, including more convenient flights and accommodation options in previously remote areas, is making viewing the aurora borealis more attainable for a wider range of travelers. Furthermore, a rising interest in experiential travel and unique, once-in-a-lifetime experiences fuels demand. The growth is also fueled by targeted marketing campaigns highlighting the beauty and wonder of the Northern Lights, often paired with other winter activities such as skiing, snowmobiling, or dog sledding, creating comprehensive tourism packages. While logistical challenges such as weather dependency and the limited viewing season pose some restraints, innovative solutions such as aurora forecasting apps and flexible booking policies are mitigating these factors. The market segmentation includes various trip types, from budget-friendly self-drive itineraries to luxurious, all-inclusive expeditions, catering to diverse consumer preferences and budgets. Key players like Abercrombie & Kent, Quark Expeditions, and Intrepid Travel are actively shaping the market through their offerings and targeted marketing efforts.
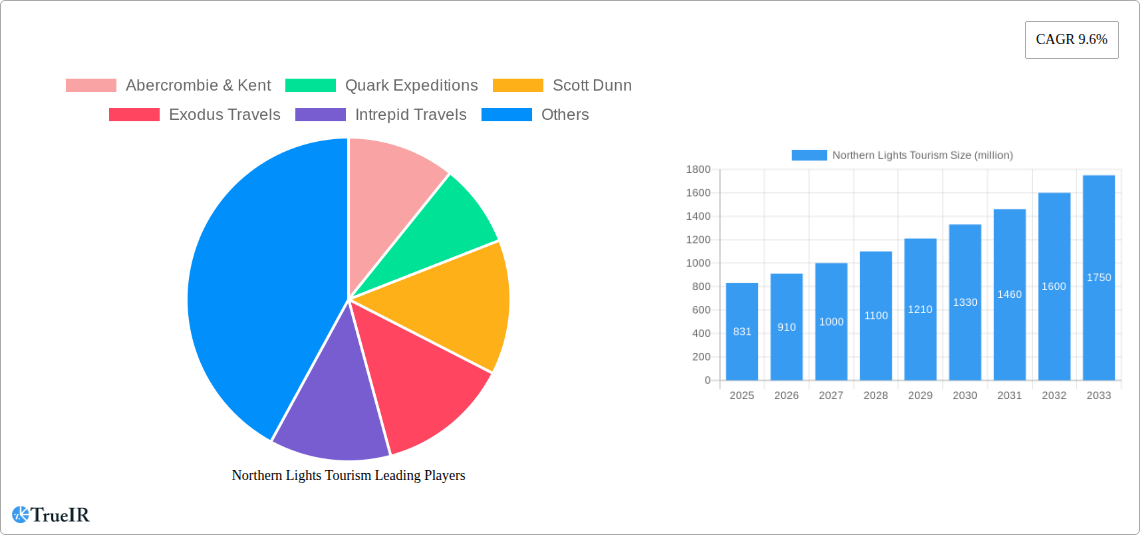
Northern Lights Tourism Market Size (In Million)
The forecast for the Northern Lights tourism market remains highly positive through 2033, with projected continued growth driven by the factors mentioned above. The increase in sustainable tourism initiatives, focusing on minimizing environmental impact and supporting local communities, will further attract environmentally conscious travelers. The rising popularity of photography tours and specialized aurora viewing experiences also contributes to this growth trajectory. While competition is expected to intensify among tour operators, the overall market size is anticipated to grow significantly, offering opportunities for both established and emerging players. Effective marketing strategies, leveraging digital platforms and influencer collaborations, will be crucial for success in this dynamic and expanding market.
Northern Lights Tourism Company Market Share
Northern Lights Tourism Market Report: A Comprehensive Forecast to 2033
This dynamic report provides an in-depth analysis of the booming Northern Lights tourism market, projecting a multi-million dollar valuation by 2033. Leveraging data from 2019-2024 (historical period), with 2025 as the base and estimated year, this report forecasts market trends through 2033. It offers invaluable insights for businesses, investors, and stakeholders seeking to navigate this rapidly evolving sector. The report delves into market structure, competitive dynamics, key players, and future growth potential, enabling informed decision-making and strategic planning. This study covers a market exceeding $XX million in 2025, projecting a CAGR of XX% during the forecast period (2025-2033).
Northern Lights Tourism Market Structure & Competitive Landscape
The Northern Lights tourism market exhibits a moderately concentrated structure, with a Herfindahl-Hirschman Index (HHI) of XX in 2025. This reflects the presence of both established global players and smaller, specialized operators. Key innovation drivers include sustainable tourism initiatives, technological advancements in aurora forecasting, and the development of unique experiential travel packages. Regulatory impacts vary across regions, with some jurisdictions implementing stricter environmental regulations or licensing requirements. Product substitutes, such as other winter vacation destinations, pose a competitive threat.
The market comprises distinct end-user segments, including individual travelers, families, adventure tourists, and luxury travelers. Each segment has unique needs and preferences, influencing product offerings and marketing strategies. M&A activity has been relatively moderate in the historical period, with approximately XX deals valued at a total of $XX million. However, increasing market consolidation is anticipated, with larger companies acquiring smaller specialized tour operators to expand their geographical reach and product offerings.
- Market Concentration: HHI of XX in 2025.
- Innovation Drivers: Sustainable tourism, improved aurora forecasting technology, unique experiences.
- Regulatory Impacts: Vary by region, influencing licensing and environmental practices.
- Product Substitutes: Other winter destinations and travel experiences.
- End-User Segmentation: Individual, family, adventure, and luxury travelers.
- M&A Trends: Moderate activity in the past, with potential for increased consolidation.
Northern Lights Tourism Market Trends & Opportunities
The Northern Lights tourism market is experiencing significant growth, driven by increasing consumer demand for unique travel experiences and a rising global middle class with increased disposable income. Technological advancements, such as enhanced aurora forecasting apps and virtual reality experiences, are creating new opportunities to engage customers. Consumer preferences are shifting towards sustainable and responsible travel practices, which necessitates a focus on eco-friendly tourism solutions. The competitive landscape is becoming more intense, with companies vying for market share through innovative products and targeted marketing.
Market penetration rates vary significantly by region, with established destinations commanding higher market share. The market is projected to reach $XX million by 2033, driven by increasing tourist arrivals and higher average spending per trip. The market is estimated to grow at a CAGR of XX% during the forecast period. This growth is further fueled by increased accessibility, improved infrastructure, and targeted marketing campaigns. The rise of experiential travel and the growing popularity of sustainable tourism are significant trends to consider.
Dominant Markets & Segments in Northern Lights Tourism
Norway and Iceland consistently dominate the Northern Lights tourism market, with XX million and XX million tourists respectively in 2025. These countries benefit from ideal viewing locations, well-established tourism infrastructure, and supportive government policies promoting sustainable tourism practices. Canada also holds a significant share, particularly in the Yukon and Northwest Territories.
- Key Growth Drivers in Norway and Iceland:
- Well-developed infrastructure: Excellent airport connectivity, comfortable accommodations, and convenient transport.
- Pro-tourism government policies: Incentives for tourism-related businesses and investments in infrastructure.
- Strong marketing and branding: Successful promotion of their aurora viewing experiences globally.
- Established tour operator presence: Wide range of tour packages available across price points.
The luxury segment is experiencing faster growth compared to other segments, due to its higher average spending per trip and growing global demand for premium experiences. The increase in disposable income, particularly among affluent individuals, is a key driver. The focus on personalized, high-end services and unique travel experiences is contributing to segment growth.
Northern Lights Tourism Product Analysis
Product innovation is vital in the Northern Lights tourism market. Companies are developing specialized tours catering to diverse interests and preferences. Advancements in aurora forecasting technology enable more accurate predictions, enhancing the customer experience. Companies are increasingly integrating sustainable tourism practices into their offerings, appealing to environmentally conscious travelers. The use of virtual reality and augmented reality technologies is enhancing the immersive nature of the experience, creating opportunities for pre-trip engagement and post-trip reminiscence. The competitive advantage lies in providing unique, well-organized experiences that cater to customer expectations while ensuring environmental responsibility.
Key Drivers, Barriers & Challenges in Northern Lights Tourism
Key Drivers: Rising disposable income globally, increasing interest in unique travel experiences, technological advancements in aurora prediction and viewing experiences, and supportive government policies in key regions. The expanding middle class in developing countries is creating a growing pool of potential tourists seeking exceptional winter experiences.
Challenges: Weather dependency remains a significant challenge, impacting visibility and trip success rates. Sustainability concerns require a focus on minimizing environmental impact and promoting responsible tourism practices. Overtourism in popular destinations can lead to negative impacts on local communities and the environment. The seasonal nature of the aurora viewing period limits the operating window, affecting profitability and employment.
Quantifiable impacts (e.g., revenue loss due to adverse weather) are difficult to precisely establish without access to specific company financial data, but it is expected to be significant.
Growth Drivers in the Northern Lights Tourism Market
The burgeoning global middle class and their increased disposable income are key drivers, fueling demand for unique travel experiences. Technological advancements in weather prediction and aurora forecasting enhance trip planning and customer satisfaction. Government initiatives supporting sustainable tourism and infrastructure development in Northern regions create favorable conditions for market expansion. Growing interest in experiential and adventure tourism adds momentum to this sector.
Challenges Impacting Northern Lights Tourism Growth
Weather unpredictability and the inherently seasonal nature of aurora viewing present substantial challenges. Overtourism in peak seasons can strain local resources and negatively impact the environment. Maintaining sustainability and minimizing the carbon footprint of travel remain key concerns. Regulatory complexities and varying environmental protection standards across different jurisdictions create operational complexities for tour operators.
Key Players Shaping the Northern Lights Tourism Market
Significant Northern Lights Tourism Industry Milestones
- 2020: Increased focus on sustainable tourism practices by several key players.
- 2021: Launch of several new aurora-viewing apps with advanced forecasting capabilities.
- 2022: Significant investment in infrastructure improvements in key Northern Lights viewing locations.
- 2023: Several mergers and acquisitions within the Northern Lights tourism sector.
- 2024: Introduction of new luxury travel packages incorporating unique aurora-related experiences.
Future Outlook for Northern Lights Tourism Market
The Northern Lights tourism market is poised for sustained growth, driven by increasing demand, technological innovation, and a growing awareness of the unique and awe-inspiring experience it offers. Strategic partnerships between tour operators, local communities, and environmental organizations are crucial to ensure responsible and sustainable tourism practices. Continued investment in infrastructure and marketing will further strengthen the market’s position, making it a popular choice for travelers worldwide seeking unforgettable winter adventures.
Northern Lights Tourism Segmentation
-
1. Application
- 1.1. Couples
- 1.2. Solo
- 1.3. Family
- 1.4. Groups
-
2. Types
- 2.1. 18-34 Years
- 2.2. 35-49 Years
- 2.3. 50-64 Years
- 2.4. 65+ Years
Northern Lights Tourism Segmentation By Geography
-
1. North America
- 1.1. United States
- 1.2. Canada
- 1.3. Mexico
-
2. South America
- 2.1. Brazil
- 2.2. Argentina
- 2.3. Rest of South America
-
3. Europe
- 3.1. United Kingdom
- 3.2. Germany
- 3.3. France
- 3.4. Italy
- 3.5. Spain
- 3.6. Russia
- 3.7. Benelux
- 3.8. Nordics
- 3.9. Rest of Europe
-
4. Middle East & Africa
- 4.1. Turkey
- 4.2. Israel
- 4.3. GCC
- 4.4. North Africa
- 4.5. South Africa
- 4.6. Rest of Middle East & Africa
-
5. Asia Pacific
- 5.1. China
- 5.2. India
- 5.3. Japan
- 5.4. South Korea
- 5.5. ASEAN
- 5.6. Oceania
- 5.7. Rest of Asia Pacific
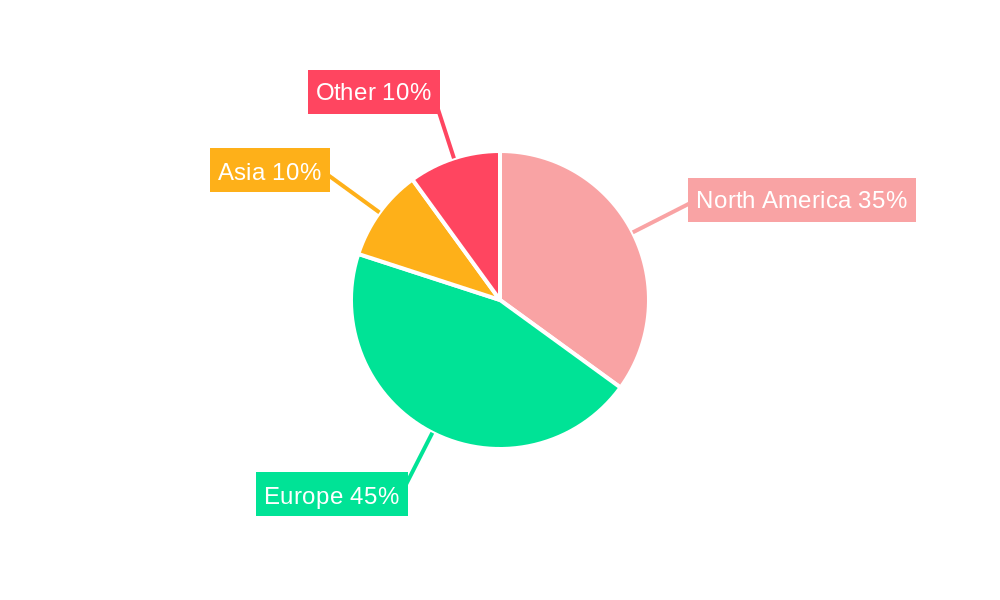
Northern Lights Tourism Regional Market Share
Geographic Coverage of Northern Lights Tourism
Northern Lights Tourism REPORT HIGHLIGHTS
| Aspects | Details |
|---|---|
| Study Period | 2020-2034 |
| Base Year | 2025 |
| Estimated Year | 2026 |
| Forecast Period | 2026-2034 |
| Historical Period | 2020-2025 |
| Growth Rate | CAGR of 9.6% from 2020-2034 |
| Segmentation |
|
Table of Contents
- 1. Introduction
- 1.1. Research Scope
- 1.2. Market Segmentation
- 1.3. Research Methodology
- 1.4. Definitions and Assumptions
- 2. Executive Summary
- 2.1. Introduction
- 3. Market Dynamics
- 3.1. Introduction
- 3.2. Market Drivers
- 3.3. Market Restrains
- 3.4. Market Trends
- 4. Market Factor Analysis
- 4.1. Porters Five Forces
- 4.2. Supply/Value Chain
- 4.3. PESTEL analysis
- 4.4. Market Entropy
- 4.5. Patent/Trademark Analysis
- 5. Global Northern Lights Tourism Analysis, Insights and Forecast, 2020-2032
- 5.1. Market Analysis, Insights and Forecast - by Application
- 5.1.1. Couples
- 5.1.2. Solo
- 5.1.3. Family
- 5.1.4. Groups
- 5.2. Market Analysis, Insights and Forecast - by Types
- 5.2.1. 18-34 Years
- 5.2.2. 35-49 Years
- 5.2.3. 50-64 Years
- 5.2.4. 65+ Years
- 5.3. Market Analysis, Insights and Forecast - by Region
- 5.3.1. North America
- 5.3.2. South America
- 5.3.3. Europe
- 5.3.4. Middle East & Africa
- 5.3.5. Asia Pacific
- 5.1. Market Analysis, Insights and Forecast - by Application
- 6. North America Northern Lights Tourism Analysis, Insights and Forecast, 2020-2032
- 6.1. Market Analysis, Insights and Forecast - by Application
- 6.1.1. Couples
- 6.1.2. Solo
- 6.1.3. Family
- 6.1.4. Groups
- 6.2. Market Analysis, Insights and Forecast - by Types
- 6.2.1. 18-34 Years
- 6.2.2. 35-49 Years
- 6.2.3. 50-64 Years
- 6.2.4. 65+ Years
- 6.1. Market Analysis, Insights and Forecast - by Application
- 7. South America Northern Lights Tourism Analysis, Insights and Forecast, 2020-2032
- 7.1. Market Analysis, Insights and Forecast - by Application
- 7.1.1. Couples
- 7.1.2. Solo
- 7.1.3. Family
- 7.1.4. Groups
- 7.2. Market Analysis, Insights and Forecast - by Types
- 7.2.1. 18-34 Years
- 7.2.2. 35-49 Years
- 7.2.3. 50-64 Years
- 7.2.4. 65+ Years
- 7.1. Market Analysis, Insights and Forecast - by Application
- 8. Europe Northern Lights Tourism Analysis, Insights and Forecast, 2020-2032
- 8.1. Market Analysis, Insights and Forecast - by Application
- 8.1.1. Couples
- 8.1.2. Solo
- 8.1.3. Family
- 8.1.4. Groups
- 8.2. Market Analysis, Insights and Forecast - by Types
- 8.2.1. 18-34 Years
- 8.2.2. 35-49 Years
- 8.2.3. 50-64 Years
- 8.2.4. 65+ Years
- 8.1. Market Analysis, Insights and Forecast - by Application
- 9. Middle East & Africa Northern Lights Tourism Analysis, Insights and Forecast, 2020-2032
- 9.1. Market Analysis, Insights and Forecast - by Application
- 9.1.1. Couples
- 9.1.2. Solo
- 9.1.3. Family
- 9.1.4. Groups
- 9.2. Market Analysis, Insights and Forecast - by Types
- 9.2.1. 18-34 Years
- 9.2.2. 35-49 Years
- 9.2.3. 50-64 Years
- 9.2.4. 65+ Years
- 9.1. Market Analysis, Insights and Forecast - by Application
- 10. Asia Pacific Northern Lights Tourism Analysis, Insights and Forecast, 2020-2032
- 10.1. Market Analysis, Insights and Forecast - by Application
- 10.1.1. Couples
- 10.1.2. Solo
- 10.1.3. Family
- 10.1.4. Groups
- 10.2. Market Analysis, Insights and Forecast - by Types
- 10.2.1. 18-34 Years
- 10.2.2. 35-49 Years
- 10.2.3. 50-64 Years
- 10.2.4. 65+ Years
- 10.1. Market Analysis, Insights and Forecast - by Application
- 11. Competitive Analysis
- 11.1. Global Market Share Analysis 2025
- 11.2. Company Profiles
- 11.2.1 Abercrombie & Kent
- 11.2.1.1. Overview
- 11.2.1.2. Products
- 11.2.1.3. SWOT Analysis
- 11.2.1.4. Recent Developments
- 11.2.1.5. Financials (Based on Availability)
- 11.2.2 Quark Expeditions
- 11.2.2.1. Overview
- 11.2.2.2. Products
- 11.2.2.3. SWOT Analysis
- 11.2.2.4. Recent Developments
- 11.2.2.5. Financials (Based on Availability)
- 11.2.3 Scott Dunn
- 11.2.3.1. Overview
- 11.2.3.2. Products
- 11.2.3.3. SWOT Analysis
- 11.2.3.4. Recent Developments
- 11.2.3.5. Financials (Based on Availability)
- 11.2.4 Exodus Travels
- 11.2.4.1. Overview
- 11.2.4.2. Products
- 11.2.4.3. SWOT Analysis
- 11.2.4.4. Recent Developments
- 11.2.4.5. Financials (Based on Availability)
- 11.2.5 Intrepid Travels
- 11.2.5.1. Overview
- 11.2.5.2. Products
- 11.2.5.3. SWOT Analysis
- 11.2.5.4. Recent Developments
- 11.2.5.5. Financials (Based on Availability)
- 11.2.6 Hurtigruten Expeditions
- 11.2.6.1. Overview
- 11.2.6.2. Products
- 11.2.6.3. SWOT Analysis
- 11.2.6.4. Recent Developments
- 11.2.6.5. Financials (Based on Availability)
- 11.2.7 Butterfield & Robinson Inc.
- 11.2.7.1. Overview
- 11.2.7.2. Products
- 11.2.7.3. SWOT Analysis
- 11.2.7.4. Recent Developments
- 11.2.7.5. Financials (Based on Availability)
- 11.2.8 Lindblad Expeditions
- 11.2.8.1. Overview
- 11.2.8.2. Products
- 11.2.8.3. SWOT Analysis
- 11.2.8.4. Recent Developments
- 11.2.8.5. Financials (Based on Availability)
- 11.2.9 Travel Edge
- 11.2.9.1. Overview
- 11.2.9.2. Products
- 11.2.9.3. SWOT Analysis
- 11.2.9.4. Recent Developments
- 11.2.9.5. Financials (Based on Availability)
- 11.2.10 The Aurora Zone
- 11.2.10.1. Overview
- 11.2.10.2. Products
- 11.2.10.3. SWOT Analysis
- 11.2.10.4. Recent Developments
- 11.2.10.5. Financials (Based on Availability)
- 11.2.1 Abercrombie & Kent
List of Figures
- Figure 1: Global Northern Lights Tourism Revenue Breakdown (million, %) by Region 2025 & 2033
- Figure 2: North America Northern Lights Tourism Revenue (million), by Application 2025 & 2033
- Figure 3: North America Northern Lights Tourism Revenue Share (%), by Application 2025 & 2033
- Figure 4: North America Northern Lights Tourism Revenue (million), by Types 2025 & 2033
- Figure 5: North America Northern Lights Tourism Revenue Share (%), by Types 2025 & 2033
- Figure 6: North America Northern Lights Tourism Revenue (million), by Country 2025 & 2033
- Figure 7: North America Northern Lights Tourism Revenue Share (%), by Country 2025 & 2033
- Figure 8: South America Northern Lights Tourism Revenue (million), by Application 2025 & 2033
- Figure 9: South America Northern Lights Tourism Revenue Share (%), by Application 2025 & 2033
- Figure 10: South America Northern Lights Tourism Revenue (million), by Types 2025 & 2033
- Figure 11: South America Northern Lights Tourism Revenue Share (%), by Types 2025 & 2033
- Figure 12: South America Northern Lights Tourism Revenue (million), by Country 2025 & 2033
- Figure 13: South America Northern Lights Tourism Revenue Share (%), by Country 2025 & 2033
- Figure 14: Europe Northern Lights Tourism Revenue (million), by Application 2025 & 2033
- Figure 15: Europe Northern Lights Tourism Revenue Share (%), by Application 2025 & 2033
- Figure 16: Europe Northern Lights Tourism Revenue (million), by Types 2025 & 2033
- Figure 17: Europe Northern Lights Tourism Revenue Share (%), by Types 2025 & 2033
- Figure 18: Europe Northern Lights Tourism Revenue (million), by Country 2025 & 2033
- Figure 19: Europe Northern Lights Tourism Revenue Share (%), by Country 2025 & 2033
- Figure 20: Middle East & Africa Northern Lights Tourism Revenue (million), by Application 2025 & 2033
- Figure 21: Middle East & Africa Northern Lights Tourism Revenue Share (%), by Application 2025 & 2033
- Figure 22: Middle East & Africa Northern Lights Tourism Revenue (million), by Types 2025 & 2033
- Figure 23: Middle East & Africa Northern Lights Tourism Revenue Share (%), by Types 2025 & 2033
- Figure 24: Middle East & Africa Northern Lights Tourism Revenue (million), by Country 2025 & 2033
- Figure 25: Middle East & Africa Northern Lights Tourism Revenue Share (%), by Country 2025 & 2033
- Figure 26: Asia Pacific Northern Lights Tourism Revenue (million), by Application 2025 & 2033
- Figure 27: Asia Pacific Northern Lights Tourism Revenue Share (%), by Application 2025 & 2033
- Figure 28: Asia Pacific Northern Lights Tourism Revenue (million), by Types 2025 & 2033
- Figure 29: Asia Pacific Northern Lights Tourism Revenue Share (%), by Types 2025 & 2033
- Figure 30: Asia Pacific Northern Lights Tourism Revenue (million), by Country 2025 & 2033
- Figure 31: Asia Pacific Northern Lights Tourism Revenue Share (%), by Country 2025 & 2033
List of Tables
- Table 1: Global Northern Lights Tourism Revenue million Forecast, by Application 2020 & 2033
- Table 2: Global Northern Lights Tourism Revenue million Forecast, by Types 2020 & 2033
- Table 3: Global Northern Lights Tourism Revenue million Forecast, by Region 2020 & 2033
- Table 4: Global Northern Lights Tourism Revenue million Forecast, by Application 2020 & 2033
- Table 5: Global Northern Lights Tourism Revenue million Forecast, by Types 2020 & 2033
- Table 6: Global Northern Lights Tourism Revenue million Forecast, by Country 2020 & 2033
- Table 7: United States Northern Lights Tourism Revenue (million) Forecast, by Application 2020 & 2033
- Table 8: Canada Northern Lights Tourism Revenue (million) Forecast, by Application 2020 & 2033
- Table 9: Mexico Northern Lights Tourism Revenue (million) Forecast, by Application 2020 & 2033
- Table 10: Global Northern Lights Tourism Revenue million Forecast, by Application 2020 & 2033
- Table 11: Global Northern Lights Tourism Revenue million Forecast, by Types 2020 & 2033
- Table 12: Global Northern Lights Tourism Revenue million Forecast, by Country 2020 & 2033
- Table 13: Brazil Northern Lights Tourism Revenue (million) Forecast, by Application 2020 & 2033
- Table 14: Argentina Northern Lights Tourism Revenue (million) Forecast, by Application 2020 & 2033
- Table 15: Rest of South America Northern Lights Tourism Revenue (million) Forecast, by Application 2020 & 2033
- Table 16: Global Northern Lights Tourism Revenue million Forecast, by Application 2020 & 2033
- Table 17: Global Northern Lights Tourism Revenue million Forecast, by Types 2020 & 2033
- Table 18: Global Northern Lights Tourism Revenue million Forecast, by Country 2020 & 2033
- Table 19: United Kingdom Northern Lights Tourism Revenue (million) Forecast, by Application 2020 & 2033
- Table 20: Germany Northern Lights Tourism Revenue (million) Forecast, by Application 2020 & 2033
- Table 21: France Northern Lights Tourism Revenue (million) Forecast, by Application 2020 & 2033
- Table 22: Italy Northern Lights Tourism Revenue (million) Forecast, by Application 2020 & 2033
- Table 23: Spain Northern Lights Tourism Revenue (million) Forecast, by Application 2020 & 2033
- Table 24: Russia Northern Lights Tourism Revenue (million) Forecast, by Application 2020 & 2033
- Table 25: Benelux Northern Lights Tourism Revenue (million) Forecast, by Application 2020 & 2033
- Table 26: Nordics Northern Lights Tourism Revenue (million) Forecast, by Application 2020 & 2033
- Table 27: Rest of Europe Northern Lights Tourism Revenue (million) Forecast, by Application 2020 & 2033
- Table 28: Global Northern Lights Tourism Revenue million Forecast, by Application 2020 & 2033
- Table 29: Global Northern Lights Tourism Revenue million Forecast, by Types 2020 & 2033
- Table 30: Global Northern Lights Tourism Revenue million Forecast, by Country 2020 & 2033
- Table 31: Turkey Northern Lights Tourism Revenue (million) Forecast, by Application 2020 & 2033
- Table 32: Israel Northern Lights Tourism Revenue (million) Forecast, by Application 2020 & 2033
- Table 33: GCC Northern Lights Tourism Revenue (million) Forecast, by Application 2020 & 2033
- Table 34: North Africa Northern Lights Tourism Revenue (million) Forecast, by Application 2020 & 2033
- Table 35: South Africa Northern Lights Tourism Revenue (million) Forecast, by Application 2020 & 2033
- Table 36: Rest of Middle East & Africa Northern Lights Tourism Revenue (million) Forecast, by Application 2020 & 2033
- Table 37: Global Northern Lights Tourism Revenue million Forecast, by Application 2020 & 2033
- Table 38: Global Northern Lights Tourism Revenue million Forecast, by Types 2020 & 2033
- Table 39: Global Northern Lights Tourism Revenue million Forecast, by Country 2020 & 2033
- Table 40: China Northern Lights Tourism Revenue (million) Forecast, by Application 2020 & 2033
- Table 41: India Northern Lights Tourism Revenue (million) Forecast, by Application 2020 & 2033
- Table 42: Japan Northern Lights Tourism Revenue (million) Forecast, by Application 2020 & 2033
- Table 43: South Korea Northern Lights Tourism Revenue (million) Forecast, by Application 2020 & 2033
- Table 44: ASEAN Northern Lights Tourism Revenue (million) Forecast, by Application 2020 & 2033
- Table 45: Oceania Northern Lights Tourism Revenue (million) Forecast, by Application 2020 & 2033
- Table 46: Rest of Asia Pacific Northern Lights Tourism Revenue (million) Forecast, by Application 2020 & 2033
Frequently Asked Questions
1. What is the projected Compound Annual Growth Rate (CAGR) of the Northern Lights Tourism?
The projected CAGR is approximately 9.6%.
2. Which companies are prominent players in the Northern Lights Tourism?
Key companies in the market include Abercrombie & Kent, Quark Expeditions, Scott Dunn, Exodus Travels, Intrepid Travels, Hurtigruten Expeditions, Butterfield & Robinson Inc., Lindblad Expeditions, Travel Edge, The Aurora Zone.
3. What are the main segments of the Northern Lights Tourism?
The market segments include Application, Types.
4. Can you provide details about the market size?
The market size is estimated to be USD 831 million as of 2022.
5. What are some drivers contributing to market growth?
N/A
6. What are the notable trends driving market growth?
N/A
7. Are there any restraints impacting market growth?
N/A
8. Can you provide examples of recent developments in the market?
N/A
9. What pricing options are available for accessing the report?
Pricing options include single-user, multi-user, and enterprise licenses priced at USD 4350.00, USD 6525.00, and USD 8700.00 respectively.
10. Is the market size provided in terms of value or volume?
The market size is provided in terms of value, measured in million.
11. Are there any specific market keywords associated with the report?
Yes, the market keyword associated with the report is "Northern Lights Tourism," which aids in identifying and referencing the specific market segment covered.
12. How do I determine which pricing option suits my needs best?
The pricing options vary based on user requirements and access needs. Individual users may opt for single-user licenses, while businesses requiring broader access may choose multi-user or enterprise licenses for cost-effective access to the report.
13. Are there any additional resources or data provided in the Northern Lights Tourism report?
While the report offers comprehensive insights, it's advisable to review the specific contents or supplementary materials provided to ascertain if additional resources or data are available.
14. How can I stay updated on further developments or reports in the Northern Lights Tourism?
To stay informed about further developments, trends, and reports in the Northern Lights Tourism, consider subscribing to industry newsletters, following relevant companies and organizations, or regularly checking reputable industry news sources and publications.
Methodology
Step 1 - Identification of Relevant Samples Size from Population Database


Step 2 - Approaches for Defining Global Market Size (Value, Volume* & Price*)

Note*: In applicable scenarios
Step 3 - Data Sources
Primary Research
- Web Analytics
- Survey Reports
- Research Institute
- Latest Research Reports
- Opinion Leaders
Secondary Research
- Annual Reports
- White Paper
- Latest Press Release
- Industry Association
- Paid Database
- Investor Presentations

Step 4 - Data Triangulation
Involves using different sources of information in order to increase the validity of a study
These sources are likely to be stakeholders in a program - participants, other researchers, program staff, other community members, and so on.
Then we put all data in single framework & apply various statistical tools to find out the dynamic on the market.
During the analysis stage, feedback from the stakeholder groups would be compared to determine areas of agreement as well as areas of divergence