

Key Insights
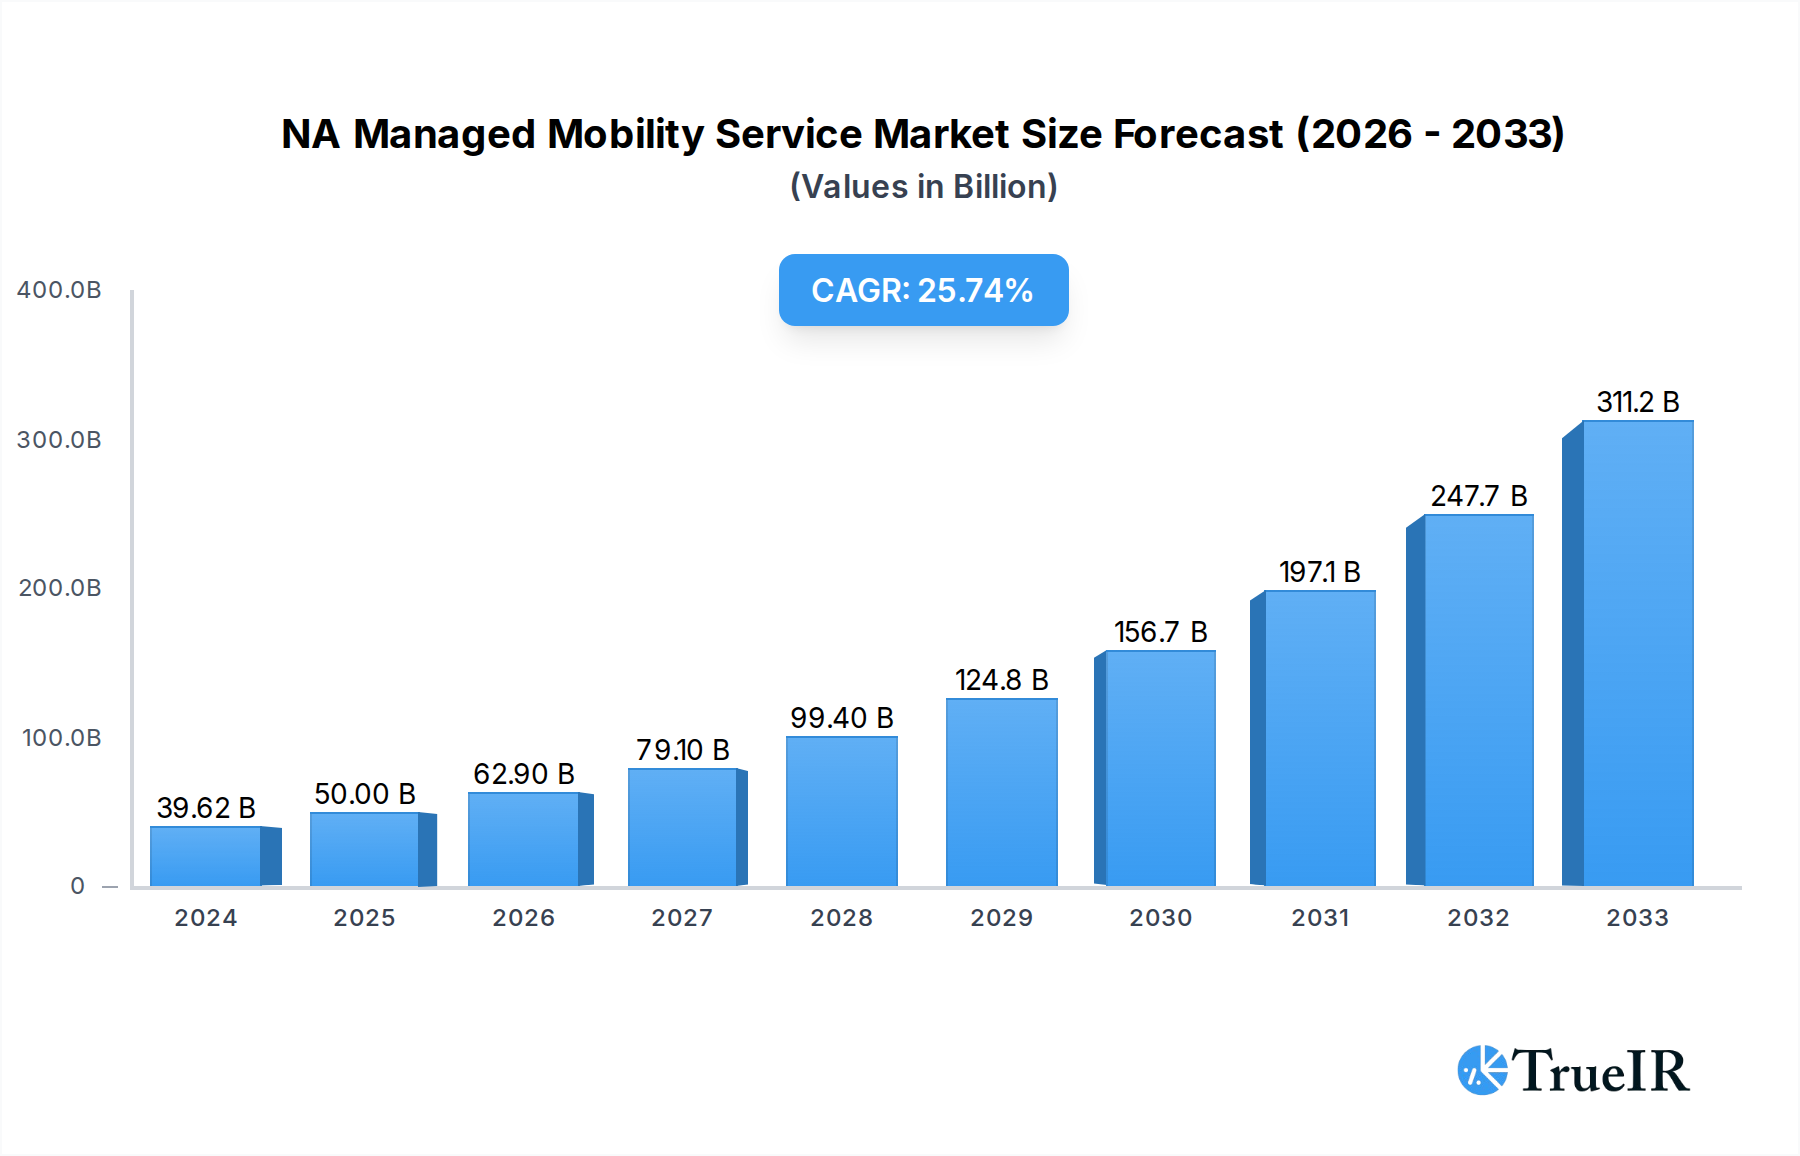
The North American Managed Mobility Services (MMS) market is experiencing robust growth, driven by the increasing adoption of mobile devices across enterprises and the escalating need for effective management and security of these devices. In 2024, the market size is estimated at approximately $39.62 billion, fueled by the significant demand for streamlined mobile operations, enhanced data security, and improved employee productivity. The compound annual growth rate (CAGR) is projected at a substantial 25.77% during the forecast period of 2025-2033. This impressive growth is primarily attributed to the continuous evolution of mobile technologies, the proliferation of Bring Your Own Device (BYOD) and Choose Your Own Device (CYOD) policies, and the growing complexity of managing diverse mobile fleets. Key drivers include the need to safeguard sensitive corporate data from sophisticated cyber threats, optimize mobile application deployment and lifecycle management, and ensure compliance with evolving regulatory landscapes. Businesses across various sectors, particularly BFSI, Healthcare, and Retail, are increasingly outsourcing their mobility management functions to specialized service providers to leverage expertise and reduce operational overheads.

NA Managed Mobility Service Market Market Size (In Billion)
The North American MMS market is characterized by a strong emphasis on cloud-based solutions, offering scalability, flexibility, and cost-effectiveness for businesses. While on-premise solutions continue to hold relevance for organizations with stringent security requirements, the trend is leaning heavily towards cloud deployments. The market segments are dominated by Mobile Device Management (MDM) and Mobile Security solutions, reflecting the paramount importance of device control and data protection. The IT and Telecom sector, along with BFSI and Healthcare, are the leading end-user industries, actively investing in MMS to support their mobile workforces and secure critical information. Key players like DELL Technologies, Accenture PLC, IBM Corporation, and Tech Mahindra Limited are at the forefront, offering comprehensive MMS portfolios and innovative solutions to meet the dynamic needs of this burgeoning market. The competitive landscape is intensifying, with companies focusing on advanced analytics, AI-driven security, and integrated mobility solutions to gain a competitive edge.
NA Managed Mobility Service Market Company Market Share
NA Managed Mobility Service Market: In-depth Analysis and Future Projections (2019-2033)
This comprehensive report provides an exhaustive analysis of the North American Managed Mobility Service Market, offering critical insights for stakeholders navigating this dynamic sector. Covering the historical period of 2019-2024, the base year of 2025, and an extensive forecast period from 2025 to 2033, this research delves into market structure, trends, opportunities, dominant segments, product innovations, key drivers, barriers, and the future outlook. The North American Managed Mobility Service Market is projected to reach a valuation of over $100 billion by 2025, with a projected Compound Annual Growth Rate (CAGR) of xx% through 2033.
NA Managed Mobility Service Market Market Structure & Competitive Landscape
The North American Managed Mobility Service Market exhibits a moderately consolidated structure, characterized by the presence of a few dominant players and a wider array of specialized service providers. Innovation drivers, such as the increasing adoption of Bring Your Own Device (BYOD) policies and the growing demand for secure mobile access to enterprise resources, are shaping competitive strategies. Regulatory impacts, particularly concerning data privacy and security regulations like GDPR and CCPA, are influencing service offerings and compliance mandates. Product substitutes, including in-house IT management solutions and less comprehensive mobile management tools, pose a competitive challenge.
End-user segmentation reveals a significant concentration within the IT and Telecom, BFSI, and Healthcare sectors, driven by their substantial mobile workforces and stringent security requirements. Mergers and Acquisitions (M&A) trends indicate strategic consolidation, with major players acquiring smaller, innovative companies to expand their service portfolios and market reach. In the historical period (2019-2024), an estimated xx M&A deals with a combined value of over $10 billion were observed. Concentration ratios for the top 5 players are estimated to be around 60%, highlighting a significant market share held by leading entities.
NA Managed Mobility Service Market Market Trends & Opportunities
The North American Managed Mobility Service Market is experiencing robust growth, driven by an escalating need for businesses to manage and secure their increasingly mobile workforces. The market size is projected to expand significantly from an estimated $90 billion in 2024 to over $120 billion by 2033, demonstrating a healthy CAGR of xx%. This expansion is fueled by fundamental technological shifts, including the widespread adoption of 5G technology, which enables faster and more reliable mobile connectivity, thus unlocking new possibilities for mobile application development and deployment. The proliferation of smartphones, tablets, and other mobile devices across all strata of the workforce continues to be a primary catalyst.
Consumer preferences are increasingly leaning towards seamless, secure, and user-friendly mobile experiences, pushing managed mobility service providers to offer more intuitive and integrated solutions. This includes a focus on enhanced user support, streamlined device provisioning, and advanced self-service portals. Competitive dynamics are intensifying, with providers differentiating themselves through specialized security features, advanced analytics, and proactive threat detection capabilities. The rise of the Internet of Things (IoT) further broadens the scope of managed mobility services, extending to the management and security of connected devices in enterprise environments.
Opportunities abound for providers offering comprehensive lifecycle management of mobile devices, from procurement and deployment to ongoing support, security, and eventual decommissioning. The growing demand for cloud-based mobility solutions, offering scalability and cost-effectiveness, presents a significant growth avenue. Furthermore, the increasing complexity of mobile security threats necessitates advanced endpoint protection and data loss prevention strategies, creating a sustained demand for sophisticated managed security services. The market penetration rate for managed mobility services is expected to rise from xx% in 2024 to xx% by 2033, indicating substantial untapped potential. The estimated market size for the Managed Device Management segment alone is projected to exceed $40 billion by 2025.
Dominant Markets & Segments in NA Managed Mobility Service Market
The North American Managed Mobility Service Market demonstrates clear dominance across specific regions, deployments, and end-user industries, reflecting varying levels of adoption and specific industry needs.
Dominant Deployment: The Cloud deployment model is unequivocally leading the market. This dominance is driven by its inherent scalability, flexibility, and cost-efficiency, allowing businesses to adapt their mobility infrastructure rapidly to changing demands without significant upfront capital investment. Cloud solutions also simplify updates and maintenance, reducing the burden on internal IT departments. On-premise solutions, while still relevant for organizations with stringent data sovereignty requirements, are experiencing slower growth compared to their cloud counterparts. The cloud segment is estimated to account for over 70% of the market share in 2025.
Dominant End-User Industry: The IT and Telecom sector stands out as the largest consumer of managed mobility services. This is attributed to the industry's inherently mobile workforce, its reliance on advanced communication technologies, and its critical need for robust security to protect sensitive customer data and intellectual property. The BFSI (Banking, Financial Services, and Insurance) sector follows closely, driven by the imperative for secure mobile banking applications, remote workforce management, and compliance with stringent financial regulations. The Healthcare industry is also a rapidly growing segment, with the increasing adoption of telehealth services and the need to manage mobile devices used by medical professionals for patient care and data access.
Dominant Type: Within the service types, Mobile Device Management (MDM) continues to hold a significant share, providing essential capabilities for configuring, securing, and monitoring mobile devices. However, Mobile Security is experiencing the fastest growth. This surge is fueled by the escalating sophistication of cyber threats, the proliferation of sensitive data on mobile devices, and the increasing regulatory pressure on organizations to protect this information. Mobile Application Management (MAM) is also gaining traction as organizations seek to manage and secure specific applications and their data, independent of the device itself.
Key growth drivers for the dominance of cloud deployments and the IT/Telecom and BFSI sectors include:
- Scalability and Cost-Effectiveness: Cloud infrastructure allows for on-demand resource allocation, reducing operational expenses.
- Enhanced Security Posture: Specialized security features within managed services are crucial for industries handling sensitive data.
- Regulatory Compliance: Managed service providers offer expertise in navigating complex compliance landscapes.
- Remote Workforce Enablement: The widespread adoption of remote and hybrid work models necessitates robust mobile management solutions.
- Technological Advancements: Integration with emerging technologies like AI for security analytics and 5G for enhanced connectivity further bolsters adoption.
NA Managed Mobility Service Market Product Analysis
Product innovations in the NA Managed Mobility Service Market are centered on delivering comprehensive, secure, and user-centric mobile solutions. Advancements in Mobile Device Management (MDM) platforms now integrate advanced AI-driven analytics for proactive threat detection and predictive maintenance, ensuring optimal device performance and security. Mobile Security solutions are evolving beyond traditional endpoint protection to incorporate Zero Trust Network Access (ZTNA) frameworks and sophisticated data loss prevention (DLP) capabilities, safeguarding sensitive corporate information across all mobile endpoints. Mobile Application Management (MAM) is focusing on containerization and granular policy enforcement to isolate corporate data within applications, providing greater control and security. The competitive advantage lies in the seamless integration of these diverse functionalities into a unified platform, offering businesses a single pane of glass for managing their entire mobile ecosystem.
Key Drivers, Barriers & Challenges in NA Managed Mobility Service Market
Key Drivers: The North American Managed Mobility Service Market is propelled by the ubiquitous adoption of mobile devices for business operations, the increasing demand for secure remote work capabilities, and the growing complexity of mobile security threats. Technological advancements, such as the rollout of 5G and the expansion of IoT, are creating new opportunities for managed mobility services. Furthermore, evolving regulatory landscapes, particularly concerning data privacy and security, are compelling organizations to seek expert management of their mobile environments. The efficiency gains and cost reductions associated with outsourcing mobility management are also significant drivers.
Barriers & Challenges: Key challenges impacting the market include the persistent concern over data security and privacy, despite the services offered. Integrating disparate mobile devices and operating systems into a cohesive management framework remains complex for many organizations. The initial cost of transitioning to managed mobility services can also be a barrier for smaller enterprises. Additionally, the rapidly evolving threat landscape requires constant vigilance and adaptation from service providers, and the availability of skilled IT professionals to manage these complex systems can be a constraint. Supply chain disruptions for hardware can also indirectly impact service delivery.
Growth Drivers in the NA Managed Mobility Service Market Market
The North American Managed Mobility Service Market is experiencing substantial growth driven by several key factors. The continuous rise in mobile-first business strategies and the widespread adoption of Bring Your Own Device (BYOD) policies necessitate robust management and security solutions. Technological advancements, particularly the expansion of 5G networks, are enabling more sophisticated mobile applications and services, driving demand for their efficient management. Economic factors, such as the pursuit of operational efficiency and cost optimization, are encouraging businesses to outsource their mobility management needs. Regulatory mandates around data protection and privacy are also playing a significant role, pushing organizations to ensure compliance through expert-managed services.
Challenges Impacting NA Managed Mobility Service Market Growth
Several challenges continue to impact the growth trajectory of the North American Managed Mobility Service Market. Regulatory complexities surrounding data privacy and cross-border data transfers can create significant hurdles for service providers and their clients. Persistent supply chain issues for mobile hardware can lead to delays in device deployment and replacements, affecting service continuity. Intense competitive pressures from both established players and emerging niche providers can drive down margins and necessitate continuous innovation to maintain market share. Furthermore, the evolving nature of cyber threats requires constant investment in advanced security technologies and expertise, posing an ongoing challenge for service providers to stay ahead of malicious actors.
Key Players Shaping the NA Managed Mobility Service Market Market
- DELL Technologies
- Accenture PLC
- Citrix System Inc
- Orange SA
- IBM Corporation
- Wipro Ltd
- Fujitsu Ltd
- Hewlett Packard Enterprise Company
- Tech Mahindra Limited
- AT&T Inc
- Telefonica SA
Significant NA Managed Mobility Service Market Industry Milestones
- 2019: Increased adoption of MDM solutions as enterprises formalize BYOD policies.
- 2020: Surge in demand for remote work enablement solutions due to the global pandemic.
- 2021: Enhanced focus on mobile security with the rise of sophisticated ransomware attacks.
- 2022: Introduction of AI-powered analytics for proactive threat detection and device management.
- 2023: Growing integration of IoT device management within broader mobility service offerings.
- 2024: Advancements in cloud-native mobility management platforms for greater scalability and agility.
Future Outlook for NA Managed Mobility Service Market Market
The future outlook for the NA Managed Mobility Service Market is exceptionally bright, characterized by sustained growth and evolving service offerings. The increasing reliance on mobile technologies for all aspects of business operations will continue to drive demand for comprehensive management and security solutions. Strategic opportunities lie in the deeper integration of AI and machine learning for predictive analytics, advanced threat intelligence, and automated device lifecycle management. The expansion of the Internet of Things (IoT) ecosystem presents a significant untapped market, requiring specialized managed solutions. Furthermore, the growing adoption of Zero Trust security models will necessitate sophisticated mobile endpoint security, creating a continuous demand for innovative and proactive managed services. The market is poised for further consolidation and specialization as providers aim to offer end-to-end mobility solutions that address the complex needs of the modern enterprise.
NA Managed Mobility Service Market Segmentation
-
1. Type
- 1.1. Mobile Device Management
- 1.2. Mobile Security
- 1.3. Mobile Application Management
- 1.4. Other Type
-
2. Deployment
- 2.1. Cloud
- 2.2. On-premise
-
3. End-user Industry
- 3.1. BFSI
- 3.2. Retail
- 3.3. Power and Energy
- 3.4. Manufacturing
- 3.5. IT and Telecom
- 3.6. Education
- 3.7. Healthcare
- 3.8. Other End-user Industry
NA Managed Mobility Service Market Segmentation By Geography
-
1. North America
- 1.1. United States
- 1.2. Canada
- 1.3. Mexico
-
2. South America
- 2.1. Brazil
- 2.2. Argentina
- 2.3. Rest of South America
-
3. Europe
- 3.1. United Kingdom
- 3.2. Germany
- 3.3. France
- 3.4. Italy
- 3.5. Spain
- 3.6. Russia
- 3.7. Benelux
- 3.8. Nordics
- 3.9. Rest of Europe
-
4. Middle East & Africa
- 4.1. Turkey
- 4.2. Israel
- 4.3. GCC
- 4.4. North Africa
- 4.5. South Africa
- 4.6. Rest of Middle East & Africa
-
5. Asia Pacific
- 5.1. China
- 5.2. India
- 5.3. Japan
- 5.4. South Korea
- 5.5. ASEAN
- 5.6. Oceania
- 5.7. Rest of Asia Pacific
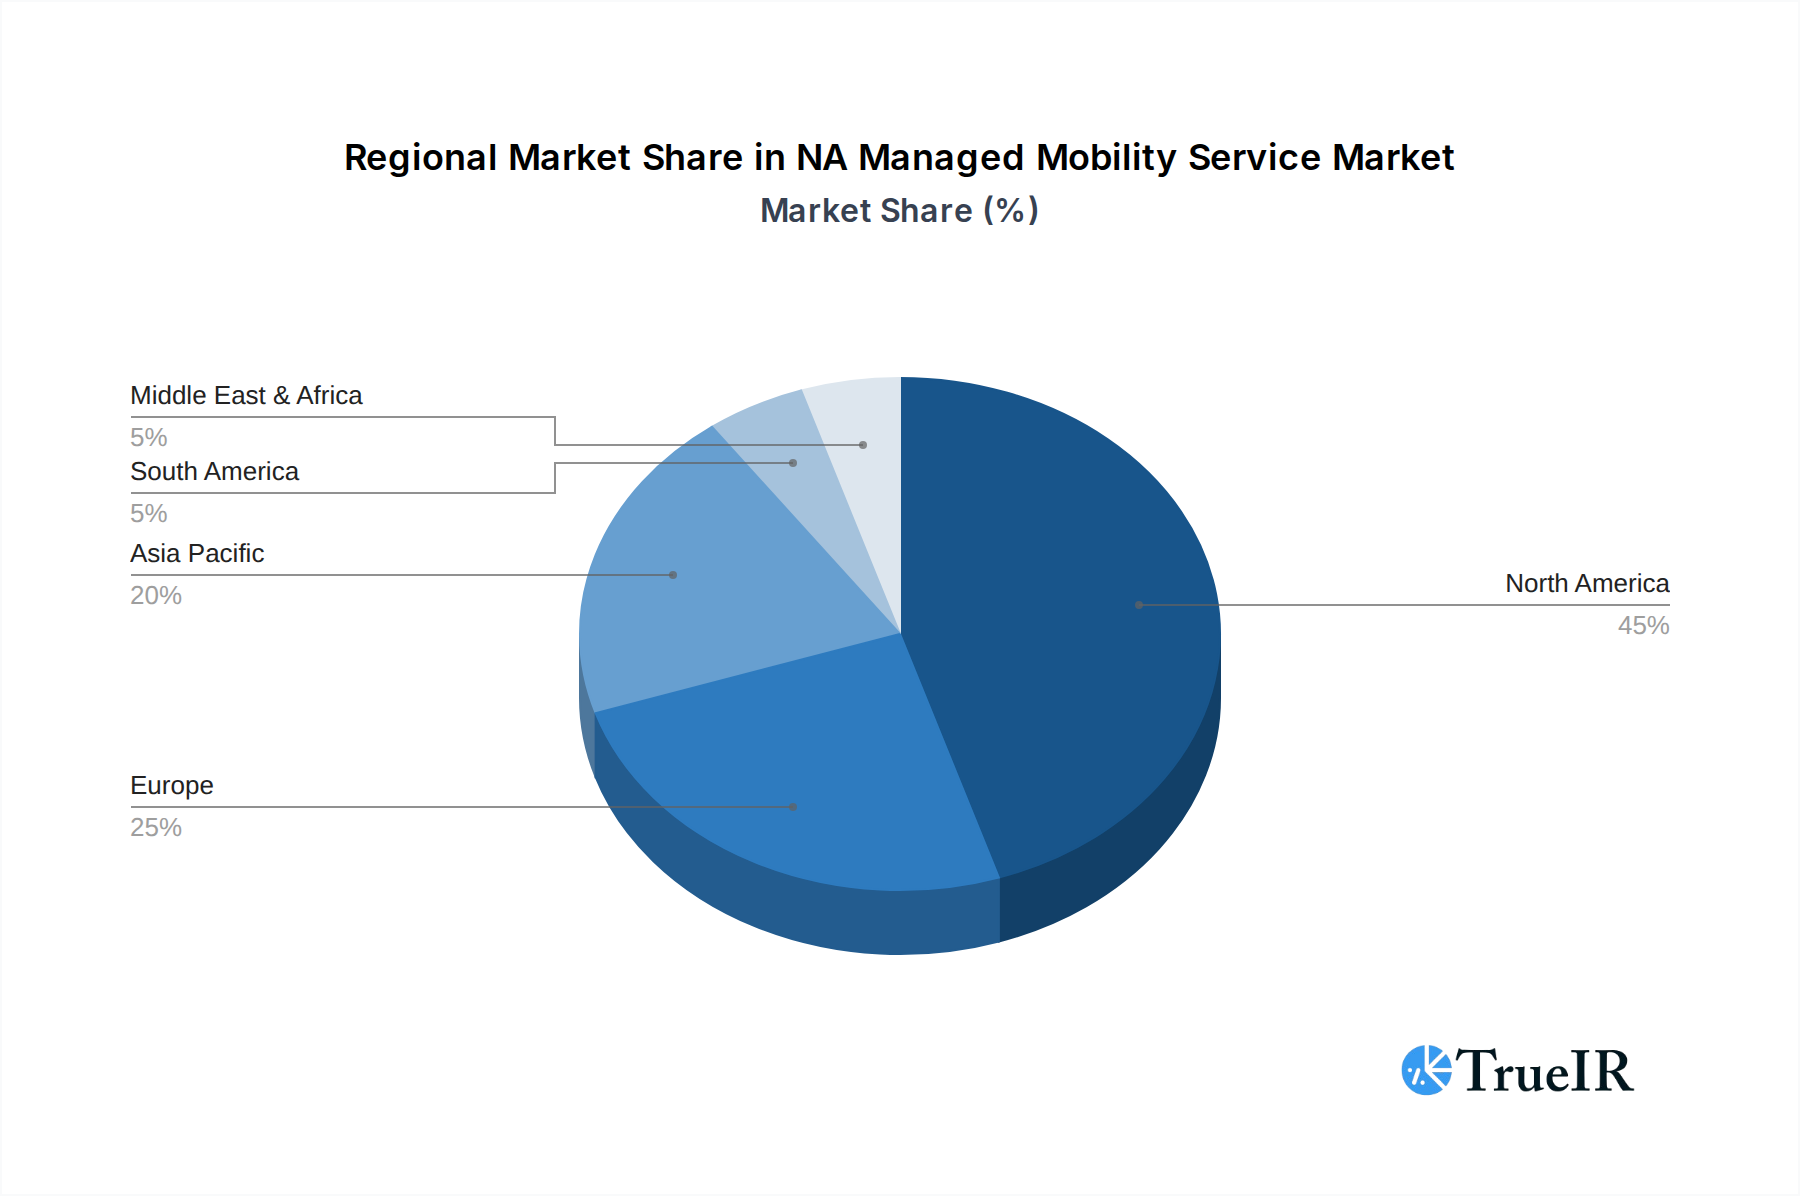
NA Managed Mobility Service Market Regional Market Share
Geographic Coverage of NA Managed Mobility Service Market
NA Managed Mobility Service Market REPORT HIGHLIGHTS
| Aspects | Details |
|---|---|
| Study Period | 2020-2034 |
| Base Year | 2025 |
| Estimated Year | 2026 |
| Forecast Period | 2026-2034 |
| Historical Period | 2020-2025 |
| Growth Rate | CAGR of 25.77% from 2020-2034 |
| Segmentation |
|
Table of Contents
- 1. Introduction
- 1.1. Research Scope
- 1.2. Market Segmentation
- 1.3. Research Objective
- 1.4. Definitions and Assumptions
- 2. Executive Summary
- 2.1. Market Snapshot
- 3. Market Dynamics
- 3.1. Market Drivers
- 3.2. Market Restrains
- 3.3. Market Trends
- 3.4. Market Opportunities
- 4. Market Factor Analysis
- 4.1. Porters Five Forces
- 4.1.1. Bargaining Power of Suppliers
- 4.1.2. Bargaining Power of Buyers
- 4.1.3. Threat of New Entrants
- 4.1.4. Threat of Substitutes
- 4.1.5. Competitive Rivalry
- 4.2. PESTEL analysis
- 4.3. BCG Analysis
- 4.3.1. Stars (High Growth, High Market Share)
- 4.3.2. Cash Cows (Low Growth, High Market Share)
- 4.3.3. Question Mark (High Growth, Low Market Share)
- 4.3.4. Dogs (Low Growth, Low Market Share)
- 4.4. Ansoff Matrix Analysis
- 4.5. Supply Chain Analysis
- 4.6. Regulatory Landscape
- 4.7. Current Market Potential and Opportunity Assessment (TAM–SAM–SOM Framework)
- 4.8. TIR Analyst Note
- 4.1. Porters Five Forces
- 5. Market Analysis, Insights and Forecast 2021-2033
- 5.1. Market Analysis, Insights and Forecast - by Type
- 5.1.1. Mobile Device Management
- 5.1.2. Mobile Security
- 5.1.3. Mobile Application Management
- 5.1.4. Other Type
- 5.2. Market Analysis, Insights and Forecast - by Deployment
- 5.2.1. Cloud
- 5.2.2. On-premise
- 5.3. Market Analysis, Insights and Forecast - by End-user Industry
- 5.3.1. BFSI
- 5.3.2. Retail
- 5.3.3. Power and Energy
- 5.3.4. Manufacturing
- 5.3.5. IT and Telecom
- 5.3.6. Education
- 5.3.7. Healthcare
- 5.3.8. Other End-user Industry
- 5.4. Market Analysis, Insights and Forecast - by Region
- 5.4.1. North America
- 5.4.2. South America
- 5.4.3. Europe
- 5.4.4. Middle East & Africa
- 5.4.5. Asia Pacific
- 5.1. Market Analysis, Insights and Forecast - by Type
- 6. Global NA Managed Mobility Service Market Analysis, Insights and Forecast, 2021-2033
- 6.1. Market Analysis, Insights and Forecast - by Type
- 6.1.1. Mobile Device Management
- 6.1.2. Mobile Security
- 6.1.3. Mobile Application Management
- 6.1.4. Other Type
- 6.2. Market Analysis, Insights and Forecast - by Deployment
- 6.2.1. Cloud
- 6.2.2. On-premise
- 6.3. Market Analysis, Insights and Forecast - by End-user Industry
- 6.3.1. BFSI
- 6.3.2. Retail
- 6.3.3. Power and Energy
- 6.3.4. Manufacturing
- 6.3.5. IT and Telecom
- 6.3.6. Education
- 6.3.7. Healthcare
- 6.3.8. Other End-user Industry
- 6.1. Market Analysis, Insights and Forecast - by Type
- 7. North America NA Managed Mobility Service Market Analysis, Insights and Forecast, 2020-2032
- 7.1. Market Analysis, Insights and Forecast - by Type
- 7.1.1. Mobile Device Management
- 7.1.2. Mobile Security
- 7.1.3. Mobile Application Management
- 7.1.4. Other Type
- 7.2. Market Analysis, Insights and Forecast - by Deployment
- 7.2.1. Cloud
- 7.2.2. On-premise
- 7.3. Market Analysis, Insights and Forecast - by End-user Industry
- 7.3.1. BFSI
- 7.3.2. Retail
- 7.3.3. Power and Energy
- 7.3.4. Manufacturing
- 7.3.5. IT and Telecom
- 7.3.6. Education
- 7.3.7. Healthcare
- 7.3.8. Other End-user Industry
- 7.1. Market Analysis, Insights and Forecast - by Type
- 8. South America NA Managed Mobility Service Market Analysis, Insights and Forecast, 2020-2032
- 8.1. Market Analysis, Insights and Forecast - by Type
- 8.1.1. Mobile Device Management
- 8.1.2. Mobile Security
- 8.1.3. Mobile Application Management
- 8.1.4. Other Type
- 8.2. Market Analysis, Insights and Forecast - by Deployment
- 8.2.1. Cloud
- 8.2.2. On-premise
- 8.3. Market Analysis, Insights and Forecast - by End-user Industry
- 8.3.1. BFSI
- 8.3.2. Retail
- 8.3.3. Power and Energy
- 8.3.4. Manufacturing
- 8.3.5. IT and Telecom
- 8.3.6. Education
- 8.3.7. Healthcare
- 8.3.8. Other End-user Industry
- 8.1. Market Analysis, Insights and Forecast - by Type
- 9. Europe NA Managed Mobility Service Market Analysis, Insights and Forecast, 2020-2032
- 9.1. Market Analysis, Insights and Forecast - by Type
- 9.1.1. Mobile Device Management
- 9.1.2. Mobile Security
- 9.1.3. Mobile Application Management
- 9.1.4. Other Type
- 9.2. Market Analysis, Insights and Forecast - by Deployment
- 9.2.1. Cloud
- 9.2.2. On-premise
- 9.3. Market Analysis, Insights and Forecast - by End-user Industry
- 9.3.1. BFSI
- 9.3.2. Retail
- 9.3.3. Power and Energy
- 9.3.4. Manufacturing
- 9.3.5. IT and Telecom
- 9.3.6. Education
- 9.3.7. Healthcare
- 9.3.8. Other End-user Industry
- 9.1. Market Analysis, Insights and Forecast - by Type
- 10. Middle East & Africa NA Managed Mobility Service Market Analysis, Insights and Forecast, 2020-2032
- 10.1. Market Analysis, Insights and Forecast - by Type
- 10.1.1. Mobile Device Management
- 10.1.2. Mobile Security
- 10.1.3. Mobile Application Management
- 10.1.4. Other Type
- 10.2. Market Analysis, Insights and Forecast - by Deployment
- 10.2.1. Cloud
- 10.2.2. On-premise
- 10.3. Market Analysis, Insights and Forecast - by End-user Industry
- 10.3.1. BFSI
- 10.3.2. Retail
- 10.3.3. Power and Energy
- 10.3.4. Manufacturing
- 10.3.5. IT and Telecom
- 10.3.6. Education
- 10.3.7. Healthcare
- 10.3.8. Other End-user Industry
- 10.1. Market Analysis, Insights and Forecast - by Type
- 11. Asia Pacific NA Managed Mobility Service Market Analysis, Insights and Forecast, 2020-2032
- 11.1. Market Analysis, Insights and Forecast - by Type
- 11.1.1. Mobile Device Management
- 11.1.2. Mobile Security
- 11.1.3. Mobile Application Management
- 11.1.4. Other Type
- 11.2. Market Analysis, Insights and Forecast - by Deployment
- 11.2.1. Cloud
- 11.2.2. On-premise
- 11.3. Market Analysis, Insights and Forecast - by End-user Industry
- 11.3.1. BFSI
- 11.3.2. Retail
- 11.3.3. Power and Energy
- 11.3.4. Manufacturing
- 11.3.5. IT and Telecom
- 11.3.6. Education
- 11.3.7. Healthcare
- 11.3.8. Other End-user Industry
- 11.1. Market Analysis, Insights and Forecast - by Type
- 12. Competitive Analysis
- 12.1. Company Profiles
- 12.1.1 DELL Technologies
- 12.1.1.1. Company Overview
- 12.1.1.2. Products
- 12.1.1.3. Company Financials
- 12.1.1.4. SWOT Analysis
- 12.1.2 Accenture PLC
- 12.1.2.1. Company Overview
- 12.1.2.2. Products
- 12.1.2.3. Company Financials
- 12.1.2.4. SWOT Analysis
- 12.1.3 Citrix System Inc
- 12.1.3.1. Company Overview
- 12.1.3.2. Products
- 12.1.3.3. Company Financials
- 12.1.3.4. SWOT Analysis
- 12.1.4 Orange SA
- 12.1.4.1. Company Overview
- 12.1.4.2. Products
- 12.1.4.3. Company Financials
- 12.1.4.4. SWOT Analysis
- 12.1.5 IBM Corporation
- 12.1.5.1. Company Overview
- 12.1.5.2. Products
- 12.1.5.3. Company Financials
- 12.1.5.4. SWOT Analysis
- 12.1.6 Wipro Ltd
- 12.1.6.1. Company Overview
- 12.1.6.2. Products
- 12.1.6.3. Company Financials
- 12.1.6.4. SWOT Analysis
- 12.1.7 Fujitsu Ltd
- 12.1.7.1. Company Overview
- 12.1.7.2. Products
- 12.1.7.3. Company Financials
- 12.1.7.4. SWOT Analysis
- 12.1.8 Hewlett Packard Enterprise Company
- 12.1.8.1. Company Overview
- 12.1.8.2. Products
- 12.1.8.3. Company Financials
- 12.1.8.4. SWOT Analysis
- 12.1.9 Tech Mahindra Limited
- 12.1.9.1. Company Overview
- 12.1.9.2. Products
- 12.1.9.3. Company Financials
- 12.1.9.4. SWOT Analysis
- 12.1.10 AT&T Inc
- 12.1.10.1. Company Overview
- 12.1.10.2. Products
- 12.1.10.3. Company Financials
- 12.1.10.4. SWOT Analysis
- 12.1.11 Telefonica SA
- 12.1.11.1. Company Overview
- 12.1.11.2. Products
- 12.1.11.3. Company Financials
- 12.1.11.4. SWOT Analysis
- 12.1.1 DELL Technologies
- 12.2. Market Entropy
- 12.2.1 Company's Key Areas Served
- 12.2.2 Recent Developments
- 12.3. Company Market Share Analysis 2025
- 12.3.1 Top 5 Companies Market Share Analysis
- 12.3.2 Top 3 Companies Market Share Analysis
- 12.4. List of Potential Customers
- 13. Research Methodology
List of Figures
- Figure 1: Global NA Managed Mobility Service Market Revenue Breakdown (billion, %) by Region 2025 & 2033
- Figure 2: Global NA Managed Mobility Service Market Volume Breakdown (K Unit, %) by Region 2025 & 2033
- Figure 3: North America NA Managed Mobility Service Market Revenue (billion), by Type 2025 & 2033
- Figure 4: North America NA Managed Mobility Service Market Volume (K Unit), by Type 2025 & 2033
- Figure 5: North America NA Managed Mobility Service Market Revenue Share (%), by Type 2025 & 2033
- Figure 6: North America NA Managed Mobility Service Market Volume Share (%), by Type 2025 & 2033
- Figure 7: North America NA Managed Mobility Service Market Revenue (billion), by Deployment 2025 & 2033
- Figure 8: North America NA Managed Mobility Service Market Volume (K Unit), by Deployment 2025 & 2033
- Figure 9: North America NA Managed Mobility Service Market Revenue Share (%), by Deployment 2025 & 2033
- Figure 10: North America NA Managed Mobility Service Market Volume Share (%), by Deployment 2025 & 2033
- Figure 11: North America NA Managed Mobility Service Market Revenue (billion), by End-user Industry 2025 & 2033
- Figure 12: North America NA Managed Mobility Service Market Volume (K Unit), by End-user Industry 2025 & 2033
- Figure 13: North America NA Managed Mobility Service Market Revenue Share (%), by End-user Industry 2025 & 2033
- Figure 14: North America NA Managed Mobility Service Market Volume Share (%), by End-user Industry 2025 & 2033
- Figure 15: North America NA Managed Mobility Service Market Revenue (billion), by Country 2025 & 2033
- Figure 16: North America NA Managed Mobility Service Market Volume (K Unit), by Country 2025 & 2033
- Figure 17: North America NA Managed Mobility Service Market Revenue Share (%), by Country 2025 & 2033
- Figure 18: North America NA Managed Mobility Service Market Volume Share (%), by Country 2025 & 2033
- Figure 19: South America NA Managed Mobility Service Market Revenue (billion), by Type 2025 & 2033
- Figure 20: South America NA Managed Mobility Service Market Volume (K Unit), by Type 2025 & 2033
- Figure 21: South America NA Managed Mobility Service Market Revenue Share (%), by Type 2025 & 2033
- Figure 22: South America NA Managed Mobility Service Market Volume Share (%), by Type 2025 & 2033
- Figure 23: South America NA Managed Mobility Service Market Revenue (billion), by Deployment 2025 & 2033
- Figure 24: South America NA Managed Mobility Service Market Volume (K Unit), by Deployment 2025 & 2033
- Figure 25: South America NA Managed Mobility Service Market Revenue Share (%), by Deployment 2025 & 2033
- Figure 26: South America NA Managed Mobility Service Market Volume Share (%), by Deployment 2025 & 2033
- Figure 27: South America NA Managed Mobility Service Market Revenue (billion), by End-user Industry 2025 & 2033
- Figure 28: South America NA Managed Mobility Service Market Volume (K Unit), by End-user Industry 2025 & 2033
- Figure 29: South America NA Managed Mobility Service Market Revenue Share (%), by End-user Industry 2025 & 2033
- Figure 30: South America NA Managed Mobility Service Market Volume Share (%), by End-user Industry 2025 & 2033
- Figure 31: South America NA Managed Mobility Service Market Revenue (billion), by Country 2025 & 2033
- Figure 32: South America NA Managed Mobility Service Market Volume (K Unit), by Country 2025 & 2033
- Figure 33: South America NA Managed Mobility Service Market Revenue Share (%), by Country 2025 & 2033
- Figure 34: South America NA Managed Mobility Service Market Volume Share (%), by Country 2025 & 2033
- Figure 35: Europe NA Managed Mobility Service Market Revenue (billion), by Type 2025 & 2033
- Figure 36: Europe NA Managed Mobility Service Market Volume (K Unit), by Type 2025 & 2033
- Figure 37: Europe NA Managed Mobility Service Market Revenue Share (%), by Type 2025 & 2033
- Figure 38: Europe NA Managed Mobility Service Market Volume Share (%), by Type 2025 & 2033
- Figure 39: Europe NA Managed Mobility Service Market Revenue (billion), by Deployment 2025 & 2033
- Figure 40: Europe NA Managed Mobility Service Market Volume (K Unit), by Deployment 2025 & 2033
- Figure 41: Europe NA Managed Mobility Service Market Revenue Share (%), by Deployment 2025 & 2033
- Figure 42: Europe NA Managed Mobility Service Market Volume Share (%), by Deployment 2025 & 2033
- Figure 43: Europe NA Managed Mobility Service Market Revenue (billion), by End-user Industry 2025 & 2033
- Figure 44: Europe NA Managed Mobility Service Market Volume (K Unit), by End-user Industry 2025 & 2033
- Figure 45: Europe NA Managed Mobility Service Market Revenue Share (%), by End-user Industry 2025 & 2033
- Figure 46: Europe NA Managed Mobility Service Market Volume Share (%), by End-user Industry 2025 & 2033
- Figure 47: Europe NA Managed Mobility Service Market Revenue (billion), by Country 2025 & 2033
- Figure 48: Europe NA Managed Mobility Service Market Volume (K Unit), by Country 2025 & 2033
- Figure 49: Europe NA Managed Mobility Service Market Revenue Share (%), by Country 2025 & 2033
- Figure 50: Europe NA Managed Mobility Service Market Volume Share (%), by Country 2025 & 2033
- Figure 51: Middle East & Africa NA Managed Mobility Service Market Revenue (billion), by Type 2025 & 2033
- Figure 52: Middle East & Africa NA Managed Mobility Service Market Volume (K Unit), by Type 2025 & 2033
- Figure 53: Middle East & Africa NA Managed Mobility Service Market Revenue Share (%), by Type 2025 & 2033
- Figure 54: Middle East & Africa NA Managed Mobility Service Market Volume Share (%), by Type 2025 & 2033
- Figure 55: Middle East & Africa NA Managed Mobility Service Market Revenue (billion), by Deployment 2025 & 2033
- Figure 56: Middle East & Africa NA Managed Mobility Service Market Volume (K Unit), by Deployment 2025 & 2033
- Figure 57: Middle East & Africa NA Managed Mobility Service Market Revenue Share (%), by Deployment 2025 & 2033
- Figure 58: Middle East & Africa NA Managed Mobility Service Market Volume Share (%), by Deployment 2025 & 2033
- Figure 59: Middle East & Africa NA Managed Mobility Service Market Revenue (billion), by End-user Industry 2025 & 2033
- Figure 60: Middle East & Africa NA Managed Mobility Service Market Volume (K Unit), by End-user Industry 2025 & 2033
- Figure 61: Middle East & Africa NA Managed Mobility Service Market Revenue Share (%), by End-user Industry 2025 & 2033
- Figure 62: Middle East & Africa NA Managed Mobility Service Market Volume Share (%), by End-user Industry 2025 & 2033
- Figure 63: Middle East & Africa NA Managed Mobility Service Market Revenue (billion), by Country 2025 & 2033
- Figure 64: Middle East & Africa NA Managed Mobility Service Market Volume (K Unit), by Country 2025 & 2033
- Figure 65: Middle East & Africa NA Managed Mobility Service Market Revenue Share (%), by Country 2025 & 2033
- Figure 66: Middle East & Africa NA Managed Mobility Service Market Volume Share (%), by Country 2025 & 2033
- Figure 67: Asia Pacific NA Managed Mobility Service Market Revenue (billion), by Type 2025 & 2033
- Figure 68: Asia Pacific NA Managed Mobility Service Market Volume (K Unit), by Type 2025 & 2033
- Figure 69: Asia Pacific NA Managed Mobility Service Market Revenue Share (%), by Type 2025 & 2033
- Figure 70: Asia Pacific NA Managed Mobility Service Market Volume Share (%), by Type 2025 & 2033
- Figure 71: Asia Pacific NA Managed Mobility Service Market Revenue (billion), by Deployment 2025 & 2033
- Figure 72: Asia Pacific NA Managed Mobility Service Market Volume (K Unit), by Deployment 2025 & 2033
- Figure 73: Asia Pacific NA Managed Mobility Service Market Revenue Share (%), by Deployment 2025 & 2033
- Figure 74: Asia Pacific NA Managed Mobility Service Market Volume Share (%), by Deployment 2025 & 2033
- Figure 75: Asia Pacific NA Managed Mobility Service Market Revenue (billion), by End-user Industry 2025 & 2033
- Figure 76: Asia Pacific NA Managed Mobility Service Market Volume (K Unit), by End-user Industry 2025 & 2033
- Figure 77: Asia Pacific NA Managed Mobility Service Market Revenue Share (%), by End-user Industry 2025 & 2033
- Figure 78: Asia Pacific NA Managed Mobility Service Market Volume Share (%), by End-user Industry 2025 & 2033
- Figure 79: Asia Pacific NA Managed Mobility Service Market Revenue (billion), by Country 2025 & 2033
- Figure 80: Asia Pacific NA Managed Mobility Service Market Volume (K Unit), by Country 2025 & 2033
- Figure 81: Asia Pacific NA Managed Mobility Service Market Revenue Share (%), by Country 2025 & 2033
- Figure 82: Asia Pacific NA Managed Mobility Service Market Volume Share (%), by Country 2025 & 2033
List of Tables
- Table 1: Global NA Managed Mobility Service Market Revenue billion Forecast, by Type 2020 & 2033
- Table 2: Global NA Managed Mobility Service Market Volume K Unit Forecast, by Type 2020 & 2033
- Table 3: Global NA Managed Mobility Service Market Revenue billion Forecast, by Deployment 2020 & 2033
- Table 4: Global NA Managed Mobility Service Market Volume K Unit Forecast, by Deployment 2020 & 2033
- Table 5: Global NA Managed Mobility Service Market Revenue billion Forecast, by End-user Industry 2020 & 2033
- Table 6: Global NA Managed Mobility Service Market Volume K Unit Forecast, by End-user Industry 2020 & 2033
- Table 7: Global NA Managed Mobility Service Market Revenue billion Forecast, by Region 2020 & 2033
- Table 8: Global NA Managed Mobility Service Market Volume K Unit Forecast, by Region 2020 & 2033
- Table 9: Global NA Managed Mobility Service Market Revenue billion Forecast, by Type 2020 & 2033
- Table 10: Global NA Managed Mobility Service Market Volume K Unit Forecast, by Type 2020 & 2033
- Table 11: Global NA Managed Mobility Service Market Revenue billion Forecast, by Deployment 2020 & 2033
- Table 12: Global NA Managed Mobility Service Market Volume K Unit Forecast, by Deployment 2020 & 2033
- Table 13: Global NA Managed Mobility Service Market Revenue billion Forecast, by End-user Industry 2020 & 2033
- Table 14: Global NA Managed Mobility Service Market Volume K Unit Forecast, by End-user Industry 2020 & 2033
- Table 15: Global NA Managed Mobility Service Market Revenue billion Forecast, by Country 2020 & 2033
- Table 16: Global NA Managed Mobility Service Market Volume K Unit Forecast, by Country 2020 & 2033
- Table 17: United States NA Managed Mobility Service Market Revenue (billion) Forecast, by Application 2020 & 2033
- Table 18: United States NA Managed Mobility Service Market Volume (K Unit) Forecast, by Application 2020 & 2033
- Table 19: Canada NA Managed Mobility Service Market Revenue (billion) Forecast, by Application 2020 & 2033
- Table 20: Canada NA Managed Mobility Service Market Volume (K Unit) Forecast, by Application 2020 & 2033
- Table 21: Mexico NA Managed Mobility Service Market Revenue (billion) Forecast, by Application 2020 & 2033
- Table 22: Mexico NA Managed Mobility Service Market Volume (K Unit) Forecast, by Application 2020 & 2033
- Table 23: Global NA Managed Mobility Service Market Revenue billion Forecast, by Type 2020 & 2033
- Table 24: Global NA Managed Mobility Service Market Volume K Unit Forecast, by Type 2020 & 2033
- Table 25: Global NA Managed Mobility Service Market Revenue billion Forecast, by Deployment 2020 & 2033
- Table 26: Global NA Managed Mobility Service Market Volume K Unit Forecast, by Deployment 2020 & 2033
- Table 27: Global NA Managed Mobility Service Market Revenue billion Forecast, by End-user Industry 2020 & 2033
- Table 28: Global NA Managed Mobility Service Market Volume K Unit Forecast, by End-user Industry 2020 & 2033
- Table 29: Global NA Managed Mobility Service Market Revenue billion Forecast, by Country 2020 & 2033
- Table 30: Global NA Managed Mobility Service Market Volume K Unit Forecast, by Country 2020 & 2033
- Table 31: Brazil NA Managed Mobility Service Market Revenue (billion) Forecast, by Application 2020 & 2033
- Table 32: Brazil NA Managed Mobility Service Market Volume (K Unit) Forecast, by Application 2020 & 2033
- Table 33: Argentina NA Managed Mobility Service Market Revenue (billion) Forecast, by Application 2020 & 2033
- Table 34: Argentina NA Managed Mobility Service Market Volume (K Unit) Forecast, by Application 2020 & 2033
- Table 35: Rest of South America NA Managed Mobility Service Market Revenue (billion) Forecast, by Application 2020 & 2033
- Table 36: Rest of South America NA Managed Mobility Service Market Volume (K Unit) Forecast, by Application 2020 & 2033
- Table 37: Global NA Managed Mobility Service Market Revenue billion Forecast, by Type 2020 & 2033
- Table 38: Global NA Managed Mobility Service Market Volume K Unit Forecast, by Type 2020 & 2033
- Table 39: Global NA Managed Mobility Service Market Revenue billion Forecast, by Deployment 2020 & 2033
- Table 40: Global NA Managed Mobility Service Market Volume K Unit Forecast, by Deployment 2020 & 2033
- Table 41: Global NA Managed Mobility Service Market Revenue billion Forecast, by End-user Industry 2020 & 2033
- Table 42: Global NA Managed Mobility Service Market Volume K Unit Forecast, by End-user Industry 2020 & 2033
- Table 43: Global NA Managed Mobility Service Market Revenue billion Forecast, by Country 2020 & 2033
- Table 44: Global NA Managed Mobility Service Market Volume K Unit Forecast, by Country 2020 & 2033
- Table 45: United Kingdom NA Managed Mobility Service Market Revenue (billion) Forecast, by Application 2020 & 2033
- Table 46: United Kingdom NA Managed Mobility Service Market Volume (K Unit) Forecast, by Application 2020 & 2033
- Table 47: Germany NA Managed Mobility Service Market Revenue (billion) Forecast, by Application 2020 & 2033
- Table 48: Germany NA Managed Mobility Service Market Volume (K Unit) Forecast, by Application 2020 & 2033
- Table 49: France NA Managed Mobility Service Market Revenue (billion) Forecast, by Application 2020 & 2033
- Table 50: France NA Managed Mobility Service Market Volume (K Unit) Forecast, by Application 2020 & 2033
- Table 51: Italy NA Managed Mobility Service Market Revenue (billion) Forecast, by Application 2020 & 2033
- Table 52: Italy NA Managed Mobility Service Market Volume (K Unit) Forecast, by Application 2020 & 2033
- Table 53: Spain NA Managed Mobility Service Market Revenue (billion) Forecast, by Application 2020 & 2033
- Table 54: Spain NA Managed Mobility Service Market Volume (K Unit) Forecast, by Application 2020 & 2033
- Table 55: Russia NA Managed Mobility Service Market Revenue (billion) Forecast, by Application 2020 & 2033
- Table 56: Russia NA Managed Mobility Service Market Volume (K Unit) Forecast, by Application 2020 & 2033
- Table 57: Benelux NA Managed Mobility Service Market Revenue (billion) Forecast, by Application 2020 & 2033
- Table 58: Benelux NA Managed Mobility Service Market Volume (K Unit) Forecast, by Application 2020 & 2033
- Table 59: Nordics NA Managed Mobility Service Market Revenue (billion) Forecast, by Application 2020 & 2033
- Table 60: Nordics NA Managed Mobility Service Market Volume (K Unit) Forecast, by Application 2020 & 2033
- Table 61: Rest of Europe NA Managed Mobility Service Market Revenue (billion) Forecast, by Application 2020 & 2033
- Table 62: Rest of Europe NA Managed Mobility Service Market Volume (K Unit) Forecast, by Application 2020 & 2033
- Table 63: Global NA Managed Mobility Service Market Revenue billion Forecast, by Type 2020 & 2033
- Table 64: Global NA Managed Mobility Service Market Volume K Unit Forecast, by Type 2020 & 2033
- Table 65: Global NA Managed Mobility Service Market Revenue billion Forecast, by Deployment 2020 & 2033
- Table 66: Global NA Managed Mobility Service Market Volume K Unit Forecast, by Deployment 2020 & 2033
- Table 67: Global NA Managed Mobility Service Market Revenue billion Forecast, by End-user Industry 2020 & 2033
- Table 68: Global NA Managed Mobility Service Market Volume K Unit Forecast, by End-user Industry 2020 & 2033
- Table 69: Global NA Managed Mobility Service Market Revenue billion Forecast, by Country 2020 & 2033
- Table 70: Global NA Managed Mobility Service Market Volume K Unit Forecast, by Country 2020 & 2033
- Table 71: Turkey NA Managed Mobility Service Market Revenue (billion) Forecast, by Application 2020 & 2033
- Table 72: Turkey NA Managed Mobility Service Market Volume (K Unit) Forecast, by Application 2020 & 2033
- Table 73: Israel NA Managed Mobility Service Market Revenue (billion) Forecast, by Application 2020 & 2033
- Table 74: Israel NA Managed Mobility Service Market Volume (K Unit) Forecast, by Application 2020 & 2033
- Table 75: GCC NA Managed Mobility Service Market Revenue (billion) Forecast, by Application 2020 & 2033
- Table 76: GCC NA Managed Mobility Service Market Volume (K Unit) Forecast, by Application 2020 & 2033
- Table 77: North Africa NA Managed Mobility Service Market Revenue (billion) Forecast, by Application 2020 & 2033
- Table 78: North Africa NA Managed Mobility Service Market Volume (K Unit) Forecast, by Application 2020 & 2033
- Table 79: South Africa NA Managed Mobility Service Market Revenue (billion) Forecast, by Application 2020 & 2033
- Table 80: South Africa NA Managed Mobility Service Market Volume (K Unit) Forecast, by Application 2020 & 2033
- Table 81: Rest of Middle East & Africa NA Managed Mobility Service Market Revenue (billion) Forecast, by Application 2020 & 2033
- Table 82: Rest of Middle East & Africa NA Managed Mobility Service Market Volume (K Unit) Forecast, by Application 2020 & 2033
- Table 83: Global NA Managed Mobility Service Market Revenue billion Forecast, by Type 2020 & 2033
- Table 84: Global NA Managed Mobility Service Market Volume K Unit Forecast, by Type 2020 & 2033
- Table 85: Global NA Managed Mobility Service Market Revenue billion Forecast, by Deployment 2020 & 2033
- Table 86: Global NA Managed Mobility Service Market Volume K Unit Forecast, by Deployment 2020 & 2033
- Table 87: Global NA Managed Mobility Service Market Revenue billion Forecast, by End-user Industry 2020 & 2033
- Table 88: Global NA Managed Mobility Service Market Volume K Unit Forecast, by End-user Industry 2020 & 2033
- Table 89: Global NA Managed Mobility Service Market Revenue billion Forecast, by Country 2020 & 2033
- Table 90: Global NA Managed Mobility Service Market Volume K Unit Forecast, by Country 2020 & 2033
- Table 91: China NA Managed Mobility Service Market Revenue (billion) Forecast, by Application 2020 & 2033
- Table 92: China NA Managed Mobility Service Market Volume (K Unit) Forecast, by Application 2020 & 2033
- Table 93: India NA Managed Mobility Service Market Revenue (billion) Forecast, by Application 2020 & 2033
- Table 94: India NA Managed Mobility Service Market Volume (K Unit) Forecast, by Application 2020 & 2033
- Table 95: Japan NA Managed Mobility Service Market Revenue (billion) Forecast, by Application 2020 & 2033
- Table 96: Japan NA Managed Mobility Service Market Volume (K Unit) Forecast, by Application 2020 & 2033
- Table 97: South Korea NA Managed Mobility Service Market Revenue (billion) Forecast, by Application 2020 & 2033
- Table 98: South Korea NA Managed Mobility Service Market Volume (K Unit) Forecast, by Application 2020 & 2033
- Table 99: ASEAN NA Managed Mobility Service Market Revenue (billion) Forecast, by Application 2020 & 2033
- Table 100: ASEAN NA Managed Mobility Service Market Volume (K Unit) Forecast, by Application 2020 & 2033
- Table 101: Oceania NA Managed Mobility Service Market Revenue (billion) Forecast, by Application 2020 & 2033
- Table 102: Oceania NA Managed Mobility Service Market Volume (K Unit) Forecast, by Application 2020 & 2033
- Table 103: Rest of Asia Pacific NA Managed Mobility Service Market Revenue (billion) Forecast, by Application 2020 & 2033
- Table 104: Rest of Asia Pacific NA Managed Mobility Service Market Volume (K Unit) Forecast, by Application 2020 & 2033
Frequently Asked Questions
1. What is the projected Compound Annual Growth Rate (CAGR) of the NA Managed Mobility Service Market?
The projected CAGR is approximately 25.77%.
2. Which companies are prominent players in the NA Managed Mobility Service Market?
Key companies in the market include DELL Technologies, Accenture PLC, Citrix System Inc, Orange SA, IBM Corporation, Wipro Ltd, Fujitsu Ltd, Hewlett Packard Enterprise Company, Tech Mahindra Limited, AT&T Inc, Telefonica SA.
3. What are the main segments of the NA Managed Mobility Service Market?
The market segments include Type, Deployment, End-user Industry.
4. Can you provide details about the market size?
The market size is estimated to be USD 39.62 billion as of 2022.
5. What are some drivers contributing to market growth?
; Increasing Acceptability for BYOD in Organizations; Companies Outsourcing IT Activities.
6. What are the notable trends driving market growth?
Mobile Application Management to Hold Major Share.
7. Are there any restraints impacting market growth?
; Lack of Control over Operations and Cost Visibility.
8. Can you provide examples of recent developments in the market?
N/A
9. What pricing options are available for accessing the report?
Pricing options include single-user, multi-user, and enterprise licenses priced at USD 4750, USD 4950, and USD 6800 respectively.
10. Is the market size provided in terms of value or volume?
The market size is provided in terms of value, measured in billion and volume, measured in K Unit.
11. Are there any specific market keywords associated with the report?
Yes, the market keyword associated with the report is "NA Managed Mobility Service Market," which aids in identifying and referencing the specific market segment covered.
12. How do I determine which pricing option suits my needs best?
The pricing options vary based on user requirements and access needs. Individual users may opt for single-user licenses, while businesses requiring broader access may choose multi-user or enterprise licenses for cost-effective access to the report.
13. Are there any additional resources or data provided in the NA Managed Mobility Service Market report?
While the report offers comprehensive insights, it's advisable to review the specific contents or supplementary materials provided to ascertain if additional resources or data are available.
14. How can I stay updated on further developments or reports in the NA Managed Mobility Service Market?
To stay informed about further developments, trends, and reports in the NA Managed Mobility Service Market, consider subscribing to industry newsletters, following relevant companies and organizations, or regularly checking reputable industry news sources and publications.
Methodology
Step 1 - Identification of Relevant Samples Size from Population Database


Step 2 - Approaches for Defining Global Market Size (Value, Volume* & Price*)

Note*: In applicable scenarios
Step 3 - Data Sources
Primary Research
- Web Analytics
- Survey Reports
- Research Institute
- Latest Research Reports
- Opinion Leaders
Secondary Research
- Annual Reports
- White Paper
- Latest Press Release
- Industry Association
- Paid Database
- Investor Presentations

Step 4 - Data Triangulation
Involves using different sources of information in order to increase the validity of a study
These sources are likely to be stakeholders in a program - participants, other researchers, program staff, other community members, and so on.
Then we put all data in single framework & apply various statistical tools to find out the dynamic on the market.
During the analysis stage, feedback from the stakeholder groups would be compared to determine areas of agreement as well as areas of divergence