

Key Insights
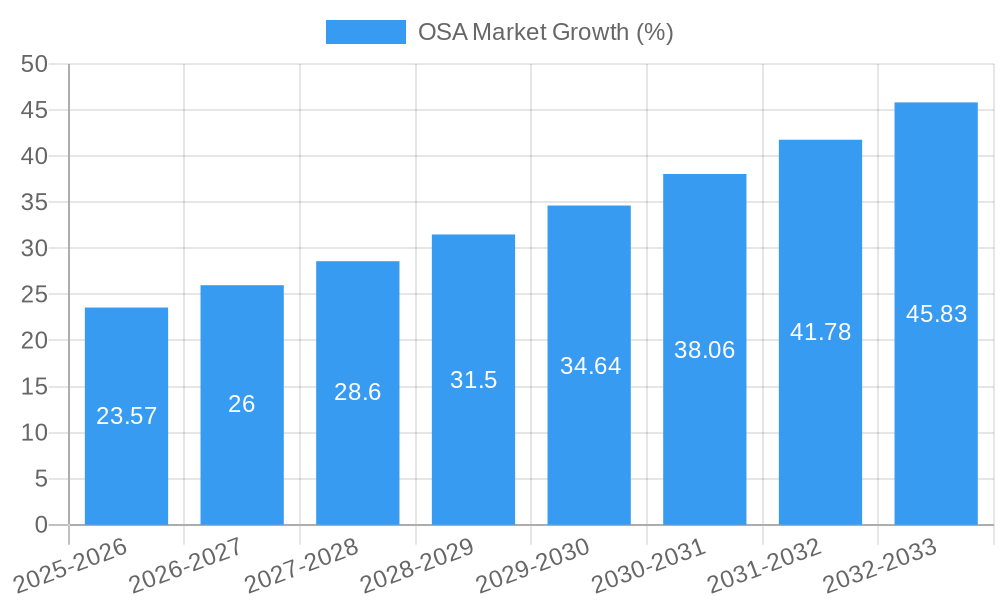
The Optical Spectrum Analyzer (OSA) market is experiencing robust growth, projected to reach \$314.65 million in 2025 and maintain a Compound Annual Growth Rate (CAGR) of 7.39% from 2025 to 2033. This expansion is driven primarily by increasing demand from the telecommunications sector, fueled by the ongoing rollout of 5G networks and the expanding fiber optic infrastructure. The healthcare industry also contributes significantly, with OSAs playing a crucial role in advanced medical diagnostics and research. Furthermore, the burgeoning consumer electronics market, particularly in areas like optical sensing and high-speed data transmission, is further bolstering market growth. The market is segmented by end-user industry (Telecommunication, Healthcare, Consumer Electronics, and Other) and by type (Portable, Handheld, and Benchtop), with portable and handheld OSAs gaining popularity due to their flexibility and ease of use in various field applications. Key players like II-VI Incorporated, Yokogawa Test & Measurement Corporation, and Anritsu Corporation are driving innovation and competition within the market, constantly improving OSA performance, accuracy, and functionality.
The growth trajectory of the OSA market is influenced by several factors. Technological advancements leading to more compact, cost-effective, and higher-performance OSAs are key contributors. The increasing adoption of cloud-based data analytics and remote monitoring solutions also creates opportunities for OSA manufacturers. However, challenges such as stringent regulatory requirements and the high initial investment costs associated with advanced OSA technologies could potentially restrain market growth in certain segments. Despite these restraints, the long-term outlook remains positive, driven by continued investment in advanced optical communication networks and increasing applications across various industries. The Asia-Pacific region is expected to witness significant growth, fueled by rapid infrastructure development and expanding telecommunications networks in developing economies.

OSA Market: A Comprehensive Market Report (2019-2033)
This dynamic report provides a comprehensive analysis of the Optical Spectrum Analyzer (OSA) market, offering invaluable insights for stakeholders across the industry. From market sizing and segmentation to competitive landscapes and future projections, this report covers all key aspects, leveraging extensive data and expert analysis. The study period spans 2019-2033, with a base year of 2025 and a forecast period of 2025-2033. The market is projected to reach xx Million by 2033, exhibiting a CAGR of xx%.
OSA Market Structure & Competitive Landscape
The OSA market exhibits a moderately concentrated structure, with a few key players holding significant market share. The Herfindahl-Hirschman Index (HHI) is estimated at xx, indicating a moderately competitive landscape. However, the market is characterized by ongoing innovation, particularly in areas such as higher spectral resolution, faster measurement speeds, and enhanced portability. Regulatory changes, especially concerning spectrum allocation and environmental standards, impact market dynamics. Product substitutes, primarily alternative testing methods, pose a moderate threat. The market is segmented by end-user industry (Telecommunication, Healthcare, Consumer Electronics, Other) and by type (Portable, Handheld, Benchtop). Recent years have witnessed a moderate level of mergers and acquisitions (M&A), with an estimated xx Million in M&A activity during 2019-2024. This activity is driven by the desire for companies to expand their product portfolios and enhance their technological capabilities.
- Market Concentration: Moderately concentrated, with HHI estimated at xx.
- Innovation Drivers: Higher spectral resolution, faster measurement speeds, enhanced portability.
- Regulatory Impacts: Spectrum allocation, environmental standards significantly affect market growth.
- Product Substitutes: Alternative testing methods pose a moderate threat.
- End-User Segmentation: Telecommunication, Healthcare, Consumer Electronics, and Others.
- M&A Trends: Moderate activity, with an estimated xx Million in M&A deals between 2019-2024.
OSA Market Trends & Opportunities
The OSA market is experiencing substantial growth, driven by several factors. The increasing demand for high-speed data communication networks is a primary catalyst, fueling the need for precise optical testing equipment. Technological advancements, such as the development of more compact and portable OSAs, are further expanding market opportunities. Consumer preferences are shifting towards higher-performance and more user-friendly devices. The competitive landscape is dynamic, with existing players constantly innovating and new entrants emerging, leading to ongoing product differentiation and price competition. The market exhibits a notable growth trajectory, with significant expansion expected across all segments, particularly in the telecommunications and consumer electronics sectors. The rising adoption of 5G and other advanced technologies is driving increased demand for high-precision OSAs. This is further amplified by the need for improved network monitoring and maintenance. The market is expected to reach xx Million by 2033, showcasing a robust CAGR of xx% during the forecast period.
Dominant Markets & Segments in OSA Market
The telecommunications sector represents the dominant end-user industry for OSAs, accounting for approximately xx% of the market share. This is attributable to the robust growth in optical fiber networks and the increasing complexity of optical communication systems. The handheld segment is the fastest-growing type, driven by the need for portable and field-deployable solutions.
- Dominant End-User Industry: Telecommunications (xx% market share).
- Fastest-Growing Segment (By Type): Handheld.
Key Growth Drivers:
- Telecommunications: Expanding optical fiber networks, increased demand for 5G and advanced communication technologies.
- Healthcare: Growing need for precision optical testing in medical devices.
- Consumer Electronics: Increasing adoption of high-speed optical data transmission in various consumer electronics.
OSA Market Product Analysis
The OSA market offers a range of products, from basic benchtop models to highly portable and sophisticated handheld devices. Key innovations include increased wavelength ranges, improved measurement accuracy, and enhanced software capabilities for data analysis. These advancements cater to diverse applications across various industries, providing significant competitive advantages in terms of efficiency and performance. The market is characterized by a diverse array of offerings, each tailored to specific user needs and application requirements.
Key Drivers, Barriers & Challenges in OSA Market
Key Drivers:
- Technological advancements in optical communication and increased demand for higher bandwidths.
- Growth in the telecommunications and data center industries.
- Government initiatives and policies promoting the expansion of fiber optic networks.
Challenges and Restraints:
- High initial investment costs for advanced OSA systems.
- Stringent regulatory requirements and compliance standards.
- Intense competition from established and emerging players impacting pricing.
Growth Drivers in the OSA Market
The growth of the OSA market is primarily fueled by technological advancements in optical communication networks, the rising demand for higher bandwidths, and increased deployment of fiber optic infrastructure globally. Government regulations and initiatives promoting fiber optic network expansion also significantly contribute to market growth.
Challenges Impacting OSA Market Growth
Significant challenges include the high initial investment required for advanced OSA systems, along with stringent regulatory compliance standards and intense competition affecting pricing strategies. Supply chain disruptions can also impact market availability and pricing.
Key Players Shaping the OSA Market
- II-VI Incorporated
- Yokogawa Test & Measurement Corporation
- Anritsu Corporation
- VIAVI Solutions Inc
- Luna Innovations
- Quantifi Photonics Limited
- ID Photonics GmbH
- Exfo Inc
- Aragon Photonics Brillouin
- Thorlabs Inc
- Apex Technologies
Significant OSA Market Industry Milestones
- August 2022: Yokogawa launched two new optical spectrum analyzers (OSAs), AQ6375E and AQ6376E, to meet the demand for wide-wavelength measurement capabilities.
- January 2022: SAF Tehnika expanded its Spectrum Compact family of ultra-portable handheld microwave spectrum analyzers, enhancing performance and affordability.
- June 2021: VIAVI Solutions Inc. introduced the MOSA module, adding optical spectrum analysis to its MAP optical manufacturing test system.
- May 2021: EXFO introduced the 5GPro optimum spectrum analyzer (OSA), a modular, field-focused RF testing solution for 4G/LTE and 5G NR environments.
Future Outlook for OSA Market
The OSA market is poised for continued growth, driven by the ongoing expansion of 5G and other high-speed communication networks, along with the increasing demand for precise optical testing in various sectors. Strategic partnerships, technological innovations, and expansion into emerging markets will play a crucial role in shaping the future of this market. The market is expected to witness substantial growth opportunities with the increasing focus on automation and the rising need for precise optical measurements in several industries.
OSA Market Segmentation
-
1. Type
- 1.1. Portable
- 1.2. Handheld
- 1.3. Benchtop
-
2. End-user Industry
- 2.1. Telecommunication
- 2.2. Healthcare
- 2.3. Consumer Electronics
- 2.4. Other End-user Industry
OSA Market Segmentation By Geography
- 1. North America
- 2. Europe
- 3. Asia Pacific
- 4. Latin America
- 5. Middle East and Africa

OSA Market REPORT HIGHLIGHTS
| Aspects | Details |
|---|---|
| Study Period | 2019-2033 |
| Base Year | 2024 |
| Estimated Year | 2025 |
| Forecast Period | 2025-2033 |
| Historical Period | 2019-2024 |
| Growth Rate | CAGR of 7.39% from 2019-2033 |
| Segmentation |
|
Table of Contents
- 1. Introduction
- 1.1. Research Scope
- 1.2. Market Segmentation
- 1.3. Research Methodology
- 1.4. Definitions and Assumptions
- 2. Executive Summary
- 2.1. Introduction
- 3. Market Dynamics
- 3.1. Introduction
- 3.2. Market Drivers
- 3.2.1. Growth of 5G (Millimeter Wave) Technology
- 3.3. Market Restrains
- 3.3.1. Replacement of Optical Spectrum Analyzer Products with Advanced Products
- 3.4. Market Trends
- 3.4.1. Telecommunications is Expected to Hold the Largest Share
- 4. Market Factor Analysis
- 4.1. Porters Five Forces
- 4.2. Supply/Value Chain
- 4.3. PESTEL analysis
- 4.4. Market Entropy
- 4.5. Patent/Trademark Analysis
- 5. Global OSA Market Analysis, Insights and Forecast, 2019-2031
- 5.1. Market Analysis, Insights and Forecast - by Type
- 5.1.1. Portable
- 5.1.2. Handheld
- 5.1.3. Benchtop
- 5.2. Market Analysis, Insights and Forecast - by End-user Industry
- 5.2.1. Telecommunication
- 5.2.2. Healthcare
- 5.2.3. Consumer Electronics
- 5.2.4. Other End-user Industry
- 5.3. Market Analysis, Insights and Forecast - by Region
- 5.3.1. North America
- 5.3.2. Europe
- 5.3.3. Asia Pacific
- 5.3.4. Latin America
- 5.3.5. Middle East and Africa
- 5.1. Market Analysis, Insights and Forecast - by Type
- 6. North America OSA Market Analysis, Insights and Forecast, 2019-2031
- 6.1. Market Analysis, Insights and Forecast - by Type
- 6.1.1. Portable
- 6.1.2. Handheld
- 6.1.3. Benchtop
- 6.2. Market Analysis, Insights and Forecast - by End-user Industry
- 6.2.1. Telecommunication
- 6.2.2. Healthcare
- 6.2.3. Consumer Electronics
- 6.2.4. Other End-user Industry
- 6.1. Market Analysis, Insights and Forecast - by Type
- 7. Europe OSA Market Analysis, Insights and Forecast, 2019-2031
- 7.1. Market Analysis, Insights and Forecast - by Type
- 7.1.1. Portable
- 7.1.2. Handheld
- 7.1.3. Benchtop
- 7.2. Market Analysis, Insights and Forecast - by End-user Industry
- 7.2.1. Telecommunication
- 7.2.2. Healthcare
- 7.2.3. Consumer Electronics
- 7.2.4. Other End-user Industry
- 7.1. Market Analysis, Insights and Forecast - by Type
- 8. Asia Pacific OSA Market Analysis, Insights and Forecast, 2019-2031
- 8.1. Market Analysis, Insights and Forecast - by Type
- 8.1.1. Portable
- 8.1.2. Handheld
- 8.1.3. Benchtop
- 8.2. Market Analysis, Insights and Forecast - by End-user Industry
- 8.2.1. Telecommunication
- 8.2.2. Healthcare
- 8.2.3. Consumer Electronics
- 8.2.4. Other End-user Industry
- 8.1. Market Analysis, Insights and Forecast - by Type
- 9. Latin America OSA Market Analysis, Insights and Forecast, 2019-2031
- 9.1. Market Analysis, Insights and Forecast - by Type
- 9.1.1. Portable
- 9.1.2. Handheld
- 9.1.3. Benchtop
- 9.2. Market Analysis, Insights and Forecast - by End-user Industry
- 9.2.1. Telecommunication
- 9.2.2. Healthcare
- 9.2.3. Consumer Electronics
- 9.2.4. Other End-user Industry
- 9.1. Market Analysis, Insights and Forecast - by Type
- 10. Middle East and Africa OSA Market Analysis, Insights and Forecast, 2019-2031
- 10.1. Market Analysis, Insights and Forecast - by Type
- 10.1.1. Portable
- 10.1.2. Handheld
- 10.1.3. Benchtop
- 10.2. Market Analysis, Insights and Forecast - by End-user Industry
- 10.2.1. Telecommunication
- 10.2.2. Healthcare
- 10.2.3. Consumer Electronics
- 10.2.4. Other End-user Industry
- 10.1. Market Analysis, Insights and Forecast - by Type
- 11. North America OSA Market Analysis, Insights and Forecast, 2019-2031
- 11.1. Market Analysis, Insights and Forecast - By Country/Sub-region
- 11.1.1.
- 12. Europe OSA Market Analysis, Insights and Forecast, 2019-2031
- 12.1. Market Analysis, Insights and Forecast - By Country/Sub-region
- 12.1.1.
- 13. Asia Pacific OSA Market Analysis, Insights and Forecast, 2019-2031
- 13.1. Market Analysis, Insights and Forecast - By Country/Sub-region
- 13.1.1.
- 14. Latin America OSA Market Analysis, Insights and Forecast, 2019-2031
- 14.1. Market Analysis, Insights and Forecast - By Country/Sub-region
- 14.1.1.
- 15. Middle East and Africa OSA Market Analysis, Insights and Forecast, 2019-2031
- 15.1. Market Analysis, Insights and Forecast - By Country/Sub-region
- 15.1.1.
- 16. Competitive Analysis
- 16.1. Global Market Share Analysis 2024
- 16.2. Company Profiles
- 16.2.1 II-VI Incorporated
- 16.2.1.1. Overview
- 16.2.1.2. Products
- 16.2.1.3. SWOT Analysis
- 16.2.1.4. Recent Developments
- 16.2.1.5. Financials (Based on Availability)
- 16.2.2 Yokogawa Test & Measurement Corporation
- 16.2.2.1. Overview
- 16.2.2.2. Products
- 16.2.2.3. SWOT Analysis
- 16.2.2.4. Recent Developments
- 16.2.2.5. Financials (Based on Availability)
- 16.2.3 Anritsu Corporation
- 16.2.3.1. Overview
- 16.2.3.2. Products
- 16.2.3.3. SWOT Analysis
- 16.2.3.4. Recent Developments
- 16.2.3.5. Financials (Based on Availability)
- 16.2.4 VIAVI Solutions Inc
- 16.2.4.1. Overview
- 16.2.4.2. Products
- 16.2.4.3. SWOT Analysis
- 16.2.4.4. Recent Developments
- 16.2.4.5. Financials (Based on Availability)
- 16.2.5 Luna Innovations
- 16.2.5.1. Overview
- 16.2.5.2. Products
- 16.2.5.3. SWOT Analysis
- 16.2.5.4. Recent Developments
- 16.2.5.5. Financials (Based on Availability)
- 16.2.6 Quantifi Photonics Limited
- 16.2.6.1. Overview
- 16.2.6.2. Products
- 16.2.6.3. SWOT Analysis
- 16.2.6.4. Recent Developments
- 16.2.6.5. Financials (Based on Availability)
- 16.2.7 ID Photonics GmbH*List Not Exhaustive
- 16.2.7.1. Overview
- 16.2.7.2. Products
- 16.2.7.3. SWOT Analysis
- 16.2.7.4. Recent Developments
- 16.2.7.5. Financials (Based on Availability)
- 16.2.8 Exfo Inc
- 16.2.8.1. Overview
- 16.2.8.2. Products
- 16.2.8.3. SWOT Analysis
- 16.2.8.4. Recent Developments
- 16.2.8.5. Financials (Based on Availability)
- 16.2.9 Aragon Photonics Brillouin
- 16.2.9.1. Overview
- 16.2.9.2. Products
- 16.2.9.3. SWOT Analysis
- 16.2.9.4. Recent Developments
- 16.2.9.5. Financials (Based on Availability)
- 16.2.10 Thorlabs Inc
- 16.2.10.1. Overview
- 16.2.10.2. Products
- 16.2.10.3. SWOT Analysis
- 16.2.10.4. Recent Developments
- 16.2.10.5. Financials (Based on Availability)
- 16.2.11 Apex Technologies
- 16.2.11.1. Overview
- 16.2.11.2. Products
- 16.2.11.3. SWOT Analysis
- 16.2.11.4. Recent Developments
- 16.2.11.5. Financials (Based on Availability)
- 16.2.1 II-VI Incorporated
List of Figures
- Figure 1: Global OSA Market Revenue Breakdown (Million, %) by Region 2024 & 2032
- Figure 2: North America OSA Market Revenue (Million), by Country 2024 & 2032
- Figure 3: North America OSA Market Revenue Share (%), by Country 2024 & 2032
- Figure 4: Europe OSA Market Revenue (Million), by Country 2024 & 2032
- Figure 5: Europe OSA Market Revenue Share (%), by Country 2024 & 2032
- Figure 6: Asia Pacific OSA Market Revenue (Million), by Country 2024 & 2032
- Figure 7: Asia Pacific OSA Market Revenue Share (%), by Country 2024 & 2032
- Figure 8: Latin America OSA Market Revenue (Million), by Country 2024 & 2032
- Figure 9: Latin America OSA Market Revenue Share (%), by Country 2024 & 2032
- Figure 10: Middle East and Africa OSA Market Revenue (Million), by Country 2024 & 2032
- Figure 11: Middle East and Africa OSA Market Revenue Share (%), by Country 2024 & 2032
- Figure 12: North America OSA Market Revenue (Million), by Type 2024 & 2032
- Figure 13: North America OSA Market Revenue Share (%), by Type 2024 & 2032
- Figure 14: North America OSA Market Revenue (Million), by End-user Industry 2024 & 2032
- Figure 15: North America OSA Market Revenue Share (%), by End-user Industry 2024 & 2032
- Figure 16: North America OSA Market Revenue (Million), by Country 2024 & 2032
- Figure 17: North America OSA Market Revenue Share (%), by Country 2024 & 2032
- Figure 18: Europe OSA Market Revenue (Million), by Type 2024 & 2032
- Figure 19: Europe OSA Market Revenue Share (%), by Type 2024 & 2032
- Figure 20: Europe OSA Market Revenue (Million), by End-user Industry 2024 & 2032
- Figure 21: Europe OSA Market Revenue Share (%), by End-user Industry 2024 & 2032
- Figure 22: Europe OSA Market Revenue (Million), by Country 2024 & 2032
- Figure 23: Europe OSA Market Revenue Share (%), by Country 2024 & 2032
- Figure 24: Asia Pacific OSA Market Revenue (Million), by Type 2024 & 2032
- Figure 25: Asia Pacific OSA Market Revenue Share (%), by Type 2024 & 2032
- Figure 26: Asia Pacific OSA Market Revenue (Million), by End-user Industry 2024 & 2032
- Figure 27: Asia Pacific OSA Market Revenue Share (%), by End-user Industry 2024 & 2032
- Figure 28: Asia Pacific OSA Market Revenue (Million), by Country 2024 & 2032
- Figure 29: Asia Pacific OSA Market Revenue Share (%), by Country 2024 & 2032
- Figure 30: Latin America OSA Market Revenue (Million), by Type 2024 & 2032
- Figure 31: Latin America OSA Market Revenue Share (%), by Type 2024 & 2032
- Figure 32: Latin America OSA Market Revenue (Million), by End-user Industry 2024 & 2032
- Figure 33: Latin America OSA Market Revenue Share (%), by End-user Industry 2024 & 2032
- Figure 34: Latin America OSA Market Revenue (Million), by Country 2024 & 2032
- Figure 35: Latin America OSA Market Revenue Share (%), by Country 2024 & 2032
- Figure 36: Middle East and Africa OSA Market Revenue (Million), by Type 2024 & 2032
- Figure 37: Middle East and Africa OSA Market Revenue Share (%), by Type 2024 & 2032
- Figure 38: Middle East and Africa OSA Market Revenue (Million), by End-user Industry 2024 & 2032
- Figure 39: Middle East and Africa OSA Market Revenue Share (%), by End-user Industry 2024 & 2032
- Figure 40: Middle East and Africa OSA Market Revenue (Million), by Country 2024 & 2032
- Figure 41: Middle East and Africa OSA Market Revenue Share (%), by Country 2024 & 2032
List of Tables
- Table 1: Global OSA Market Revenue Million Forecast, by Region 2019 & 2032
- Table 2: Global OSA Market Revenue Million Forecast, by Type 2019 & 2032
- Table 3: Global OSA Market Revenue Million Forecast, by End-user Industry 2019 & 2032
- Table 4: Global OSA Market Revenue Million Forecast, by Region 2019 & 2032
- Table 5: Global OSA Market Revenue Million Forecast, by Country 2019 & 2032
- Table 6: OSA Market Revenue (Million) Forecast, by Application 2019 & 2032
- Table 7: Global OSA Market Revenue Million Forecast, by Country 2019 & 2032
- Table 8: OSA Market Revenue (Million) Forecast, by Application 2019 & 2032
- Table 9: Global OSA Market Revenue Million Forecast, by Country 2019 & 2032
- Table 10: OSA Market Revenue (Million) Forecast, by Application 2019 & 2032
- Table 11: Global OSA Market Revenue Million Forecast, by Country 2019 & 2032
- Table 12: OSA Market Revenue (Million) Forecast, by Application 2019 & 2032
- Table 13: Global OSA Market Revenue Million Forecast, by Country 2019 & 2032
- Table 14: OSA Market Revenue (Million) Forecast, by Application 2019 & 2032
- Table 15: Global OSA Market Revenue Million Forecast, by Type 2019 & 2032
- Table 16: Global OSA Market Revenue Million Forecast, by End-user Industry 2019 & 2032
- Table 17: Global OSA Market Revenue Million Forecast, by Country 2019 & 2032
- Table 18: Global OSA Market Revenue Million Forecast, by Type 2019 & 2032
- Table 19: Global OSA Market Revenue Million Forecast, by End-user Industry 2019 & 2032
- Table 20: Global OSA Market Revenue Million Forecast, by Country 2019 & 2032
- Table 21: Global OSA Market Revenue Million Forecast, by Type 2019 & 2032
- Table 22: Global OSA Market Revenue Million Forecast, by End-user Industry 2019 & 2032
- Table 23: Global OSA Market Revenue Million Forecast, by Country 2019 & 2032
- Table 24: Global OSA Market Revenue Million Forecast, by Type 2019 & 2032
- Table 25: Global OSA Market Revenue Million Forecast, by End-user Industry 2019 & 2032
- Table 26: Global OSA Market Revenue Million Forecast, by Country 2019 & 2032
- Table 27: Global OSA Market Revenue Million Forecast, by Type 2019 & 2032
- Table 28: Global OSA Market Revenue Million Forecast, by End-user Industry 2019 & 2032
- Table 29: Global OSA Market Revenue Million Forecast, by Country 2019 & 2032
Frequently Asked Questions
1. What is the projected Compound Annual Growth Rate (CAGR) of the OSA Market?
The projected CAGR is approximately 7.39%.
2. Which companies are prominent players in the OSA Market?
Key companies in the market include II-VI Incorporated, Yokogawa Test & Measurement Corporation, Anritsu Corporation, VIAVI Solutions Inc, Luna Innovations, Quantifi Photonics Limited, ID Photonics GmbH*List Not Exhaustive, Exfo Inc, Aragon Photonics Brillouin, Thorlabs Inc, Apex Technologies.
3. What are the main segments of the OSA Market?
The market segments include Type, End-user Industry.
4. Can you provide details about the market size?
The market size is estimated to be USD 314.65 Million as of 2022.
5. What are some drivers contributing to market growth?
Growth of 5G (Millimeter Wave) Technology.
6. What are the notable trends driving market growth?
Telecommunications is Expected to Hold the Largest Share.
7. Are there any restraints impacting market growth?
Replacement of Optical Spectrum Analyzer Products with Advanced Products.
8. Can you provide examples of recent developments in the market?
August 2022 - Yokogawa announced to launch of two new optical spectrum analyzers (OSAs), AQ6375E and AQ6376E. The launch aimed to fulfill market demands for an instrument capable of measuring a wide range of wavelengths to meet new needs in optical product manufacturing and development.
9. What pricing options are available for accessing the report?
Pricing options include single-user, multi-user, and enterprise licenses priced at USD 4750, USD 5250, and USD 8750 respectively.
10. Is the market size provided in terms of value or volume?
The market size is provided in terms of value, measured in Million.
11. Are there any specific market keywords associated with the report?
Yes, the market keyword associated with the report is "OSA Market," which aids in identifying and referencing the specific market segment covered.
12. How do I determine which pricing option suits my needs best?
The pricing options vary based on user requirements and access needs. Individual users may opt for single-user licenses, while businesses requiring broader access may choose multi-user or enterprise licenses for cost-effective access to the report.
13. Are there any additional resources or data provided in the OSA Market report?
While the report offers comprehensive insights, it's advisable to review the specific contents or supplementary materials provided to ascertain if additional resources or data are available.
14. How can I stay updated on further developments or reports in the OSA Market?
To stay informed about further developments, trends, and reports in the OSA Market, consider subscribing to industry newsletters, following relevant companies and organizations, or regularly checking reputable industry news sources and publications.
Methodology
Step 1 - Identification of Relevant Samples Size from Population Database


Step 2 - Approaches for Defining Global Market Size (Value, Volume* & Price*)

Note*: In applicable scenarios
Step 3 - Data Sources
Primary Research
- Web Analytics
- Survey Reports
- Research Institute
- Latest Research Reports
- Opinion Leaders
Secondary Research
- Annual Reports
- White Paper
- Latest Press Release
- Industry Association
- Paid Database
- Investor Presentations

Step 4 - Data Triangulation
Involves using different sources of information in order to increase the validity of a study
These sources are likely to be stakeholders in a program - participants, other researchers, program staff, other community members, and so on.
Then we put all data in single framework & apply various statistical tools to find out the dynamic on the market.
During the analysis stage, feedback from the stakeholder groups would be compared to determine areas of agreement as well as areas of divergence
