

Key Insights
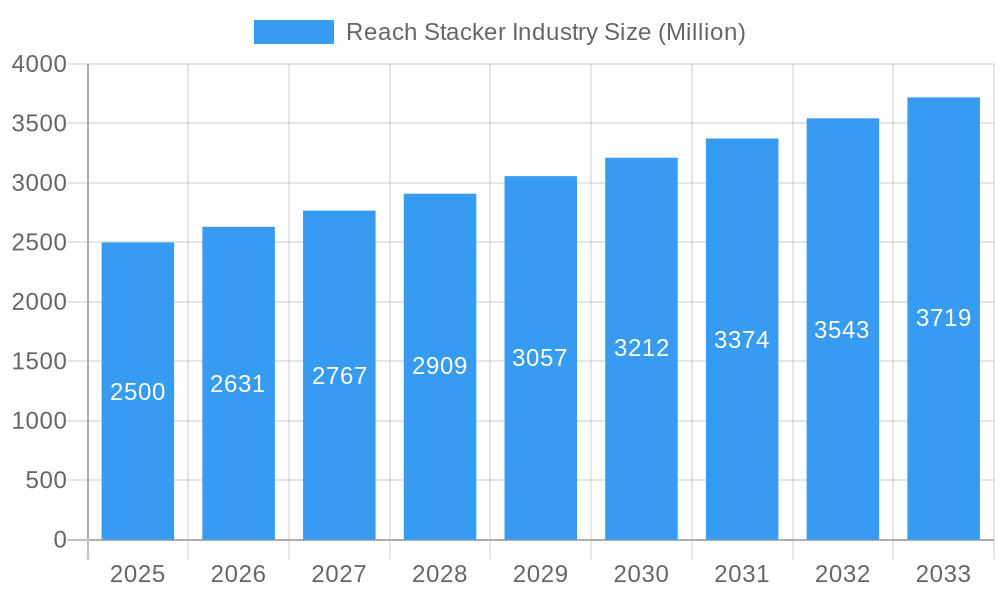
The global reach stacker market, valued at approximately $3.2 billion in 2025, is projected to experience robust growth with a compound annual growth rate (CAGR) of 6.9% from 2025 to 2033. This expansion is driven by burgeoning global trade, increased containerization, and the growing demand for efficient cargo handling equipment in seaports and logistics hubs. Technological advancements, including hybrid powertrains and automation, enhance operational efficiency and sustainability, further stimulating market growth. Investments in infrastructure development, particularly in emerging economies, present lucrative opportunities. The market is segmented by application (seaports, industrial), tonnage capacity (low, medium, high), and powertrain type (internal combustion engine, hybrid). Seaports currently dominate, supported by the expanding global shipping industry. However, the industrial segment is poised for substantial growth due to rising demand for efficient material handling in manufacturing and warehousing. The shift towards hybrid and electric powertrains reflects the growing emphasis on sustainability in the logistics sector. Intense competition among key players like Konecranes, Sany Group, Hyster, Liebherr Group, and Kalmar Group fosters innovation and price benefits for end-users. Potential restraints include fluctuating raw material prices and economic downturns.
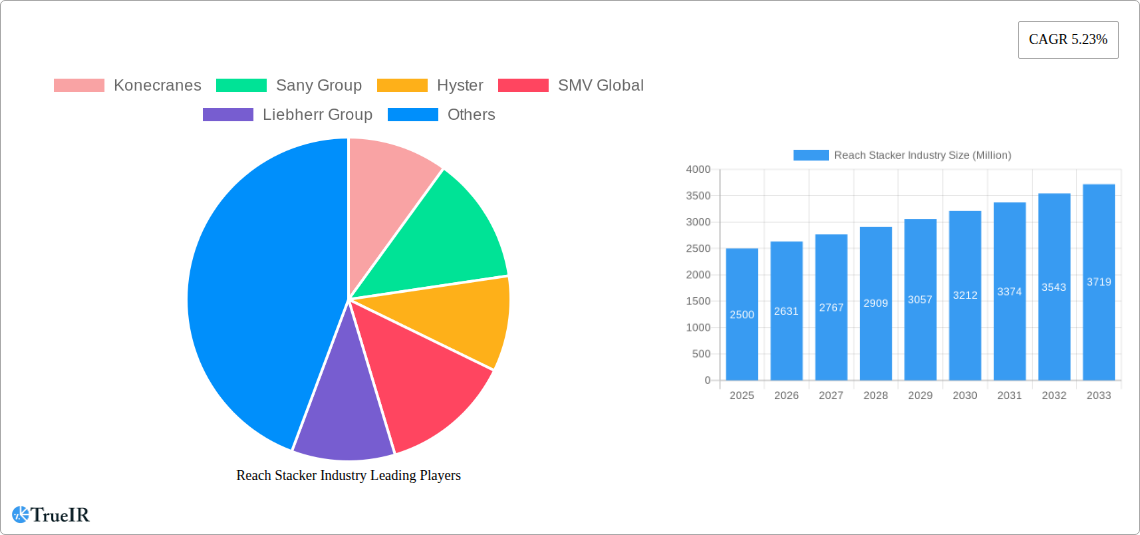
Reach Stacker Industry Market Size (In Billion)
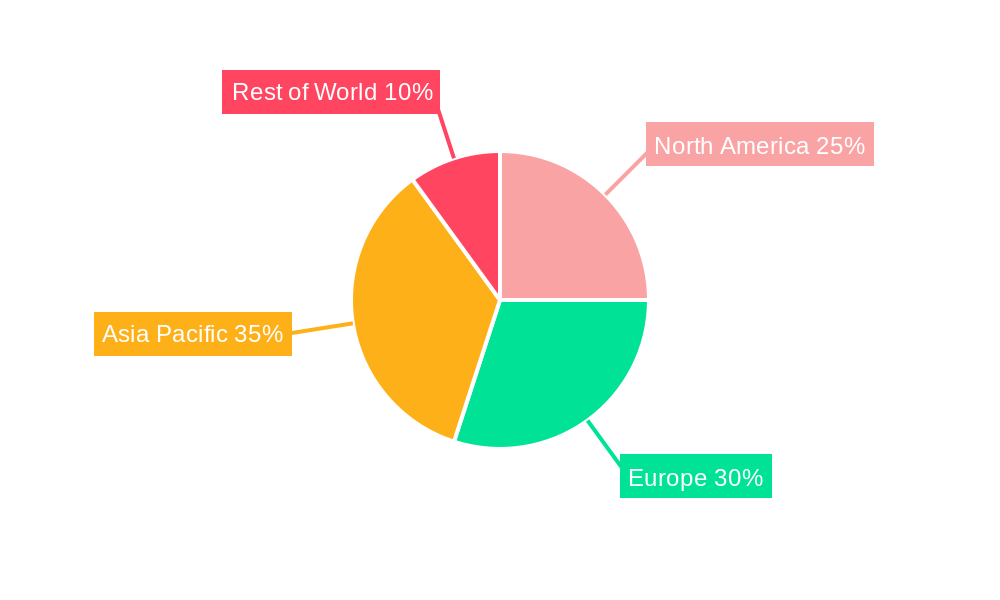
The competitive landscape features global and regional players focused on product enhancement through technological advancements, strategic partnerships, and mergers and acquisitions. Geographical analysis indicates strong growth in Asia-Pacific (driven by China and India's industrialization) and North America (fueled by port activity). Europe is also a significant market, with Germany and the UK as key contributors. Market penetration varies by region, influenced by infrastructure, economic growth, and regulations. The forecast period (2025-2033) anticipates continued market expansion, underpinned by global trade growth and the adoption of advanced reach stackers. The market's long-term outlook remains positive, driven by the fundamental need for efficient and sustainable material handling solutions in the global logistics network.
Reach Stacker Industry Company Market Share
Reach Stacker Industry Market Report: 2019-2033 Forecast
This comprehensive report provides a detailed analysis of the global Reach Stacker industry, projecting a market size exceeding $XX Million by 2033. Leveraging extensive research and data analysis from 2019-2024 (historical period), the report offers a meticulous forecast (2025-2033), with 2025 serving as the base and estimated year. This in-depth study is crucial for industry stakeholders, investors, and strategic decision-makers seeking to navigate the complexities of this dynamic market.
Reach Stacker Industry Market Structure & Competitive Landscape
The global reach stacker market exhibits a moderately concentrated structure, with a few major players holding significant market share. Key competitors include Konecranes, Sany Group, Hyster, SMV Global, Liebherr Group, Toyota, Kalmar Group, CVS Ferrari S P A, and Terex. The industry's competitive landscape is characterized by intense rivalry, driven by continuous product innovation, strategic partnerships, and mergers and acquisitions (M&A).
The concentration ratio (CR4) for the top four players is estimated at xx%, indicating a moderate level of market consolidation. M&A activity in the past five years has resulted in approximately xx deals, primarily focused on expanding geographic reach and technological capabilities. Regulatory changes impacting emissions and safety standards significantly influence the industry's trajectory. Product substitution is minimal, with specialized reach stackers offering unique features catering to niche applications. End-user segmentation, predominantly encompassing seaports and industrial sectors, shapes product development and marketing strategies.
- Market Concentration: Moderately concentrated, with CR4 at xx%.
- Innovation Drivers: Technological advancements in powertrains (hybrid and electric) and automation.
- Regulatory Impacts: Emission standards and safety regulations.
- Product Substitutes: Limited; specialized forklifts and other material handling equipment.
- End-User Segmentation: Seaports (xx%) and Industrial (xx%) sectors.
- M&A Trends: xx deals in the last five years, focused on expansion and technology integration.
Reach Stacker Industry Market Trends & Opportunities
The global reach stacker market is projected to witness robust growth, with a Compound Annual Growth Rate (CAGR) of xx% during the forecast period (2025-2033). This expansion is fueled by the growing demand for efficient and reliable material handling solutions in burgeoning seaports and industrial sectors worldwide. Market penetration rates are highest in developed economies, with significant growth potential in emerging markets, driven by infrastructure development and increased trade volumes. Technological advancements, particularly in hybrid and electric powertrains, are reshaping the market, offering environmentally friendly and cost-effective solutions. Consumer preferences are shifting towards automation and enhanced safety features, further driving innovation. The competitive landscape is dynamic, with companies investing heavily in R&D and strategic partnerships to gain a competitive edge.
Dominant Markets & Segments in Reach Stacker Industry
The seaport segment dominates the reach stacker market, accounting for approximately xx% of the total market value in 2025. This is primarily driven by the continuous expansion of global trade and the consequent need for efficient cargo handling in major ports worldwide. Within tonnage segments, the medium-tonnage range holds the largest share, reflecting the versatility and wide applicability of these machines. Geographically, Asia-Pacific is projected as the leading region, with countries like China and India exhibiting high growth potential due to ongoing port modernization and infrastructure development. The use of IC engine power trains currently commands the largest segment of the market.
- Leading Region: Asia-Pacific.
- Leading Application Segment: Sea Ports.
- Leading Tonnage Segment: Medium.
- Leading Power Train Type: IC Engine.
- Key Growth Drivers in Asia-Pacific:
- Massive infrastructure investments in port development.
- Rising demand for efficient cargo handling solutions.
- Government initiatives to modernize logistics infrastructure.
Reach Stacker Industry Product Analysis
Reach stackers are continually evolving, incorporating advanced features such as improved safety systems, enhanced maneuverability, and more efficient powertrains. The market sees a shift towards hybrid and electric models, driven by environmental concerns and potential cost savings. These advancements improve fuel efficiency and reduce emissions, aligning with global sustainability initiatives. Technological integration with advanced telematics and remote diagnostics provides enhanced operational efficiency and predictive maintenance capabilities. These innovations are strategically tailored to improve operational efficiency and enhance market competitiveness.
Key Drivers, Barriers & Challenges in Reach Stacker Industry
Key Drivers:
- Growing global trade volume necessitating efficient cargo handling.
- Infrastructure development in emerging economies, driving demand for reach stackers.
- Technological advancements leading to enhanced efficiency and productivity.
- Government regulations promoting sustainable and safe material handling practices.
Challenges:
- Fluctuations in raw material prices impacting manufacturing costs.
- Stringent emission regulations, increasing the cost of production for IC engine models.
- Intense competition among major players, leading to price pressures.
- Supply chain disruptions, particularly concerning crucial components and skilled labor. This has resulted in an estimated xx% increase in production costs in the past year.
Growth Drivers in the Reach Stacker Industry Market
Continued growth in global trade, infrastructure development projects particularly in emerging markets, technological innovations including hybrid and electric powertrains and autonomous systems, and supportive government policies focusing on port modernization and efficient logistics are key drivers of the Reach Stacker industry.
Challenges Impacting Reach Stacker Industry Growth
Significant challenges include volatile raw material prices affecting production costs, strict emission regulations increasing the manufacturing costs of traditional powertrains, intense competition among established players leading to price wars, and global supply chain disruptions. These issues hinder profitability and overall market expansion.
Key Players Shaping the Reach Stacker Industry Market
- Konecranes
- Sany Group
- Hyster
- SMV Global
- Liebherr Group
- Toyota
- Kalmar Group
- CVS Ferrari S P A
- Terex
Significant Reach Stacker Industry Milestones
- 2021: Konecranes launches a new range of hybrid reach stackers.
- 2022: Liebherr introduces an automated reach stacker model.
- 2023: Kalmar announces a partnership with a leading technology provider for autonomous reach stacker development.
- 2024: Sany Group expands its manufacturing capacity for reach stackers in Southeast Asia.
Note: Further detailed milestones are available in the full report.
Future Outlook for Reach Stacker Industry Market
The Reach Stacker industry is poised for continued growth, driven by factors such as expanding global trade, rising investments in port infrastructure, and the adoption of advanced technologies, particularly in automation and electric powertrains. This presents significant strategic opportunities for manufacturers, investors, and service providers. The market is expected to mature further, with a focus on enhanced sustainability and digitalization, offering a positive outlook for the coming decade.
Reach Stacker Industry Segmentation
-
1. Application
- 1.1. Sea Ports
- 1.2. Industrial
-
2. Tonnage
- 2.1. Low
- 2.2. Medium
- 2.3. High
-
3. Power Train Type
- 3.1. IC Engine
- 3.2. Hybrid
Reach Stacker Industry Segmentation By Geography
- 1. United States
- 2. Canada
- 3. Rest of North America
- 4. Germany
- 5. United Kingdom
- 6. France
- 7. Italy
- 8. Rest of Europe
- 9. China
- 10. India
- 11. Japan
- 12. South Korea
- 13. Rest of Asia Pacific
- 14. Mexico
- 15. Brazil
- 16. United Arab Emirates
- 17. Other Countries
Reach Stacker Industry Regional Market Share
Geographic Coverage of Reach Stacker Industry
Reach Stacker Industry REPORT HIGHLIGHTS
| Aspects | Details |
|---|---|
| Study Period | 2020-2034 |
| Base Year | 2025 |
| Estimated Year | 2026 |
| Forecast Period | 2026-2034 |
| Historical Period | 2020-2025 |
| Growth Rate | CAGR of 6.9% from 2020-2034 |
| Segmentation |
|
Table of Contents
- 1. Introduction
- 1.1. Research Scope
- 1.2. Market Segmentation
- 1.3. Research Objective
- 1.4. Definitions and Assumptions
- 2. Executive Summary
- 2.1. Market Snapshot
- 3. Market Dynamics
- 3.1. Market Drivers
- 3.2. Market Restrains
- 3.3. Market Trends
- 3.4. Market Opportunities
- 4. Market Factor Analysis
- 4.1. Porters Five Forces
- 4.1.1. Bargaining Power of Suppliers
- 4.1.2. Bargaining Power of Buyers
- 4.1.3. Threat of New Entrants
- 4.1.4. Threat of Substitutes
- 4.1.5. Competitive Rivalry
- 4.2. PESTEL analysis
- 4.3. BCG Analysis
- 4.3.1. Stars (High Growth, High Market Share)
- 4.3.2. Cash Cows (Low Growth, High Market Share)
- 4.3.3. Question Mark (High Growth, Low Market Share)
- 4.3.4. Dogs (Low Growth, Low Market Share)
- 4.4. Ansoff Matrix Analysis
- 4.5. Supply Chain Analysis
- 4.6. Regulatory Landscape
- 4.7. Current Market Potential and Opportunity Assessment (TAM–SAM–SOM Framework)
- 4.8. TIR Analyst Note
- 4.1. Porters Five Forces
- 5. Market Analysis, Insights and Forecast 2021-2033
- 5.1. Market Analysis, Insights and Forecast - by Application
- 5.1.1. Sea Ports
- 5.1.2. Industrial
- 5.2. Market Analysis, Insights and Forecast - by Tonnage
- 5.2.1. Low
- 5.2.2. Medium
- 5.2.3. High
- 5.3. Market Analysis, Insights and Forecast - by Power Train Type
- 5.3.1. IC Engine
- 5.3.2. Hybrid
- 5.4. Market Analysis, Insights and Forecast - by Region
- 5.4.1. United States
- 5.4.2. Canada
- 5.4.3. Rest of North America
- 5.4.4. Germany
- 5.4.5. United Kingdom
- 5.4.6. France
- 5.4.7. Italy
- 5.4.8. Rest of Europe
- 5.4.9. China
- 5.4.10. India
- 5.4.11. Japan
- 5.4.12. South Korea
- 5.4.13. Rest of Asia Pacific
- 5.4.14. Mexico
- 5.4.15. Brazil
- 5.4.16. United Arab Emirates
- 5.4.17. Other Countries
- 5.1. Market Analysis, Insights and Forecast - by Application
- 6. Global Reach Stacker Industry Analysis, Insights and Forecast, 2021-2033
- 6.1. Market Analysis, Insights and Forecast - by Application
- 6.1.1. Sea Ports
- 6.1.2. Industrial
- 6.2. Market Analysis, Insights and Forecast - by Tonnage
- 6.2.1. Low
- 6.2.2. Medium
- 6.2.3. High
- 6.3. Market Analysis, Insights and Forecast - by Power Train Type
- 6.3.1. IC Engine
- 6.3.2. Hybrid
- 6.1. Market Analysis, Insights and Forecast - by Application
- 7. United States Reach Stacker Industry Analysis, Insights and Forecast, 2020-2032
- 7.1. Market Analysis, Insights and Forecast - by Application
- 7.1.1. Sea Ports
- 7.1.2. Industrial
- 7.2. Market Analysis, Insights and Forecast - by Tonnage
- 7.2.1. Low
- 7.2.2. Medium
- 7.2.3. High
- 7.3. Market Analysis, Insights and Forecast - by Power Train Type
- 7.3.1. IC Engine
- 7.3.2. Hybrid
- 7.1. Market Analysis, Insights and Forecast - by Application
- 8. Canada Reach Stacker Industry Analysis, Insights and Forecast, 2020-2032
- 8.1. Market Analysis, Insights and Forecast - by Application
- 8.1.1. Sea Ports
- 8.1.2. Industrial
- 8.2. Market Analysis, Insights and Forecast - by Tonnage
- 8.2.1. Low
- 8.2.2. Medium
- 8.2.3. High
- 8.3. Market Analysis, Insights and Forecast - by Power Train Type
- 8.3.1. IC Engine
- 8.3.2. Hybrid
- 8.1. Market Analysis, Insights and Forecast - by Application
- 9. Rest of North America Reach Stacker Industry Analysis, Insights and Forecast, 2020-2032
- 9.1. Market Analysis, Insights and Forecast - by Application
- 9.1.1. Sea Ports
- 9.1.2. Industrial
- 9.2. Market Analysis, Insights and Forecast - by Tonnage
- 9.2.1. Low
- 9.2.2. Medium
- 9.2.3. High
- 9.3. Market Analysis, Insights and Forecast - by Power Train Type
- 9.3.1. IC Engine
- 9.3.2. Hybrid
- 9.1. Market Analysis, Insights and Forecast - by Application
- 10. Germany Reach Stacker Industry Analysis, Insights and Forecast, 2020-2032
- 10.1. Market Analysis, Insights and Forecast - by Application
- 10.1.1. Sea Ports
- 10.1.2. Industrial
- 10.2. Market Analysis, Insights and Forecast - by Tonnage
- 10.2.1. Low
- 10.2.2. Medium
- 10.2.3. High
- 10.3. Market Analysis, Insights and Forecast - by Power Train Type
- 10.3.1. IC Engine
- 10.3.2. Hybrid
- 10.1. Market Analysis, Insights and Forecast - by Application
- 11. United Kingdom Reach Stacker Industry Analysis, Insights and Forecast, 2020-2032
- 11.1. Market Analysis, Insights and Forecast - by Application
- 11.1.1. Sea Ports
- 11.1.2. Industrial
- 11.2. Market Analysis, Insights and Forecast - by Tonnage
- 11.2.1. Low
- 11.2.2. Medium
- 11.2.3. High
- 11.3. Market Analysis, Insights and Forecast - by Power Train Type
- 11.3.1. IC Engine
- 11.3.2. Hybrid
- 11.1. Market Analysis, Insights and Forecast - by Application
- 12. France Reach Stacker Industry Analysis, Insights and Forecast, 2020-2032
- 12.1. Market Analysis, Insights and Forecast - by Application
- 12.1.1. Sea Ports
- 12.1.2. Industrial
- 12.2. Market Analysis, Insights and Forecast - by Tonnage
- 12.2.1. Low
- 12.2.2. Medium
- 12.2.3. High
- 12.3. Market Analysis, Insights and Forecast - by Power Train Type
- 12.3.1. IC Engine
- 12.3.2. Hybrid
- 12.1. Market Analysis, Insights and Forecast - by Application
- 13. Italy Reach Stacker Industry Analysis, Insights and Forecast, 2020-2032
- 13.1. Market Analysis, Insights and Forecast - by Application
- 13.1.1. Sea Ports
- 13.1.2. Industrial
- 13.2. Market Analysis, Insights and Forecast - by Tonnage
- 13.2.1. Low
- 13.2.2. Medium
- 13.2.3. High
- 13.3. Market Analysis, Insights and Forecast - by Power Train Type
- 13.3.1. IC Engine
- 13.3.2. Hybrid
- 13.1. Market Analysis, Insights and Forecast - by Application
- 14. Rest of Europe Reach Stacker Industry Analysis, Insights and Forecast, 2020-2032
- 14.1. Market Analysis, Insights and Forecast - by Application
- 14.1.1. Sea Ports
- 14.1.2. Industrial
- 14.2. Market Analysis, Insights and Forecast - by Tonnage
- 14.2.1. Low
- 14.2.2. Medium
- 14.2.3. High
- 14.3. Market Analysis, Insights and Forecast - by Power Train Type
- 14.3.1. IC Engine
- 14.3.2. Hybrid
- 14.1. Market Analysis, Insights and Forecast - by Application
- 15. China Reach Stacker Industry Analysis, Insights and Forecast, 2020-2032
- 15.1. Market Analysis, Insights and Forecast - by Application
- 15.1.1. Sea Ports
- 15.1.2. Industrial
- 15.2. Market Analysis, Insights and Forecast - by Tonnage
- 15.2.1. Low
- 15.2.2. Medium
- 15.2.3. High
- 15.3. Market Analysis, Insights and Forecast - by Power Train Type
- 15.3.1. IC Engine
- 15.3.2. Hybrid
- 15.1. Market Analysis, Insights and Forecast - by Application
- 16. India Reach Stacker Industry Analysis, Insights and Forecast, 2020-2032
- 16.1. Market Analysis, Insights and Forecast - by Application
- 16.1.1. Sea Ports
- 16.1.2. Industrial
- 16.2. Market Analysis, Insights and Forecast - by Tonnage
- 16.2.1. Low
- 16.2.2. Medium
- 16.2.3. High
- 16.3. Market Analysis, Insights and Forecast - by Power Train Type
- 16.3.1. IC Engine
- 16.3.2. Hybrid
- 16.1. Market Analysis, Insights and Forecast - by Application
- 17. Japan Reach Stacker Industry Analysis, Insights and Forecast, 2020-2032
- 17.1. Market Analysis, Insights and Forecast - by Application
- 17.1.1. Sea Ports
- 17.1.2. Industrial
- 17.2. Market Analysis, Insights and Forecast - by Tonnage
- 17.2.1. Low
- 17.2.2. Medium
- 17.2.3. High
- 17.3. Market Analysis, Insights and Forecast - by Power Train Type
- 17.3.1. IC Engine
- 17.3.2. Hybrid
- 17.1. Market Analysis, Insights and Forecast - by Application
- 18. South Korea Reach Stacker Industry Analysis, Insights and Forecast, 2020-2032
- 18.1. Market Analysis, Insights and Forecast - by Application
- 18.1.1. Sea Ports
- 18.1.2. Industrial
- 18.2. Market Analysis, Insights and Forecast - by Tonnage
- 18.2.1. Low
- 18.2.2. Medium
- 18.2.3. High
- 18.3. Market Analysis, Insights and Forecast - by Power Train Type
- 18.3.1. IC Engine
- 18.3.2. Hybrid
- 18.1. Market Analysis, Insights and Forecast - by Application
- 19. Rest of Asia Pacific Reach Stacker Industry Analysis, Insights and Forecast, 2020-2032
- 19.1. Market Analysis, Insights and Forecast - by Application
- 19.1.1. Sea Ports
- 19.1.2. Industrial
- 19.2. Market Analysis, Insights and Forecast - by Tonnage
- 19.2.1. Low
- 19.2.2. Medium
- 19.2.3. High
- 19.3. Market Analysis, Insights and Forecast - by Power Train Type
- 19.3.1. IC Engine
- 19.3.2. Hybrid
- 19.1. Market Analysis, Insights and Forecast - by Application
- 20. Mexico Reach Stacker Industry Analysis, Insights and Forecast, 2020-2032
- 20.1. Market Analysis, Insights and Forecast - by Application
- 20.1.1. Sea Ports
- 20.1.2. Industrial
- 20.2. Market Analysis, Insights and Forecast - by Tonnage
- 20.2.1. Low
- 20.2.2. Medium
- 20.2.3. High
- 20.3. Market Analysis, Insights and Forecast - by Power Train Type
- 20.3.1. IC Engine
- 20.3.2. Hybrid
- 20.1. Market Analysis, Insights and Forecast - by Application
- 21. Brazil Reach Stacker Industry Analysis, Insights and Forecast, 2020-2032
- 21.1. Market Analysis, Insights and Forecast - by Application
- 21.1.1. Sea Ports
- 21.1.2. Industrial
- 21.2. Market Analysis, Insights and Forecast - by Tonnage
- 21.2.1. Low
- 21.2.2. Medium
- 21.2.3. High
- 21.3. Market Analysis, Insights and Forecast - by Power Train Type
- 21.3.1. IC Engine
- 21.3.2. Hybrid
- 21.1. Market Analysis, Insights and Forecast - by Application
- 22. United Arab Emirates Reach Stacker Industry Analysis, Insights and Forecast, 2020-2032
- 22.1. Market Analysis, Insights and Forecast - by Application
- 22.1.1. Sea Ports
- 22.1.2. Industrial
- 22.2. Market Analysis, Insights and Forecast - by Tonnage
- 22.2.1. Low
- 22.2.2. Medium
- 22.2.3. High
- 22.3. Market Analysis, Insights and Forecast - by Power Train Type
- 22.3.1. IC Engine
- 22.3.2. Hybrid
- 22.1. Market Analysis, Insights and Forecast - by Application
- 23. Other Countries Reach Stacker Industry Analysis, Insights and Forecast, 2020-2032
- 23.1. Market Analysis, Insights and Forecast - by Application
- 23.1.1. Sea Ports
- 23.1.2. Industrial
- 23.2. Market Analysis, Insights and Forecast - by Tonnage
- 23.2.1. Low
- 23.2.2. Medium
- 23.2.3. High
- 23.3. Market Analysis, Insights and Forecast - by Power Train Type
- 23.3.1. IC Engine
- 23.3.2. Hybrid
- 23.1. Market Analysis, Insights and Forecast - by Application
- 24. Competitive Analysis
- 24.1. Company Profiles
- 24.1.1 Konecranes
- 24.1.1.1. Company Overview
- 24.1.1.2. Products
- 24.1.1.3. Company Financials
- 24.1.1.4. SWOT Analysis
- 24.1.2 Sany Group
- 24.1.2.1. Company Overview
- 24.1.2.2. Products
- 24.1.2.3. Company Financials
- 24.1.2.4. SWOT Analysis
- 24.1.3 Hyster
- 24.1.3.1. Company Overview
- 24.1.3.2. Products
- 24.1.3.3. Company Financials
- 24.1.3.4. SWOT Analysis
- 24.1.4 SMV Global
- 24.1.4.1. Company Overview
- 24.1.4.2. Products
- 24.1.4.3. Company Financials
- 24.1.4.4. SWOT Analysis
- 24.1.5 Liebherr Group
- 24.1.5.1. Company Overview
- 24.1.5.2. Products
- 24.1.5.3. Company Financials
- 24.1.5.4. SWOT Analysis
- 24.1.6 Toyota*List Not Exhaustive
- 24.1.6.1. Company Overview
- 24.1.6.2. Products
- 24.1.6.3. Company Financials
- 24.1.6.4. SWOT Analysis
- 24.1.7 Kalmar Group
- 24.1.7.1. Company Overview
- 24.1.7.2. Products
- 24.1.7.3. Company Financials
- 24.1.7.4. SWOT Analysis
- 24.1.8 CVS Ferrari S P A
- 24.1.8.1. Company Overview
- 24.1.8.2. Products
- 24.1.8.3. Company Financials
- 24.1.8.4. SWOT Analysis
- 24.1.9 Terex
- 24.1.9.1. Company Overview
- 24.1.9.2. Products
- 24.1.9.3. Company Financials
- 24.1.9.4. SWOT Analysis
- 24.1.1 Konecranes
- 24.2. Market Entropy
- 24.2.1 Company's Key Areas Served
- 24.2.2 Recent Developments
- 24.3. Company Market Share Analysis 2025
- 24.3.1 Top 5 Companies Market Share Analysis
- 24.3.2 Top 3 Companies Market Share Analysis
- 24.4. List of Potential Customers
- 25. Research Methodology
List of Figures
- Figure 1: Global Reach Stacker Industry Revenue Breakdown (billion, %) by Region 2025 & 2033
- Figure 2: United States Reach Stacker Industry Revenue (billion), by Application 2025 & 2033
- Figure 3: United States Reach Stacker Industry Revenue Share (%), by Application 2025 & 2033
- Figure 4: United States Reach Stacker Industry Revenue (billion), by Tonnage 2025 & 2033
- Figure 5: United States Reach Stacker Industry Revenue Share (%), by Tonnage 2025 & 2033
- Figure 6: United States Reach Stacker Industry Revenue (billion), by Power Train Type 2025 & 2033
- Figure 7: United States Reach Stacker Industry Revenue Share (%), by Power Train Type 2025 & 2033
- Figure 8: United States Reach Stacker Industry Revenue (billion), by Country 2025 & 2033
- Figure 9: United States Reach Stacker Industry Revenue Share (%), by Country 2025 & 2033
- Figure 10: Canada Reach Stacker Industry Revenue (billion), by Application 2025 & 2033
- Figure 11: Canada Reach Stacker Industry Revenue Share (%), by Application 2025 & 2033
- Figure 12: Canada Reach Stacker Industry Revenue (billion), by Tonnage 2025 & 2033
- Figure 13: Canada Reach Stacker Industry Revenue Share (%), by Tonnage 2025 & 2033
- Figure 14: Canada Reach Stacker Industry Revenue (billion), by Power Train Type 2025 & 2033
- Figure 15: Canada Reach Stacker Industry Revenue Share (%), by Power Train Type 2025 & 2033
- Figure 16: Canada Reach Stacker Industry Revenue (billion), by Country 2025 & 2033
- Figure 17: Canada Reach Stacker Industry Revenue Share (%), by Country 2025 & 2033
- Figure 18: Rest of North America Reach Stacker Industry Revenue (billion), by Application 2025 & 2033
- Figure 19: Rest of North America Reach Stacker Industry Revenue Share (%), by Application 2025 & 2033
- Figure 20: Rest of North America Reach Stacker Industry Revenue (billion), by Tonnage 2025 & 2033
- Figure 21: Rest of North America Reach Stacker Industry Revenue Share (%), by Tonnage 2025 & 2033
- Figure 22: Rest of North America Reach Stacker Industry Revenue (billion), by Power Train Type 2025 & 2033
- Figure 23: Rest of North America Reach Stacker Industry Revenue Share (%), by Power Train Type 2025 & 2033
- Figure 24: Rest of North America Reach Stacker Industry Revenue (billion), by Country 2025 & 2033
- Figure 25: Rest of North America Reach Stacker Industry Revenue Share (%), by Country 2025 & 2033
- Figure 26: Germany Reach Stacker Industry Revenue (billion), by Application 2025 & 2033
- Figure 27: Germany Reach Stacker Industry Revenue Share (%), by Application 2025 & 2033
- Figure 28: Germany Reach Stacker Industry Revenue (billion), by Tonnage 2025 & 2033
- Figure 29: Germany Reach Stacker Industry Revenue Share (%), by Tonnage 2025 & 2033
- Figure 30: Germany Reach Stacker Industry Revenue (billion), by Power Train Type 2025 & 2033
- Figure 31: Germany Reach Stacker Industry Revenue Share (%), by Power Train Type 2025 & 2033
- Figure 32: Germany Reach Stacker Industry Revenue (billion), by Country 2025 & 2033
- Figure 33: Germany Reach Stacker Industry Revenue Share (%), by Country 2025 & 2033
- Figure 34: United Kingdom Reach Stacker Industry Revenue (billion), by Application 2025 & 2033
- Figure 35: United Kingdom Reach Stacker Industry Revenue Share (%), by Application 2025 & 2033
- Figure 36: United Kingdom Reach Stacker Industry Revenue (billion), by Tonnage 2025 & 2033
- Figure 37: United Kingdom Reach Stacker Industry Revenue Share (%), by Tonnage 2025 & 2033
- Figure 38: United Kingdom Reach Stacker Industry Revenue (billion), by Power Train Type 2025 & 2033
- Figure 39: United Kingdom Reach Stacker Industry Revenue Share (%), by Power Train Type 2025 & 2033
- Figure 40: United Kingdom Reach Stacker Industry Revenue (billion), by Country 2025 & 2033
- Figure 41: United Kingdom Reach Stacker Industry Revenue Share (%), by Country 2025 & 2033
- Figure 42: France Reach Stacker Industry Revenue (billion), by Application 2025 & 2033
- Figure 43: France Reach Stacker Industry Revenue Share (%), by Application 2025 & 2033
- Figure 44: France Reach Stacker Industry Revenue (billion), by Tonnage 2025 & 2033
- Figure 45: France Reach Stacker Industry Revenue Share (%), by Tonnage 2025 & 2033
- Figure 46: France Reach Stacker Industry Revenue (billion), by Power Train Type 2025 & 2033
- Figure 47: France Reach Stacker Industry Revenue Share (%), by Power Train Type 2025 & 2033
- Figure 48: France Reach Stacker Industry Revenue (billion), by Country 2025 & 2033
- Figure 49: France Reach Stacker Industry Revenue Share (%), by Country 2025 & 2033
- Figure 50: Italy Reach Stacker Industry Revenue (billion), by Application 2025 & 2033
- Figure 51: Italy Reach Stacker Industry Revenue Share (%), by Application 2025 & 2033
- Figure 52: Italy Reach Stacker Industry Revenue (billion), by Tonnage 2025 & 2033
- Figure 53: Italy Reach Stacker Industry Revenue Share (%), by Tonnage 2025 & 2033
- Figure 54: Italy Reach Stacker Industry Revenue (billion), by Power Train Type 2025 & 2033
- Figure 55: Italy Reach Stacker Industry Revenue Share (%), by Power Train Type 2025 & 2033
- Figure 56: Italy Reach Stacker Industry Revenue (billion), by Country 2025 & 2033
- Figure 57: Italy Reach Stacker Industry Revenue Share (%), by Country 2025 & 2033
- Figure 58: Rest of Europe Reach Stacker Industry Revenue (billion), by Application 2025 & 2033
- Figure 59: Rest of Europe Reach Stacker Industry Revenue Share (%), by Application 2025 & 2033
- Figure 60: Rest of Europe Reach Stacker Industry Revenue (billion), by Tonnage 2025 & 2033
- Figure 61: Rest of Europe Reach Stacker Industry Revenue Share (%), by Tonnage 2025 & 2033
- Figure 62: Rest of Europe Reach Stacker Industry Revenue (billion), by Power Train Type 2025 & 2033
- Figure 63: Rest of Europe Reach Stacker Industry Revenue Share (%), by Power Train Type 2025 & 2033
- Figure 64: Rest of Europe Reach Stacker Industry Revenue (billion), by Country 2025 & 2033
- Figure 65: Rest of Europe Reach Stacker Industry Revenue Share (%), by Country 2025 & 2033
- Figure 66: China Reach Stacker Industry Revenue (billion), by Application 2025 & 2033
- Figure 67: China Reach Stacker Industry Revenue Share (%), by Application 2025 & 2033
- Figure 68: China Reach Stacker Industry Revenue (billion), by Tonnage 2025 & 2033
- Figure 69: China Reach Stacker Industry Revenue Share (%), by Tonnage 2025 & 2033
- Figure 70: China Reach Stacker Industry Revenue (billion), by Power Train Type 2025 & 2033
- Figure 71: China Reach Stacker Industry Revenue Share (%), by Power Train Type 2025 & 2033
- Figure 72: China Reach Stacker Industry Revenue (billion), by Country 2025 & 2033
- Figure 73: China Reach Stacker Industry Revenue Share (%), by Country 2025 & 2033
- Figure 74: India Reach Stacker Industry Revenue (billion), by Application 2025 & 2033
- Figure 75: India Reach Stacker Industry Revenue Share (%), by Application 2025 & 2033
- Figure 76: India Reach Stacker Industry Revenue (billion), by Tonnage 2025 & 2033
- Figure 77: India Reach Stacker Industry Revenue Share (%), by Tonnage 2025 & 2033
- Figure 78: India Reach Stacker Industry Revenue (billion), by Power Train Type 2025 & 2033
- Figure 79: India Reach Stacker Industry Revenue Share (%), by Power Train Type 2025 & 2033
- Figure 80: India Reach Stacker Industry Revenue (billion), by Country 2025 & 2033
- Figure 81: India Reach Stacker Industry Revenue Share (%), by Country 2025 & 2033
- Figure 82: Japan Reach Stacker Industry Revenue (billion), by Application 2025 & 2033
- Figure 83: Japan Reach Stacker Industry Revenue Share (%), by Application 2025 & 2033
- Figure 84: Japan Reach Stacker Industry Revenue (billion), by Tonnage 2025 & 2033
- Figure 85: Japan Reach Stacker Industry Revenue Share (%), by Tonnage 2025 & 2033
- Figure 86: Japan Reach Stacker Industry Revenue (billion), by Power Train Type 2025 & 2033
- Figure 87: Japan Reach Stacker Industry Revenue Share (%), by Power Train Type 2025 & 2033
- Figure 88: Japan Reach Stacker Industry Revenue (billion), by Country 2025 & 2033
- Figure 89: Japan Reach Stacker Industry Revenue Share (%), by Country 2025 & 2033
- Figure 90: South Korea Reach Stacker Industry Revenue (billion), by Application 2025 & 2033
- Figure 91: South Korea Reach Stacker Industry Revenue Share (%), by Application 2025 & 2033
- Figure 92: South Korea Reach Stacker Industry Revenue (billion), by Tonnage 2025 & 2033
- Figure 93: South Korea Reach Stacker Industry Revenue Share (%), by Tonnage 2025 & 2033
- Figure 94: South Korea Reach Stacker Industry Revenue (billion), by Power Train Type 2025 & 2033
- Figure 95: South Korea Reach Stacker Industry Revenue Share (%), by Power Train Type 2025 & 2033
- Figure 96: South Korea Reach Stacker Industry Revenue (billion), by Country 2025 & 2033
- Figure 97: South Korea Reach Stacker Industry Revenue Share (%), by Country 2025 & 2033
- Figure 98: Rest of Asia Pacific Reach Stacker Industry Revenue (billion), by Application 2025 & 2033
- Figure 99: Rest of Asia Pacific Reach Stacker Industry Revenue Share (%), by Application 2025 & 2033
- Figure 100: Rest of Asia Pacific Reach Stacker Industry Revenue (billion), by Tonnage 2025 & 2033
- Figure 101: Rest of Asia Pacific Reach Stacker Industry Revenue Share (%), by Tonnage 2025 & 2033
- Figure 102: Rest of Asia Pacific Reach Stacker Industry Revenue (billion), by Power Train Type 2025 & 2033
- Figure 103: Rest of Asia Pacific Reach Stacker Industry Revenue Share (%), by Power Train Type 2025 & 2033
- Figure 104: Rest of Asia Pacific Reach Stacker Industry Revenue (billion), by Country 2025 & 2033
- Figure 105: Rest of Asia Pacific Reach Stacker Industry Revenue Share (%), by Country 2025 & 2033
- Figure 106: Mexico Reach Stacker Industry Revenue (billion), by Application 2025 & 2033
- Figure 107: Mexico Reach Stacker Industry Revenue Share (%), by Application 2025 & 2033
- Figure 108: Mexico Reach Stacker Industry Revenue (billion), by Tonnage 2025 & 2033
- Figure 109: Mexico Reach Stacker Industry Revenue Share (%), by Tonnage 2025 & 2033
- Figure 110: Mexico Reach Stacker Industry Revenue (billion), by Power Train Type 2025 & 2033
- Figure 111: Mexico Reach Stacker Industry Revenue Share (%), by Power Train Type 2025 & 2033
- Figure 112: Mexico Reach Stacker Industry Revenue (billion), by Country 2025 & 2033
- Figure 113: Mexico Reach Stacker Industry Revenue Share (%), by Country 2025 & 2033
- Figure 114: Brazil Reach Stacker Industry Revenue (billion), by Application 2025 & 2033
- Figure 115: Brazil Reach Stacker Industry Revenue Share (%), by Application 2025 & 2033
- Figure 116: Brazil Reach Stacker Industry Revenue (billion), by Tonnage 2025 & 2033
- Figure 117: Brazil Reach Stacker Industry Revenue Share (%), by Tonnage 2025 & 2033
- Figure 118: Brazil Reach Stacker Industry Revenue (billion), by Power Train Type 2025 & 2033
- Figure 119: Brazil Reach Stacker Industry Revenue Share (%), by Power Train Type 2025 & 2033
- Figure 120: Brazil Reach Stacker Industry Revenue (billion), by Country 2025 & 2033
- Figure 121: Brazil Reach Stacker Industry Revenue Share (%), by Country 2025 & 2033
- Figure 122: United Arab Emirates Reach Stacker Industry Revenue (billion), by Application 2025 & 2033
- Figure 123: United Arab Emirates Reach Stacker Industry Revenue Share (%), by Application 2025 & 2033
- Figure 124: United Arab Emirates Reach Stacker Industry Revenue (billion), by Tonnage 2025 & 2033
- Figure 125: United Arab Emirates Reach Stacker Industry Revenue Share (%), by Tonnage 2025 & 2033
- Figure 126: United Arab Emirates Reach Stacker Industry Revenue (billion), by Power Train Type 2025 & 2033
- Figure 127: United Arab Emirates Reach Stacker Industry Revenue Share (%), by Power Train Type 2025 & 2033
- Figure 128: United Arab Emirates Reach Stacker Industry Revenue (billion), by Country 2025 & 2033
- Figure 129: United Arab Emirates Reach Stacker Industry Revenue Share (%), by Country 2025 & 2033
- Figure 130: Other Countries Reach Stacker Industry Revenue (billion), by Application 2025 & 2033
- Figure 131: Other Countries Reach Stacker Industry Revenue Share (%), by Application 2025 & 2033
- Figure 132: Other Countries Reach Stacker Industry Revenue (billion), by Tonnage 2025 & 2033
- Figure 133: Other Countries Reach Stacker Industry Revenue Share (%), by Tonnage 2025 & 2033
- Figure 134: Other Countries Reach Stacker Industry Revenue (billion), by Power Train Type 2025 & 2033
- Figure 135: Other Countries Reach Stacker Industry Revenue Share (%), by Power Train Type 2025 & 2033
- Figure 136: Other Countries Reach Stacker Industry Revenue (billion), by Country 2025 & 2033
- Figure 137: Other Countries Reach Stacker Industry Revenue Share (%), by Country 2025 & 2033
List of Tables
- Table 1: Global Reach Stacker Industry Revenue billion Forecast, by Application 2020 & 2033
- Table 2: Global Reach Stacker Industry Revenue billion Forecast, by Tonnage 2020 & 2033
- Table 3: Global Reach Stacker Industry Revenue billion Forecast, by Power Train Type 2020 & 2033
- Table 4: Global Reach Stacker Industry Revenue billion Forecast, by Region 2020 & 2033
- Table 5: Global Reach Stacker Industry Revenue billion Forecast, by Application 2020 & 2033
- Table 6: Global Reach Stacker Industry Revenue billion Forecast, by Tonnage 2020 & 2033
- Table 7: Global Reach Stacker Industry Revenue billion Forecast, by Power Train Type 2020 & 2033
- Table 8: Global Reach Stacker Industry Revenue billion Forecast, by Country 2020 & 2033
- Table 9: Global Reach Stacker Industry Revenue billion Forecast, by Application 2020 & 2033
- Table 10: Global Reach Stacker Industry Revenue billion Forecast, by Tonnage 2020 & 2033
- Table 11: Global Reach Stacker Industry Revenue billion Forecast, by Power Train Type 2020 & 2033
- Table 12: Global Reach Stacker Industry Revenue billion Forecast, by Country 2020 & 2033
- Table 13: Global Reach Stacker Industry Revenue billion Forecast, by Application 2020 & 2033
- Table 14: Global Reach Stacker Industry Revenue billion Forecast, by Tonnage 2020 & 2033
- Table 15: Global Reach Stacker Industry Revenue billion Forecast, by Power Train Type 2020 & 2033
- Table 16: Global Reach Stacker Industry Revenue billion Forecast, by Country 2020 & 2033
- Table 17: Global Reach Stacker Industry Revenue billion Forecast, by Application 2020 & 2033
- Table 18: Global Reach Stacker Industry Revenue billion Forecast, by Tonnage 2020 & 2033
- Table 19: Global Reach Stacker Industry Revenue billion Forecast, by Power Train Type 2020 & 2033
- Table 20: Global Reach Stacker Industry Revenue billion Forecast, by Country 2020 & 2033
- Table 21: Global Reach Stacker Industry Revenue billion Forecast, by Application 2020 & 2033
- Table 22: Global Reach Stacker Industry Revenue billion Forecast, by Tonnage 2020 & 2033
- Table 23: Global Reach Stacker Industry Revenue billion Forecast, by Power Train Type 2020 & 2033
- Table 24: Global Reach Stacker Industry Revenue billion Forecast, by Country 2020 & 2033
- Table 25: Global Reach Stacker Industry Revenue billion Forecast, by Application 2020 & 2033
- Table 26: Global Reach Stacker Industry Revenue billion Forecast, by Tonnage 2020 & 2033
- Table 27: Global Reach Stacker Industry Revenue billion Forecast, by Power Train Type 2020 & 2033
- Table 28: Global Reach Stacker Industry Revenue billion Forecast, by Country 2020 & 2033
- Table 29: Global Reach Stacker Industry Revenue billion Forecast, by Application 2020 & 2033
- Table 30: Global Reach Stacker Industry Revenue billion Forecast, by Tonnage 2020 & 2033
- Table 31: Global Reach Stacker Industry Revenue billion Forecast, by Power Train Type 2020 & 2033
- Table 32: Global Reach Stacker Industry Revenue billion Forecast, by Country 2020 & 2033
- Table 33: Global Reach Stacker Industry Revenue billion Forecast, by Application 2020 & 2033
- Table 34: Global Reach Stacker Industry Revenue billion Forecast, by Tonnage 2020 & 2033
- Table 35: Global Reach Stacker Industry Revenue billion Forecast, by Power Train Type 2020 & 2033
- Table 36: Global Reach Stacker Industry Revenue billion Forecast, by Country 2020 & 2033
- Table 37: Global Reach Stacker Industry Revenue billion Forecast, by Application 2020 & 2033
- Table 38: Global Reach Stacker Industry Revenue billion Forecast, by Tonnage 2020 & 2033
- Table 39: Global Reach Stacker Industry Revenue billion Forecast, by Power Train Type 2020 & 2033
- Table 40: Global Reach Stacker Industry Revenue billion Forecast, by Country 2020 & 2033
- Table 41: Global Reach Stacker Industry Revenue billion Forecast, by Application 2020 & 2033
- Table 42: Global Reach Stacker Industry Revenue billion Forecast, by Tonnage 2020 & 2033
- Table 43: Global Reach Stacker Industry Revenue billion Forecast, by Power Train Type 2020 & 2033
- Table 44: Global Reach Stacker Industry Revenue billion Forecast, by Country 2020 & 2033
- Table 45: Global Reach Stacker Industry Revenue billion Forecast, by Application 2020 & 2033
- Table 46: Global Reach Stacker Industry Revenue billion Forecast, by Tonnage 2020 & 2033
- Table 47: Global Reach Stacker Industry Revenue billion Forecast, by Power Train Type 2020 & 2033
- Table 48: Global Reach Stacker Industry Revenue billion Forecast, by Country 2020 & 2033
- Table 49: Global Reach Stacker Industry Revenue billion Forecast, by Application 2020 & 2033
- Table 50: Global Reach Stacker Industry Revenue billion Forecast, by Tonnage 2020 & 2033
- Table 51: Global Reach Stacker Industry Revenue billion Forecast, by Power Train Type 2020 & 2033
- Table 52: Global Reach Stacker Industry Revenue billion Forecast, by Country 2020 & 2033
- Table 53: Global Reach Stacker Industry Revenue billion Forecast, by Application 2020 & 2033
- Table 54: Global Reach Stacker Industry Revenue billion Forecast, by Tonnage 2020 & 2033
- Table 55: Global Reach Stacker Industry Revenue billion Forecast, by Power Train Type 2020 & 2033
- Table 56: Global Reach Stacker Industry Revenue billion Forecast, by Country 2020 & 2033
- Table 57: Global Reach Stacker Industry Revenue billion Forecast, by Application 2020 & 2033
- Table 58: Global Reach Stacker Industry Revenue billion Forecast, by Tonnage 2020 & 2033
- Table 59: Global Reach Stacker Industry Revenue billion Forecast, by Power Train Type 2020 & 2033
- Table 60: Global Reach Stacker Industry Revenue billion Forecast, by Country 2020 & 2033
- Table 61: Global Reach Stacker Industry Revenue billion Forecast, by Application 2020 & 2033
- Table 62: Global Reach Stacker Industry Revenue billion Forecast, by Tonnage 2020 & 2033
- Table 63: Global Reach Stacker Industry Revenue billion Forecast, by Power Train Type 2020 & 2033
- Table 64: Global Reach Stacker Industry Revenue billion Forecast, by Country 2020 & 2033
- Table 65: Global Reach Stacker Industry Revenue billion Forecast, by Application 2020 & 2033
- Table 66: Global Reach Stacker Industry Revenue billion Forecast, by Tonnage 2020 & 2033
- Table 67: Global Reach Stacker Industry Revenue billion Forecast, by Power Train Type 2020 & 2033
- Table 68: Global Reach Stacker Industry Revenue billion Forecast, by Country 2020 & 2033
- Table 69: Global Reach Stacker Industry Revenue billion Forecast, by Application 2020 & 2033
- Table 70: Global Reach Stacker Industry Revenue billion Forecast, by Tonnage 2020 & 2033
- Table 71: Global Reach Stacker Industry Revenue billion Forecast, by Power Train Type 2020 & 2033
- Table 72: Global Reach Stacker Industry Revenue billion Forecast, by Country 2020 & 2033
Frequently Asked Questions
1. What is the projected Compound Annual Growth Rate (CAGR) of the Reach Stacker Industry?
The projected CAGR is approximately 6.9%.
2. Which companies are prominent players in the Reach Stacker Industry?
Key companies in the market include Konecranes, Sany Group, Hyster, SMV Global, Liebherr Group, Toyota*List Not Exhaustive, Kalmar Group, CVS Ferrari S P A, Terex.
3. What are the main segments of the Reach Stacker Industry?
The market segments include Application, Tonnage, Power Train Type.
4. Can you provide details about the market size?
The market size is estimated to be USD 3.2 billion as of 2022.
5. What are some drivers contributing to market growth?
Diverse Selection Among Car Models is Anticipated to Drive the Market Growth.
6. What are the notable trends driving market growth?
Electric Reach Stacker to Gain Momentum.
7. Are there any restraints impacting market growth?
Counterfeit and Illegally Imported Vehicles are Restraining the Market Growth.
8. Can you provide examples of recent developments in the market?
N/A
9. What pricing options are available for accessing the report?
Pricing options include single-user, multi-user, and enterprise licenses priced at USD 4750, USD 5250, and USD 8750 respectively.
10. Is the market size provided in terms of value or volume?
The market size is provided in terms of value, measured in billion.
11. Are there any specific market keywords associated with the report?
Yes, the market keyword associated with the report is "Reach Stacker Industry," which aids in identifying and referencing the specific market segment covered.
12. How do I determine which pricing option suits my needs best?
The pricing options vary based on user requirements and access needs. Individual users may opt for single-user licenses, while businesses requiring broader access may choose multi-user or enterprise licenses for cost-effective access to the report.
13. Are there any additional resources or data provided in the Reach Stacker Industry report?
While the report offers comprehensive insights, it's advisable to review the specific contents or supplementary materials provided to ascertain if additional resources or data are available.
14. How can I stay updated on further developments or reports in the Reach Stacker Industry?
To stay informed about further developments, trends, and reports in the Reach Stacker Industry, consider subscribing to industry newsletters, following relevant companies and organizations, or regularly checking reputable industry news sources and publications.
Methodology
Step 1 - Identification of Relevant Samples Size from Population Database


Step 2 - Approaches for Defining Global Market Size (Value, Volume* & Price*)

Note*: In applicable scenarios
Step 3 - Data Sources
Primary Research
- Web Analytics
- Survey Reports
- Research Institute
- Latest Research Reports
- Opinion Leaders
Secondary Research
- Annual Reports
- White Paper
- Latest Press Release
- Industry Association
- Paid Database
- Investor Presentations

Step 4 - Data Triangulation
Involves using different sources of information in order to increase the validity of a study
These sources are likely to be stakeholders in a program - participants, other researchers, program staff, other community members, and so on.
Then we put all data in single framework & apply various statistical tools to find out the dynamic on the market.
During the analysis stage, feedback from the stakeholder groups would be compared to determine areas of agreement as well as areas of divergence