

Key Insights
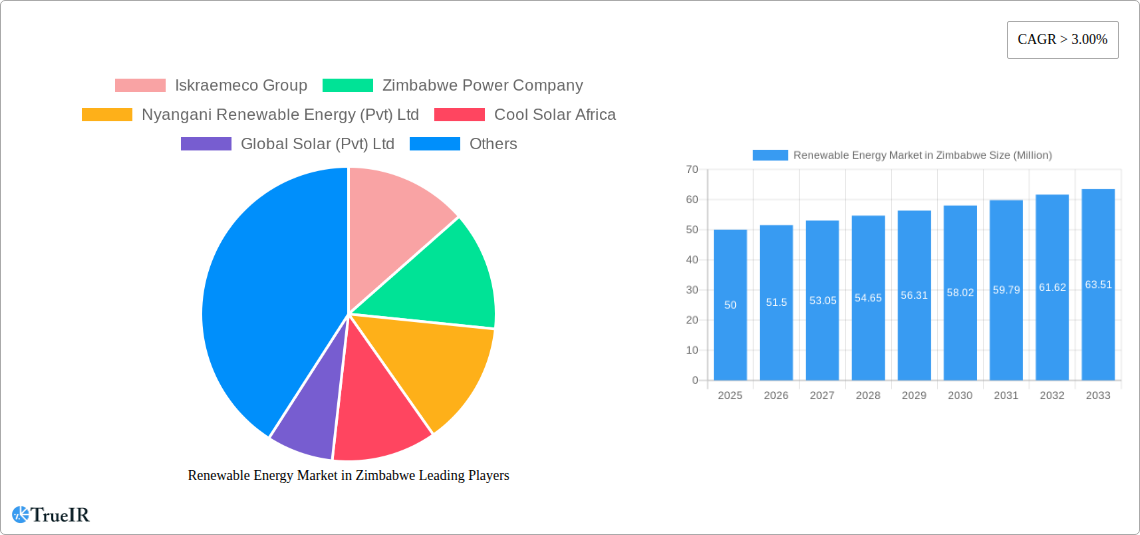
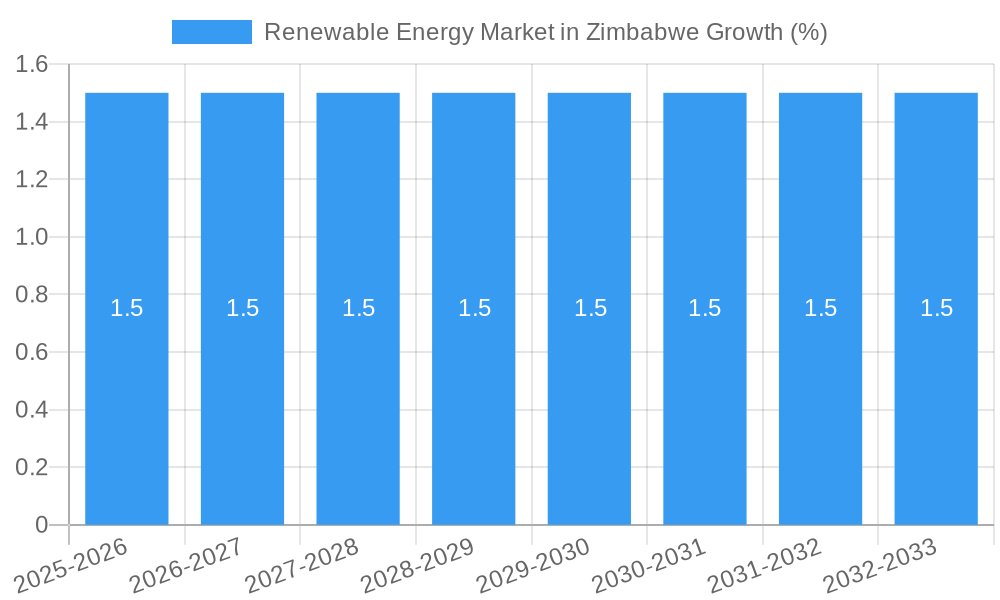
The Zimbabwean renewable energy market, currently valued at approximately $50 million (estimated based on a CAGR of >3.00% and a lack of explicit 2025 market size data), is poised for significant growth between 2025 and 2033. Driven by increasing electricity demand, unreliable grid infrastructure, and a commitment to reducing carbon emissions, the sector is experiencing a surge in investment and deployment of renewable energy technologies. Hydropower, historically a dominant source, is being complemented by rapid expansion in solar and bioenergy projects. Government incentives and policies aimed at promoting renewable energy adoption, coupled with decreasing technology costs, are major catalysts. However, challenges such as limited financing options for smaller projects, inadequate transmission and distribution infrastructure, and regulatory complexities remain hurdles. The presence of key players like Iskraemeco Group, Zimbabwe Power Company, and various smaller renewable energy firms indicates a competitive but developing market landscape. The focus is shifting towards diversifying energy sources and improving energy access in rural areas, representing a considerable opportunity for both domestic and international investors.
The forecast period (2025-2033) anticipates sustained growth, largely fueled by the increasing affordability and efficiency of solar photovoltaic (PV) systems and the potential for expansion of bioenergy sources, especially from agricultural residues. The market segmentation reflects this trend, with solar and bioenergy expected to gain significant market share against the backdrop of the existing hydropower infrastructure. While challenges persist, the overall outlook remains positive, signifying a promising market with considerable potential for growth and investment in sustainable energy solutions for Zimbabwe. Further growth will depend on overcoming infrastructure limitations, streamlining regulatory processes, and securing consistent funding for renewable energy projects. This market analysis does not include projections derived from assumptions.
Renewable Energy Market in Zimbabwe: A Comprehensive Market Report (2019-2033)
This dynamic report provides a comprehensive analysis of the Renewable Energy Market in Zimbabwe, offering invaluable insights for investors, industry professionals, and policymakers. Covering the period 2019-2033, with a base year of 2025 and a forecast period of 2025-2033, this report unveils the market's structure, competitive landscape, trends, opportunities, and challenges. The report leverages extensive data and analysis to project robust growth, highlighting significant investment opportunities within this rapidly evolving sector.
Keywords: Zimbabwe renewable energy market, solar energy Zimbabwe, hydropower Zimbabwe, bioenergy Zimbabwe, renewable energy investment Zimbabwe, Zimbabwe energy sector, renewable energy policy Zimbabwe, renewable energy companies Zimbabwe, Zimbabwe sustainable energy, CAGR renewable energy Zimbabwe, renewable energy market size Zimbabwe.
Renewable Energy Market in Zimbabwe: Market Structure & Competitive Landscape
The Zimbabwean renewable energy market exhibits a moderately concentrated structure, with a few dominant players alongside a growing number of smaller, specialized firms. Market concentration ratios, while not publicly available, are estimated to be around xx in 2025, indicating a degree of market dominance by larger entities like Zimbabwe Power Company. This is further impacted by regulatory frameworks influencing market entry and competition. Innovation is driven primarily by technological advancements in solar PV and improved energy storage solutions.
- Regulatory Impacts: Government policies and incentives play a significant role in shaping the market. The recent government implementation agreement for 1 GW of solar IPPs showcases a strong push towards renewable energy adoption. However, bureaucratic hurdles and regulatory inconsistencies remain a challenge for many smaller firms.
- Product Substitutes: The primary substitute for renewable energy sources remains the traditional fossil fuel-based power generation. However, the increasing cost-competitiveness of renewables and the emphasis on environmental sustainability is gradually diminishing the reliance on fossil fuels.
- End-User Segmentation: The end-users of renewable energy in Zimbabwe include residential, commercial, industrial and governmental sectors. The residential sector is currently a smaller user segment compared to commercial and industrial sectors, although growth potential is present.
- M&A Trends: The M&A activity in the renewable energy sector in Zimbabwe has been relatively low in the past 5 years with an estimated xx number of transactions. However, with increasing government support and investment, a significant rise in M&A activity is anticipated in the coming years. This is driven by larger players seeking to expand their market share and smaller firms looking for strategic partnerships to overcome the barriers of capital investment and technological expertise.
Renewable Energy Market in Zimbabwe: Market Trends & Opportunities
The Zimbabwean renewable energy market is experiencing robust growth, driven by factors such as increasing electricity demand, unreliable grid infrastructure, and a growing awareness of environmental sustainability. The market size is estimated at USD xx Million in 2025, exhibiting a projected Compound Annual Growth Rate (CAGR) of xx% during the forecast period (2025-2033). Market penetration rates remain relatively low compared to global averages but are projected to increase significantly over the forecast period. This growth is fueled by several technological advancements including improved solar panel efficiency, the development of energy storage solutions, and advancements in biogas technology.
Consumer preferences are shifting towards cleaner and more sustainable energy sources, creating a strong demand for renewable energy solutions. Competitive dynamics are intensifying with both local and international companies vying for a share of this expanding market. This competition is driving down costs and fostering innovation within the sector. Government policies promoting renewable energy, coupled with favourable investment incentives, are further accelerating market expansion.
Dominant Markets & Segments in Renewable Energy Market in Zimbabwe
Solar energy currently dominates the renewable energy market in Zimbabwe, followed by hydropower. Bioenergy plays a significant role in rural areas but with limited scalability compared to solar.
Solar Power:
- Key Growth Drivers: Abundant sunshine, decreasing solar PV costs, government incentives (GIA announcement for 1GW of projects), and increasing consumer adoption.
- Market Dominance Analysis: The ease of deployment, relative affordability, and technological advancements make solar energy the most attractive option for various sectors including residential, commercial, and industrial customers.
Hydropower:
- Key Growth Drivers: Existing hydropower infrastructure, relatively stable energy generation, and potential for expansion in suitable regions.
- Market Dominance Analysis: While significant hydropower capacity already exists, further expansion is limited by geographical factors and environmental concerns.
Bioenergy:
- Key Growth Drivers: Readily available biomass resources in rural areas, potential for decentralized energy generation, and reduced reliance on grid electricity.
- Market Dominance Analysis: Its relatively smaller scale and lower efficiency compared to solar and hydropower limit its overall market share.
Other Generation Sources: This segment includes wind energy, geothermal, and potentially other emerging technologies. Its contribution to the overall market is currently minimal but has the potential for growth in the future.
Renewable Energy Market in Zimbabwe: Product Analysis
The Zimbabwean renewable energy market showcases a diverse range of products encompassing solar PV panels (monocrystalline, polycrystalline), solar water heaters, wind turbines (small-scale & large-scale), and biogas digesters. Technological advancements in solar panel efficiency, energy storage solutions (batteries), and smart grid technologies are driving product innovation and enhancing the competitive advantages of various renewable energy solutions. These advancements are crucial for improving energy access, reliability, and affordability.
Key Drivers, Barriers & Challenges in Renewable Energy Market in Zimbabwe
Key Drivers:
- Increasing electricity demand and unreliable grid infrastructure are major drivers of renewable energy adoption.
- Government initiatives such as the USD 45 Million UN SDG Fund program and the 1 GW solar IPP GIA significantly accelerate investment.
- The decreasing cost of renewable energy technologies, especially solar PV, makes it an economically viable option.
Challenges and Restraints:
- High initial capital costs for large-scale renewable energy projects remain a major barrier, particularly for smaller firms.
- Financing constraints and limited access to credit further restrict market expansion.
- Bureaucratic processes, complex regulatory frameworks, and land acquisition issues create delays and uncertainties in project implementation. This includes securing grid connection permits and navigating environmental impact assessments.
Growth Drivers in the Renewable Energy Market in Zimbabwe
The key drivers for growth include supportive government policies like the recently announced solar IPP initiative and the UN SDG Fund program, decreasing technology costs, increasing electricity demand, and a growing awareness of climate change and environmental sustainability.
Challenges Impacting Renewable Energy Market in Zimbabwe Growth
The growth of the renewable energy sector in Zimbabwe is challenged by high upfront investment costs, financing limitations, grid integration difficulties, and bureaucratic processes related to permits and approvals. The intermittent nature of some renewable energy sources, like solar and wind, also creates challenges for grid stability.
Key Players Shaping the Renewable Energy Market in Zimbabwe
- Iskraemeco Group
- Zimbabwe Power Company
- Nyangani Renewable Energy (Pvt) Ltd
- Cool Solar Africa
- Global Solar (Pvt) Ltd
Significant Renewable Energy Market in Zimbabwe Industry Milestones
December 2022: Announcement of a government implementation agreement (GIA) to expedite the commissioning of 27 solar IPP installations totaling 1 GW, representing a significant investment of approximately USD 1 Billion. This landmark agreement accelerates renewable energy deployment and stimulates significant private sector investment.
January 2022: Approval of a USD 45 Million program by the UN SDG Fund to catalyze investments in renewable energy. The program, supported by the Zimbabwean government and local partners, provides crucial funding and technical support for renewable energy projects, creating a strong impetus for market development.
Future Outlook for Renewable Energy Market in Zimbabwe
The future outlook for the Zimbabwean renewable energy market is exceptionally positive. Government support, decreasing technology costs, and increasing energy demand create a robust foundation for sustained growth. The strategic opportunities lie in scaling up solar and hydropower projects, while simultaneously exploring the potential of other renewable energy sources like bioenergy and wind power. This expansion will not only address the country's energy deficit but also contribute significantly to its sustainable development goals. The market is poised for significant expansion and investment in the coming decade.
Renewable Energy Market in Zimbabwe Segmentation
-
1. Generation Source
- 1.1. Hydropower
- 1.2. Solar
- 1.3. Bioenergy
- 1.4. Other Generation Sources
Renewable Energy Market in Zimbabwe Segmentation By Geography
-
1. North America
- 1.1. United States
- 1.2. Canada
- 1.3. Mexico
-
2. South America
- 2.1. Brazil
- 2.2. Argentina
- 2.3. Rest of South America
-
3. Europe
- 3.1. United Kingdom
- 3.2. Germany
- 3.3. France
- 3.4. Italy
- 3.5. Spain
- 3.6. Russia
- 3.7. Benelux
- 3.8. Nordics
- 3.9. Rest of Europe
-
4. Middle East & Africa
- 4.1. Turkey
- 4.2. Israel
- 4.3. GCC
- 4.4. North Africa
- 4.5. South Africa
- 4.6. Rest of Middle East & Africa
-
5. Asia Pacific
- 5.1. China
- 5.2. India
- 5.3. Japan
- 5.4. South Korea
- 5.5. ASEAN
- 5.6. Oceania
- 5.7. Rest of Asia Pacific
Renewable Energy Market in Zimbabwe REPORT HIGHLIGHTS
| Aspects | Details |
|---|---|
| Study Period | 2019-2033 |
| Base Year | 2024 |
| Estimated Year | 2025 |
| Forecast Period | 2025-2033 |
| Historical Period | 2019-2024 |
| Growth Rate | CAGR of > 3.00% from 2019-2033 |
| Segmentation |
|
Table of Contents
- 1. Introduction
- 1.1. Research Scope
- 1.2. Market Segmentation
- 1.3. Research Methodology
- 1.4. Definitions and Assumptions
- 2. Executive Summary
- 2.1. Introduction
- 3. Market Dynamics
- 3.1. Introduction
- 3.2. Market Drivers
- 3.2.1 4.; Increasing Demand for Coal Based Power Generation Sector4.; Ease of Availability of Coal for Various Sectors
- 3.2.2 Such as Transport
- 3.2.3 Residential
- 3.2.4 Commercial and Others
- 3.3. Market Restrains
- 3.3.1. 4.; Increasing Adoption of Renewable Energy
- 3.4. Market Trends
- 3.4.1. Hydropower Source to Witness Significant Growth
- 4. Market Factor Analysis
- 4.1. Porters Five Forces
- 4.2. Supply/Value Chain
- 4.3. PESTEL analysis
- 4.4. Market Entropy
- 4.5. Patent/Trademark Analysis
- 5. Global Renewable Energy Market in Zimbabwe Analysis, Insights and Forecast, 2019-2031
- 5.1. Market Analysis, Insights and Forecast - by Generation Source
- 5.1.1. Hydropower
- 5.1.2. Solar
- 5.1.3. Bioenergy
- 5.1.4. Other Generation Sources
- 5.2. Market Analysis, Insights and Forecast - by Region
- 5.2.1. North America
- 5.2.2. South America
- 5.2.3. Europe
- 5.2.4. Middle East & Africa
- 5.2.5. Asia Pacific
- 5.1. Market Analysis, Insights and Forecast - by Generation Source
- 6. North America Renewable Energy Market in Zimbabwe Analysis, Insights and Forecast, 2019-2031
- 6.1. Market Analysis, Insights and Forecast - by Generation Source
- 6.1.1. Hydropower
- 6.1.2. Solar
- 6.1.3. Bioenergy
- 6.1.4. Other Generation Sources
- 6.1. Market Analysis, Insights and Forecast - by Generation Source
- 7. South America Renewable Energy Market in Zimbabwe Analysis, Insights and Forecast, 2019-2031
- 7.1. Market Analysis, Insights and Forecast - by Generation Source
- 7.1.1. Hydropower
- 7.1.2. Solar
- 7.1.3. Bioenergy
- 7.1.4. Other Generation Sources
- 7.1. Market Analysis, Insights and Forecast - by Generation Source
- 8. Europe Renewable Energy Market in Zimbabwe Analysis, Insights and Forecast, 2019-2031
- 8.1. Market Analysis, Insights and Forecast - by Generation Source
- 8.1.1. Hydropower
- 8.1.2. Solar
- 8.1.3. Bioenergy
- 8.1.4. Other Generation Sources
- 8.1. Market Analysis, Insights and Forecast - by Generation Source
- 9. Middle East & Africa Renewable Energy Market in Zimbabwe Analysis, Insights and Forecast, 2019-2031
- 9.1. Market Analysis, Insights and Forecast - by Generation Source
- 9.1.1. Hydropower
- 9.1.2. Solar
- 9.1.3. Bioenergy
- 9.1.4. Other Generation Sources
- 9.1. Market Analysis, Insights and Forecast - by Generation Source
- 10. Asia Pacific Renewable Energy Market in Zimbabwe Analysis, Insights and Forecast, 2019-2031
- 10.1. Market Analysis, Insights and Forecast - by Generation Source
- 10.1.1. Hydropower
- 10.1.2. Solar
- 10.1.3. Bioenergy
- 10.1.4. Other Generation Sources
- 10.1. Market Analysis, Insights and Forecast - by Generation Source
- 11. Competitive Analysis
- 11.1. Global Market Share Analysis 2024
- 11.2. Company Profiles
- 11.2.1 Iskraemeco Group
- 11.2.1.1. Overview
- 11.2.1.2. Products
- 11.2.1.3. SWOT Analysis
- 11.2.1.4. Recent Developments
- 11.2.1.5. Financials (Based on Availability)
- 11.2.2 Zimbabwe Power Company
- 11.2.2.1. Overview
- 11.2.2.2. Products
- 11.2.2.3. SWOT Analysis
- 11.2.2.4. Recent Developments
- 11.2.2.5. Financials (Based on Availability)
- 11.2.3 Nyangani Renewable Energy (Pvt) Ltd
- 11.2.3.1. Overview
- 11.2.3.2. Products
- 11.2.3.3. SWOT Analysis
- 11.2.3.4. Recent Developments
- 11.2.3.5. Financials (Based on Availability)
- 11.2.4 Cool Solar Africa
- 11.2.4.1. Overview
- 11.2.4.2. Products
- 11.2.4.3. SWOT Analysis
- 11.2.4.4. Recent Developments
- 11.2.4.5. Financials (Based on Availability)
- 11.2.5 Global Solar (Pvt) Ltd
- 11.2.5.1. Overview
- 11.2.5.2. Products
- 11.2.5.3. SWOT Analysis
- 11.2.5.4. Recent Developments
- 11.2.5.5. Financials (Based on Availability)
- 11.2.1 Iskraemeco Group
List of Figures
- Figure 1: Global Renewable Energy Market in Zimbabwe Revenue Breakdown (Million, %) by Region 2024 & 2032
- Figure 2: Global Renewable Energy Market in Zimbabwe Volume Breakdown (Gigawatt, %) by Region 2024 & 2032
- Figure 3: Zimbabwe Renewable Energy Market in Zimbabwe Revenue (Million), by Country 2024 & 2032
- Figure 4: Zimbabwe Renewable Energy Market in Zimbabwe Volume (Gigawatt), by Country 2024 & 2032
- Figure 5: Zimbabwe Renewable Energy Market in Zimbabwe Revenue Share (%), by Country 2024 & 2032
- Figure 6: Zimbabwe Renewable Energy Market in Zimbabwe Volume Share (%), by Country 2024 & 2032
- Figure 7: North America Renewable Energy Market in Zimbabwe Revenue (Million), by Generation Source 2024 & 2032
- Figure 8: North America Renewable Energy Market in Zimbabwe Volume (Gigawatt), by Generation Source 2024 & 2032
- Figure 9: North America Renewable Energy Market in Zimbabwe Revenue Share (%), by Generation Source 2024 & 2032
- Figure 10: North America Renewable Energy Market in Zimbabwe Volume Share (%), by Generation Source 2024 & 2032
- Figure 11: North America Renewable Energy Market in Zimbabwe Revenue (Million), by Country 2024 & 2032
- Figure 12: North America Renewable Energy Market in Zimbabwe Volume (Gigawatt), by Country 2024 & 2032
- Figure 13: North America Renewable Energy Market in Zimbabwe Revenue Share (%), by Country 2024 & 2032
- Figure 14: North America Renewable Energy Market in Zimbabwe Volume Share (%), by Country 2024 & 2032
- Figure 15: South America Renewable Energy Market in Zimbabwe Revenue (Million), by Generation Source 2024 & 2032
- Figure 16: South America Renewable Energy Market in Zimbabwe Volume (Gigawatt), by Generation Source 2024 & 2032
- Figure 17: South America Renewable Energy Market in Zimbabwe Revenue Share (%), by Generation Source 2024 & 2032
- Figure 18: South America Renewable Energy Market in Zimbabwe Volume Share (%), by Generation Source 2024 & 2032
- Figure 19: South America Renewable Energy Market in Zimbabwe Revenue (Million), by Country 2024 & 2032
- Figure 20: South America Renewable Energy Market in Zimbabwe Volume (Gigawatt), by Country 2024 & 2032
- Figure 21: South America Renewable Energy Market in Zimbabwe Revenue Share (%), by Country 2024 & 2032
- Figure 22: South America Renewable Energy Market in Zimbabwe Volume Share (%), by Country 2024 & 2032
- Figure 23: Europe Renewable Energy Market in Zimbabwe Revenue (Million), by Generation Source 2024 & 2032
- Figure 24: Europe Renewable Energy Market in Zimbabwe Volume (Gigawatt), by Generation Source 2024 & 2032
- Figure 25: Europe Renewable Energy Market in Zimbabwe Revenue Share (%), by Generation Source 2024 & 2032
- Figure 26: Europe Renewable Energy Market in Zimbabwe Volume Share (%), by Generation Source 2024 & 2032
- Figure 27: Europe Renewable Energy Market in Zimbabwe Revenue (Million), by Country 2024 & 2032
- Figure 28: Europe Renewable Energy Market in Zimbabwe Volume (Gigawatt), by Country 2024 & 2032
- Figure 29: Europe Renewable Energy Market in Zimbabwe Revenue Share (%), by Country 2024 & 2032
- Figure 30: Europe Renewable Energy Market in Zimbabwe Volume Share (%), by Country 2024 & 2032
- Figure 31: Middle East & Africa Renewable Energy Market in Zimbabwe Revenue (Million), by Generation Source 2024 & 2032
- Figure 32: Middle East & Africa Renewable Energy Market in Zimbabwe Volume (Gigawatt), by Generation Source 2024 & 2032
- Figure 33: Middle East & Africa Renewable Energy Market in Zimbabwe Revenue Share (%), by Generation Source 2024 & 2032
- Figure 34: Middle East & Africa Renewable Energy Market in Zimbabwe Volume Share (%), by Generation Source 2024 & 2032
- Figure 35: Middle East & Africa Renewable Energy Market in Zimbabwe Revenue (Million), by Country 2024 & 2032
- Figure 36: Middle East & Africa Renewable Energy Market in Zimbabwe Volume (Gigawatt), by Country 2024 & 2032
- Figure 37: Middle East & Africa Renewable Energy Market in Zimbabwe Revenue Share (%), by Country 2024 & 2032
- Figure 38: Middle East & Africa Renewable Energy Market in Zimbabwe Volume Share (%), by Country 2024 & 2032
- Figure 39: Asia Pacific Renewable Energy Market in Zimbabwe Revenue (Million), by Generation Source 2024 & 2032
- Figure 40: Asia Pacific Renewable Energy Market in Zimbabwe Volume (Gigawatt), by Generation Source 2024 & 2032
- Figure 41: Asia Pacific Renewable Energy Market in Zimbabwe Revenue Share (%), by Generation Source 2024 & 2032
- Figure 42: Asia Pacific Renewable Energy Market in Zimbabwe Volume Share (%), by Generation Source 2024 & 2032
- Figure 43: Asia Pacific Renewable Energy Market in Zimbabwe Revenue (Million), by Country 2024 & 2032
- Figure 44: Asia Pacific Renewable Energy Market in Zimbabwe Volume (Gigawatt), by Country 2024 & 2032
- Figure 45: Asia Pacific Renewable Energy Market in Zimbabwe Revenue Share (%), by Country 2024 & 2032
- Figure 46: Asia Pacific Renewable Energy Market in Zimbabwe Volume Share (%), by Country 2024 & 2032
List of Tables
- Table 1: Global Renewable Energy Market in Zimbabwe Revenue Million Forecast, by Region 2019 & 2032
- Table 2: Global Renewable Energy Market in Zimbabwe Volume Gigawatt Forecast, by Region 2019 & 2032
- Table 3: Global Renewable Energy Market in Zimbabwe Revenue Million Forecast, by Generation Source 2019 & 2032
- Table 4: Global Renewable Energy Market in Zimbabwe Volume Gigawatt Forecast, by Generation Source 2019 & 2032
- Table 5: Global Renewable Energy Market in Zimbabwe Revenue Million Forecast, by Region 2019 & 2032
- Table 6: Global Renewable Energy Market in Zimbabwe Volume Gigawatt Forecast, by Region 2019 & 2032
- Table 7: Global Renewable Energy Market in Zimbabwe Revenue Million Forecast, by Country 2019 & 2032
- Table 8: Global Renewable Energy Market in Zimbabwe Volume Gigawatt Forecast, by Country 2019 & 2032
- Table 9: Global Renewable Energy Market in Zimbabwe Revenue Million Forecast, by Generation Source 2019 & 2032
- Table 10: Global Renewable Energy Market in Zimbabwe Volume Gigawatt Forecast, by Generation Source 2019 & 2032
- Table 11: Global Renewable Energy Market in Zimbabwe Revenue Million Forecast, by Country 2019 & 2032
- Table 12: Global Renewable Energy Market in Zimbabwe Volume Gigawatt Forecast, by Country 2019 & 2032
- Table 13: United States Renewable Energy Market in Zimbabwe Revenue (Million) Forecast, by Application 2019 & 2032
- Table 14: United States Renewable Energy Market in Zimbabwe Volume (Gigawatt) Forecast, by Application 2019 & 2032
- Table 15: Canada Renewable Energy Market in Zimbabwe Revenue (Million) Forecast, by Application 2019 & 2032
- Table 16: Canada Renewable Energy Market in Zimbabwe Volume (Gigawatt) Forecast, by Application 2019 & 2032
- Table 17: Mexico Renewable Energy Market in Zimbabwe Revenue (Million) Forecast, by Application 2019 & 2032
- Table 18: Mexico Renewable Energy Market in Zimbabwe Volume (Gigawatt) Forecast, by Application 2019 & 2032
- Table 19: Global Renewable Energy Market in Zimbabwe Revenue Million Forecast, by Generation Source 2019 & 2032
- Table 20: Global Renewable Energy Market in Zimbabwe Volume Gigawatt Forecast, by Generation Source 2019 & 2032
- Table 21: Global Renewable Energy Market in Zimbabwe Revenue Million Forecast, by Country 2019 & 2032
- Table 22: Global Renewable Energy Market in Zimbabwe Volume Gigawatt Forecast, by Country 2019 & 2032
- Table 23: Brazil Renewable Energy Market in Zimbabwe Revenue (Million) Forecast, by Application 2019 & 2032
- Table 24: Brazil Renewable Energy Market in Zimbabwe Volume (Gigawatt) Forecast, by Application 2019 & 2032
- Table 25: Argentina Renewable Energy Market in Zimbabwe Revenue (Million) Forecast, by Application 2019 & 2032
- Table 26: Argentina Renewable Energy Market in Zimbabwe Volume (Gigawatt) Forecast, by Application 2019 & 2032
- Table 27: Rest of South America Renewable Energy Market in Zimbabwe Revenue (Million) Forecast, by Application 2019 & 2032
- Table 28: Rest of South America Renewable Energy Market in Zimbabwe Volume (Gigawatt) Forecast, by Application 2019 & 2032
- Table 29: Global Renewable Energy Market in Zimbabwe Revenue Million Forecast, by Generation Source 2019 & 2032
- Table 30: Global Renewable Energy Market in Zimbabwe Volume Gigawatt Forecast, by Generation Source 2019 & 2032
- Table 31: Global Renewable Energy Market in Zimbabwe Revenue Million Forecast, by Country 2019 & 2032
- Table 32: Global Renewable Energy Market in Zimbabwe Volume Gigawatt Forecast, by Country 2019 & 2032
- Table 33: United Kingdom Renewable Energy Market in Zimbabwe Revenue (Million) Forecast, by Application 2019 & 2032
- Table 34: United Kingdom Renewable Energy Market in Zimbabwe Volume (Gigawatt) Forecast, by Application 2019 & 2032
- Table 35: Germany Renewable Energy Market in Zimbabwe Revenue (Million) Forecast, by Application 2019 & 2032
- Table 36: Germany Renewable Energy Market in Zimbabwe Volume (Gigawatt) Forecast, by Application 2019 & 2032
- Table 37: France Renewable Energy Market in Zimbabwe Revenue (Million) Forecast, by Application 2019 & 2032
- Table 38: France Renewable Energy Market in Zimbabwe Volume (Gigawatt) Forecast, by Application 2019 & 2032
- Table 39: Italy Renewable Energy Market in Zimbabwe Revenue (Million) Forecast, by Application 2019 & 2032
- Table 40: Italy Renewable Energy Market in Zimbabwe Volume (Gigawatt) Forecast, by Application 2019 & 2032
- Table 41: Spain Renewable Energy Market in Zimbabwe Revenue (Million) Forecast, by Application 2019 & 2032
- Table 42: Spain Renewable Energy Market in Zimbabwe Volume (Gigawatt) Forecast, by Application 2019 & 2032
- Table 43: Russia Renewable Energy Market in Zimbabwe Revenue (Million) Forecast, by Application 2019 & 2032
- Table 44: Russia Renewable Energy Market in Zimbabwe Volume (Gigawatt) Forecast, by Application 2019 & 2032
- Table 45: Benelux Renewable Energy Market in Zimbabwe Revenue (Million) Forecast, by Application 2019 & 2032
- Table 46: Benelux Renewable Energy Market in Zimbabwe Volume (Gigawatt) Forecast, by Application 2019 & 2032
- Table 47: Nordics Renewable Energy Market in Zimbabwe Revenue (Million) Forecast, by Application 2019 & 2032
- Table 48: Nordics Renewable Energy Market in Zimbabwe Volume (Gigawatt) Forecast, by Application 2019 & 2032
- Table 49: Rest of Europe Renewable Energy Market in Zimbabwe Revenue (Million) Forecast, by Application 2019 & 2032
- Table 50: Rest of Europe Renewable Energy Market in Zimbabwe Volume (Gigawatt) Forecast, by Application 2019 & 2032
- Table 51: Global Renewable Energy Market in Zimbabwe Revenue Million Forecast, by Generation Source 2019 & 2032
- Table 52: Global Renewable Energy Market in Zimbabwe Volume Gigawatt Forecast, by Generation Source 2019 & 2032
- Table 53: Global Renewable Energy Market in Zimbabwe Revenue Million Forecast, by Country 2019 & 2032
- Table 54: Global Renewable Energy Market in Zimbabwe Volume Gigawatt Forecast, by Country 2019 & 2032
- Table 55: Turkey Renewable Energy Market in Zimbabwe Revenue (Million) Forecast, by Application 2019 & 2032
- Table 56: Turkey Renewable Energy Market in Zimbabwe Volume (Gigawatt) Forecast, by Application 2019 & 2032
- Table 57: Israel Renewable Energy Market in Zimbabwe Revenue (Million) Forecast, by Application 2019 & 2032
- Table 58: Israel Renewable Energy Market in Zimbabwe Volume (Gigawatt) Forecast, by Application 2019 & 2032
- Table 59: GCC Renewable Energy Market in Zimbabwe Revenue (Million) Forecast, by Application 2019 & 2032
- Table 60: GCC Renewable Energy Market in Zimbabwe Volume (Gigawatt) Forecast, by Application 2019 & 2032
- Table 61: North Africa Renewable Energy Market in Zimbabwe Revenue (Million) Forecast, by Application 2019 & 2032
- Table 62: North Africa Renewable Energy Market in Zimbabwe Volume (Gigawatt) Forecast, by Application 2019 & 2032
- Table 63: South Africa Renewable Energy Market in Zimbabwe Revenue (Million) Forecast, by Application 2019 & 2032
- Table 64: South Africa Renewable Energy Market in Zimbabwe Volume (Gigawatt) Forecast, by Application 2019 & 2032
- Table 65: Rest of Middle East & Africa Renewable Energy Market in Zimbabwe Revenue (Million) Forecast, by Application 2019 & 2032
- Table 66: Rest of Middle East & Africa Renewable Energy Market in Zimbabwe Volume (Gigawatt) Forecast, by Application 2019 & 2032
- Table 67: Global Renewable Energy Market in Zimbabwe Revenue Million Forecast, by Generation Source 2019 & 2032
- Table 68: Global Renewable Energy Market in Zimbabwe Volume Gigawatt Forecast, by Generation Source 2019 & 2032
- Table 69: Global Renewable Energy Market in Zimbabwe Revenue Million Forecast, by Country 2019 & 2032
- Table 70: Global Renewable Energy Market in Zimbabwe Volume Gigawatt Forecast, by Country 2019 & 2032
- Table 71: China Renewable Energy Market in Zimbabwe Revenue (Million) Forecast, by Application 2019 & 2032
- Table 72: China Renewable Energy Market in Zimbabwe Volume (Gigawatt) Forecast, by Application 2019 & 2032
- Table 73: India Renewable Energy Market in Zimbabwe Revenue (Million) Forecast, by Application 2019 & 2032
- Table 74: India Renewable Energy Market in Zimbabwe Volume (Gigawatt) Forecast, by Application 2019 & 2032
- Table 75: Japan Renewable Energy Market in Zimbabwe Revenue (Million) Forecast, by Application 2019 & 2032
- Table 76: Japan Renewable Energy Market in Zimbabwe Volume (Gigawatt) Forecast, by Application 2019 & 2032
- Table 77: South Korea Renewable Energy Market in Zimbabwe Revenue (Million) Forecast, by Application 2019 & 2032
- Table 78: South Korea Renewable Energy Market in Zimbabwe Volume (Gigawatt) Forecast, by Application 2019 & 2032
- Table 79: ASEAN Renewable Energy Market in Zimbabwe Revenue (Million) Forecast, by Application 2019 & 2032
- Table 80: ASEAN Renewable Energy Market in Zimbabwe Volume (Gigawatt) Forecast, by Application 2019 & 2032
- Table 81: Oceania Renewable Energy Market in Zimbabwe Revenue (Million) Forecast, by Application 2019 & 2032
- Table 82: Oceania Renewable Energy Market in Zimbabwe Volume (Gigawatt) Forecast, by Application 2019 & 2032
- Table 83: Rest of Asia Pacific Renewable Energy Market in Zimbabwe Revenue (Million) Forecast, by Application 2019 & 2032
- Table 84: Rest of Asia Pacific Renewable Energy Market in Zimbabwe Volume (Gigawatt) Forecast, by Application 2019 & 2032
Frequently Asked Questions
1. What is the projected Compound Annual Growth Rate (CAGR) of the Renewable Energy Market in Zimbabwe?
The projected CAGR is approximately > 3.00%.
2. Which companies are prominent players in the Renewable Energy Market in Zimbabwe?
Key companies in the market include Iskraemeco Group, Zimbabwe Power Company, Nyangani Renewable Energy (Pvt) Ltd, Cool Solar Africa, Global Solar (Pvt) Ltd.
3. What are the main segments of the Renewable Energy Market in Zimbabwe?
The market segments include Generation Source.
4. Can you provide details about the market size?
The market size is estimated to be USD XX Million as of 2022.
5. What are some drivers contributing to market growth?
4.; Increasing Demand for Coal Based Power Generation Sector4.; Ease of Availability of Coal for Various Sectors. Such as Transport. Residential. Commercial and Others.
6. What are the notable trends driving market growth?
Hydropower Source to Witness Significant Growth.
7. Are there any restraints impacting market growth?
4.; Increasing Adoption of Renewable Energy.
8. Can you provide examples of recent developments in the market?
In December 2022, Zimbabwe announced a government implementation agreement (GIA) to expedite the commissioning of 27 solar IPP installations. The 1 GW of projects range from 5 MW arrays to 100 MW solar parks and will cost about USD 1 billion in total.
9. What pricing options are available for accessing the report?
Pricing options include single-user, multi-user, and enterprise licenses priced at USD 3800, USD 4500, and USD 5800 respectively.
10. Is the market size provided in terms of value or volume?
The market size is provided in terms of value, measured in Million and volume, measured in Gigawatt.
11. Are there any specific market keywords associated with the report?
Yes, the market keyword associated with the report is "Renewable Energy Market in Zimbabwe," which aids in identifying and referencing the specific market segment covered.
12. How do I determine which pricing option suits my needs best?
The pricing options vary based on user requirements and access needs. Individual users may opt for single-user licenses, while businesses requiring broader access may choose multi-user or enterprise licenses for cost-effective access to the report.
13. Are there any additional resources or data provided in the Renewable Energy Market in Zimbabwe report?
While the report offers comprehensive insights, it's advisable to review the specific contents or supplementary materials provided to ascertain if additional resources or data are available.
14. How can I stay updated on further developments or reports in the Renewable Energy Market in Zimbabwe?
To stay informed about further developments, trends, and reports in the Renewable Energy Market in Zimbabwe, consider subscribing to industry newsletters, following relevant companies and organizations, or regularly checking reputable industry news sources and publications.
Methodology
Step 1 - Identification of Relevant Samples Size from Population Database


Step 2 - Approaches for Defining Global Market Size (Value, Volume* & Price*)

Note*: In applicable scenarios
Step 3 - Data Sources
Primary Research
- Web Analytics
- Survey Reports
- Research Institute
- Latest Research Reports
- Opinion Leaders
Secondary Research
- Annual Reports
- White Paper
- Latest Press Release
- Industry Association
- Paid Database
- Investor Presentations

Step 4 - Data Triangulation
Involves using different sources of information in order to increase the validity of a study
These sources are likely to be stakeholders in a program - participants, other researchers, program staff, other community members, and so on.
Then we put all data in single framework & apply various statistical tools to find out the dynamic on the market.
During the analysis stage, feedback from the stakeholder groups would be compared to determine areas of agreement as well as areas of divergence
