

Key Insights
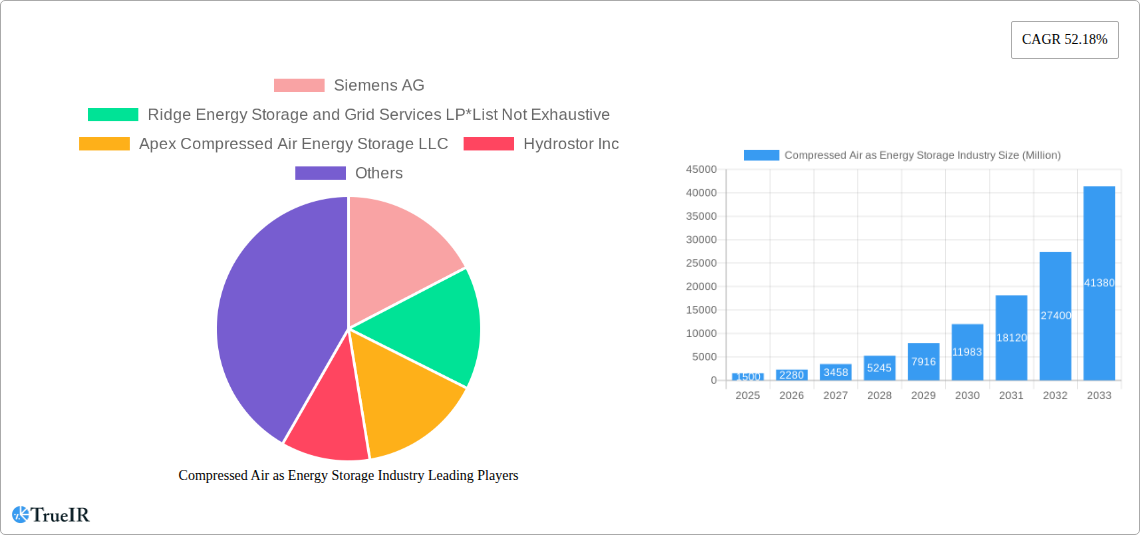
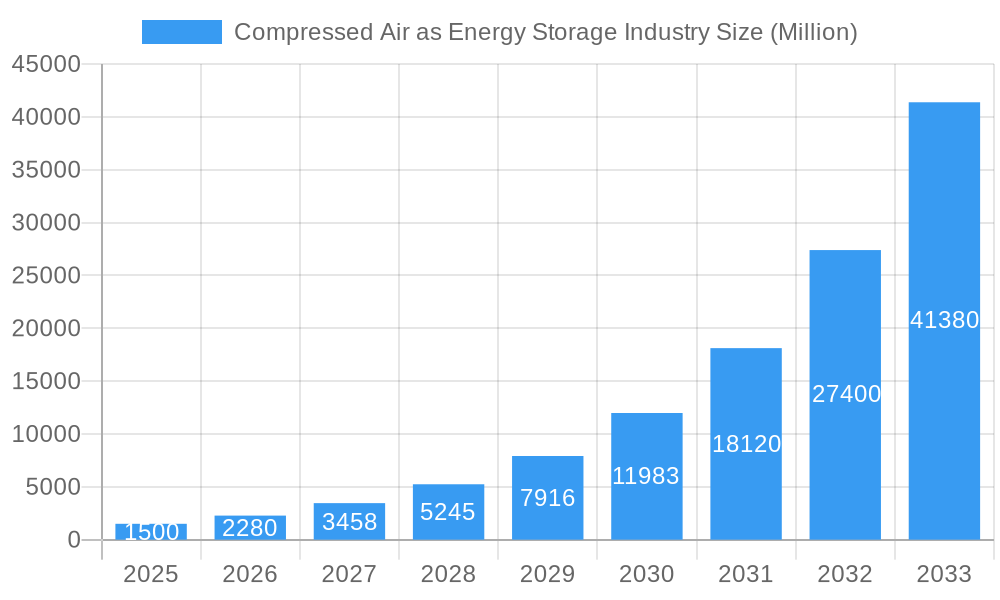
The compressed air energy storage (CAES) market is experiencing explosive growth, projected to expand significantly over the next decade. A 52.18% CAGR indicates substantial market expansion, driven primarily by the increasing need for reliable and efficient energy storage solutions to complement renewable energy sources like solar and wind power. The intermittent nature of these renewables necessitates effective storage technologies, and CAES offers a compelling solution with its potential for large-scale deployment and relatively long-duration storage capabilities. Technological advancements focusing on improved efficiency and reduced costs are further fueling market expansion. The three main segments – adiabatic, diabatic, and isothermal – each contribute to the overall growth, with advancements in adiabatic systems potentially leading to greater market share due to their higher efficiency. Key players like Siemens AG, Ridge Energy Storage, and others are actively investing in research and development, as well as expanding their market presence through strategic partnerships and acquisitions, driving competition and innovation within the sector. Geographical distribution shows a strong presence in North America and Europe, followed by Asia Pacific, indicating significant growth potential in developing economies experiencing rapid industrialization and increasing energy demands. However, the market also faces challenges, including the relatively high initial capital investment required for CAES systems and the need for further technological improvements to optimize energy efficiency and reduce operational costs. Addressing these limitations will be crucial to unlocking the full potential of CAES and ensuring its widespread adoption.
Compressed Air as Energy Storage Industry Market Size (In Billion)
The growth trajectory of the CAES market is expected to remain robust throughout the forecast period (2025-2033). Continued investment in renewable energy infrastructure will significantly influence demand for CAES. Government regulations promoting clean energy and decarbonization efforts will create favorable market conditions, while technological innovation in areas such as compressor technology and energy management systems will improve the overall efficiency and cost-effectiveness of CAES. Market segmentation will likely evolve with the emergence of new CAES technologies and applications. The competitive landscape will remain dynamic, with existing players expanding their product portfolios and new entrants entering the market, fostering innovation and driving down costs. Regional expansion will continue, particularly in regions with strong renewable energy adoption rates and supportive policy frameworks. While challenges remain, the long-term outlook for the CAES market remains highly positive, suggesting significant opportunities for growth and investment.
Compressed Air as Energy Storage Industry Company Market Share
Compressed Air Energy Storage: A Comprehensive Market Report (2019-2033)
This dynamic report provides a detailed analysis of the Compressed Air Energy Storage (CAES) industry, projecting robust growth and significant market expansion from 2025 to 2033. Leveraging extensive research and data analysis across the historical period (2019-2024), base year (2025), and estimated year (2025), this report offers invaluable insights for investors, industry professionals, and strategic decision-makers. The study period encompasses 2019-2033, with a forecast period spanning 2025-2033. Market values are expressed in Millions (USD).
Compressed Air as Energy Storage Industry Market Structure & Competitive Landscape
The Compressed Air Energy Storage (CAES) market is characterized by a moderately concentrated structure, with a few key players holding significant market share. However, the landscape is dynamic, driven by continuous innovation, evolving regulatory environments, and increasing demand for energy storage solutions. The market exhibits considerable potential for mergers and acquisitions (M&A) activity as larger players seek to expand their market presence and enhance technological capabilities.
Market Concentration: The Herfindahl-Hirschman Index (HHI) for the CAES market in 2025 is estimated at xx, suggesting a moderately concentrated market.
Innovation Drivers: Key drivers include advancements in compressor technology, the development of more efficient energy storage systems, and the integration of renewable energy sources.
Regulatory Impacts: Government policies promoting renewable energy integration and energy storage are significantly impacting market growth. Subsidies and tax incentives are driving adoption rates.
Product Substitutes: CAES faces competition from other energy storage technologies, such as pumped hydro storage, lithium-ion batteries, and flow batteries. However, CAES offers unique advantages in terms of scalability and duration of energy storage.
End-User Segmentation: The primary end-users include utilities, industrial facilities, and commercial businesses seeking reliable and cost-effective energy storage solutions.
M&A Trends: The number of M&A transactions in the CAES industry during the historical period (2019-2024) totaled approximately xx deals, with a total value of xx Million. This trend is expected to continue during the forecast period.
Compressed Air as Energy Storage Industry Market Trends & Opportunities
The CAES market is experiencing significant growth, driven by increasing demand for reliable and cost-effective energy storage solutions. The global CAES market size was valued at xx Million in 2025 and is projected to reach xx Million by 2033, exhibiting a CAGR of xx% during the forecast period. This expansion is fueled by several key factors:
- Technological advancements: Improved compressor efficiency and the development of advanced energy storage systems are driving down the cost and improving the performance of CAES technology.
- Government incentives: Government policies and regulations promoting renewable energy integration and energy storage are creating favorable conditions for market expansion.
- Rising energy demand: The increasing global demand for energy, coupled with the intermittent nature of renewable energy sources, is driving the adoption of energy storage solutions such as CAES.
- Growing environmental concerns: The growing awareness of environmental issues is leading to an increased preference for sustainable energy solutions, which is further boosting the adoption of CAES technology.
- Competitive landscape: The competitive landscape in the CAES market is becoming more dynamic, with several key players actively investing in research and development and striving to enhance their offerings.
Dominant Markets & Segments in Compressed Air as Energy Storage Industry
The North American market is currently the dominant region in the CAES industry, followed by Europe and Asia-Pacific. Within the CAES market, Adiabatic systems currently hold the largest market share, driven by their higher efficiency and lower costs compared to other technologies.
Key Growth Drivers:
- Robust renewable energy infrastructure: Extensive wind and solar power installations are driving the demand for long-duration energy storage.
- Supportive government policies: Substantial investment and incentives are accelerating the adoption of CAES technologies.
- Technological advancements: Ongoing research and development in compressor and energy storage technologies are leading to improved efficiency and cost reduction.
Market Dominance Analysis: North America's dominance is primarily due to the region's substantial investments in renewable energy infrastructure and supportive regulatory frameworks, coupled with the strong presence of key players. Adiabatic systems maintain a leading position due to their efficiency and cost-effectiveness.
Compressed Air as Energy Storage Industry Product Analysis
CAES technology encompasses various system designs, including adiabatic, isothermal, and diabatic approaches, each offering unique advantages and disadvantages in terms of efficiency, cost, and scalability. Recent product innovations focus on enhancing energy storage capacity, improving round-trip efficiency, and reducing the overall system cost. These advancements are improving the market fit of CAES by making it a more competitive option for various applications. The focus on optimizing system design and integrating advanced control systems is key for achieving superior performance and wider adoption.
Key Drivers, Barriers & Challenges in Compressed Air as Energy Storage Industry
Key Drivers: The primary drivers for the CAES market include the growing demand for grid-scale energy storage solutions to support the integration of renewable energy, advancements in compressor technology reducing costs and improving efficiency, and supportive government policies and incentives promoting energy storage technologies.
Challenges and Restraints: Significant challenges include high initial capital costs, potential site limitations, and the need for reliable and efficient air compression and expansion technologies. Supply chain constraints for specialized components could also limit expansion. Competition from alternative energy storage solutions poses a significant challenge, especially as the cost and performance of competing technologies improve. The fluctuating commodity prices of critical materials could also create uncertainty in project costs. Regulatory complexities and permitting requirements can slow down project deployment.
Growth Drivers in the Compressed Air as Energy Storage Industry Market
The growth in the CAES industry is significantly boosted by the increasing adoption of renewable energy sources like solar and wind power which necessitate effective energy storage solutions. The rising concerns about climate change are promoting green energy initiatives, further accelerating the demand for CAES. Government subsidies and tax benefits, alongside technological advancements, are lowering the costs associated with CAES systems and making them more economically viable.
Challenges Impacting Compressed Air as Energy Storage Industry Growth
High initial investment costs remain a significant barrier for wider adoption of CAES technology. The complexity of integrating CAES systems into existing grids and the need for specialized infrastructure add to the challenges. The potential environmental impact associated with compressed air storage needs careful consideration and mitigation strategies. Competition from other energy storage solutions like batteries and pumped hydro storage continues to be a challenge for market penetration.
Key Players Shaping the Compressed Air as Energy Storage Industry Market
- Siemens AG
- Ridge Energy Storage and Grid Services LP
- Apex Compressed Air Energy Storage LLC
- Hydrostor Inc
Significant Compressed Air as Energy Storage Industry Industry Milestones
- 2020: Hydrostor Inc. announces a significant CAES project deployment.
- 2021: Siemens AG launches a new line of high-efficiency compressors for CAES applications.
- 2022: Apex Compressed Air Energy Storage LLC secures funding for a large-scale CAES project.
- 2023: Significant policy changes in several countries provide favorable conditions for CAES projects.
- 2024: A major partnership between two key players leads to significant technological breakthroughs.
Future Outlook for Compressed Air as Energy Storage Industry Market
The CAES market is poised for significant growth in the coming years. Technological advancements, supportive government policies, and the growing need for reliable energy storage solutions are expected to drive market expansion. Strategic partnerships and collaborations among key players are likely to accelerate innovation and market penetration. The industry's future hinges on continued research and development, addressing cost-effectiveness issues and overcoming technical limitations. The market is expected to witness substantial growth, driven by a combination of technological advancements, favorable policies, and increasing demand for grid stability and renewable energy integration.
Compressed Air as Energy Storage Industry Segmentation
-
1. Type
- 1.1. Adiabatic
- 1.2. Diabatic
- 1.3. Isothermal
Compressed Air as Energy Storage Industry Segmentation By Geography
- 1. North America
- 2. Europe
- 3. Asia Pacific
- 4. Rest of the World
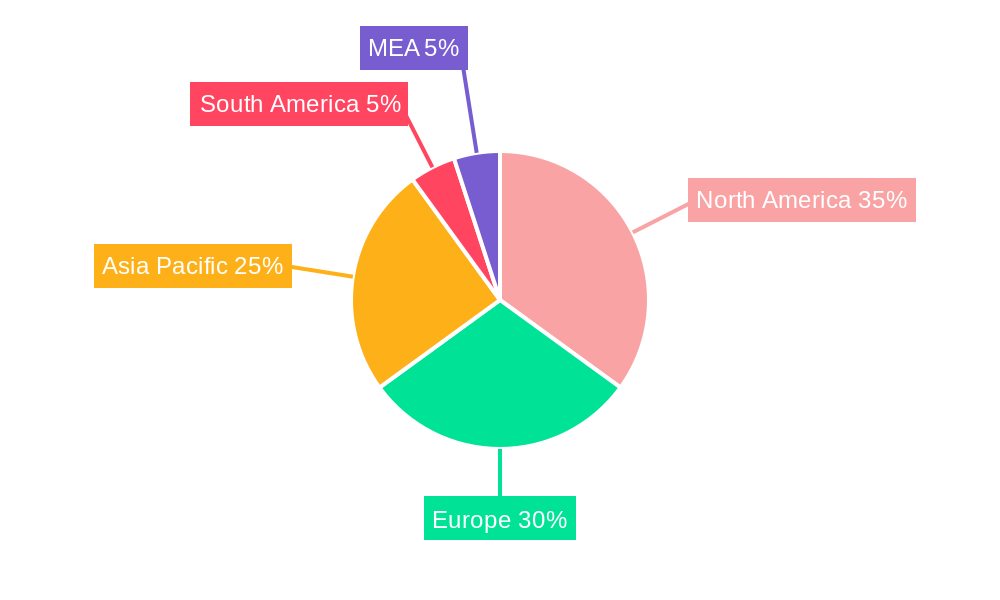
Compressed Air as Energy Storage Industry Regional Market Share
Geographic Coverage of Compressed Air as Energy Storage Industry
Compressed Air as Energy Storage Industry REPORT HIGHLIGHTS
| Aspects | Details |
|---|---|
| Study Period | 2020-2034 |
| Base Year | 2025 |
| Estimated Year | 2026 |
| Forecast Period | 2026-2034 |
| Historical Period | 2020-2025 |
| Growth Rate | CAGR of 31.4% from 2020-2034 |
| Segmentation |
|
Table of Contents
- 1. Introduction
- 1.1. Research Scope
- 1.2. Market Segmentation
- 1.3. Research Objective
- 1.4. Definitions and Assumptions
- 2. Executive Summary
- 2.1. Market Snapshot
- 3. Market Dynamics
- 3.1. Market Drivers
- 3.2. Market Restrains
- 3.3. Market Trends
- 3.4. Market Opportunities
- 4. Market Factor Analysis
- 4.1. Porters Five Forces
- 4.1.1. Bargaining Power of Suppliers
- 4.1.2. Bargaining Power of Buyers
- 4.1.3. Threat of New Entrants
- 4.1.4. Threat of Substitutes
- 4.1.5. Competitive Rivalry
- 4.2. PESTEL analysis
- 4.3. BCG Analysis
- 4.3.1. Stars (High Growth, High Market Share)
- 4.3.2. Cash Cows (Low Growth, High Market Share)
- 4.3.3. Question Mark (High Growth, Low Market Share)
- 4.3.4. Dogs (Low Growth, Low Market Share)
- 4.4. Ansoff Matrix Analysis
- 4.5. Supply Chain Analysis
- 4.6. Regulatory Landscape
- 4.7. Current Market Potential and Opportunity Assessment (TAM–SAM–SOM Framework)
- 4.8. TIR Analyst Note
- 4.1. Porters Five Forces
- 5. Market Analysis, Insights and Forecast 2021-2033
- 5.1. Market Analysis, Insights and Forecast - by Type
- 5.1.1. Adiabatic
- 5.1.2. Diabatic
- 5.1.3. Isothermal
- 5.2. Market Analysis, Insights and Forecast - by Region
- 5.2.1. North America
- 5.2.2. Europe
- 5.2.3. Asia Pacific
- 5.2.4. Rest of the World
- 5.1. Market Analysis, Insights and Forecast - by Type
- 6. Global Compressed Air as Energy Storage Industry Analysis, Insights and Forecast, 2021-2033
- 6.1. Market Analysis, Insights and Forecast - by Type
- 6.1.1. Adiabatic
- 6.1.2. Diabatic
- 6.1.3. Isothermal
- 6.1. Market Analysis, Insights and Forecast - by Type
- 7. North America Compressed Air as Energy Storage Industry Analysis, Insights and Forecast, 2020-2032
- 7.1. Market Analysis, Insights and Forecast - by Type
- 7.1.1. Adiabatic
- 7.1.2. Diabatic
- 7.1.3. Isothermal
- 7.1. Market Analysis, Insights and Forecast - by Type
- 8. Europe Compressed Air as Energy Storage Industry Analysis, Insights and Forecast, 2020-2032
- 8.1. Market Analysis, Insights and Forecast - by Type
- 8.1.1. Adiabatic
- 8.1.2. Diabatic
- 8.1.3. Isothermal
- 8.1. Market Analysis, Insights and Forecast - by Type
- 9. Asia Pacific Compressed Air as Energy Storage Industry Analysis, Insights and Forecast, 2020-2032
- 9.1. Market Analysis, Insights and Forecast - by Type
- 9.1.1. Adiabatic
- 9.1.2. Diabatic
- 9.1.3. Isothermal
- 9.1. Market Analysis, Insights and Forecast - by Type
- 10. Rest of the World Compressed Air as Energy Storage Industry Analysis, Insights and Forecast, 2020-2032
- 10.1. Market Analysis, Insights and Forecast - by Type
- 10.1.1. Adiabatic
- 10.1.2. Diabatic
- 10.1.3. Isothermal
- 10.1. Market Analysis, Insights and Forecast - by Type
- 11. Competitive Analysis
- 11.1. Company Profiles
- 11.1.1 Siemens AG
- 11.1.1.1. Company Overview
- 11.1.1.2. Products
- 11.1.1.3. Company Financials
- 11.1.1.4. SWOT Analysis
- 11.1.2 Ridge Energy Storage and Grid Services LP*List Not Exhaustive
- 11.1.2.1. Company Overview
- 11.1.2.2. Products
- 11.1.2.3. Company Financials
- 11.1.2.4. SWOT Analysis
- 11.1.3 Apex Compressed Air Energy Storage LLC
- 11.1.3.1. Company Overview
- 11.1.3.2. Products
- 11.1.3.3. Company Financials
- 11.1.3.4. SWOT Analysis
- 11.1.4 Hydrostor Inc
- 11.1.4.1. Company Overview
- 11.1.4.2. Products
- 11.1.4.3. Company Financials
- 11.1.4.4. SWOT Analysis
- 11.1.1 Siemens AG
- 11.2. Market Entropy
- 11.2.1 Company's Key Areas Served
- 11.2.2 Recent Developments
- 11.3. Company Market Share Analysis 2025
- 11.3.1 Top 5 Companies Market Share Analysis
- 11.3.2 Top 3 Companies Market Share Analysis
- 11.4. List of Potential Customers
- 12. Research Methodology
List of Figures
- Figure 1: Global Compressed Air as Energy Storage Industry Revenue Breakdown (billion, %) by Region 2025 & 2033
- Figure 2: North America Compressed Air as Energy Storage Industry Revenue (billion), by Type 2025 & 2033
- Figure 3: North America Compressed Air as Energy Storage Industry Revenue Share (%), by Type 2025 & 2033
- Figure 4: North America Compressed Air as Energy Storage Industry Revenue (billion), by Country 2025 & 2033
- Figure 5: North America Compressed Air as Energy Storage Industry Revenue Share (%), by Country 2025 & 2033
- Figure 6: Europe Compressed Air as Energy Storage Industry Revenue (billion), by Type 2025 & 2033
- Figure 7: Europe Compressed Air as Energy Storage Industry Revenue Share (%), by Type 2025 & 2033
- Figure 8: Europe Compressed Air as Energy Storage Industry Revenue (billion), by Country 2025 & 2033
- Figure 9: Europe Compressed Air as Energy Storage Industry Revenue Share (%), by Country 2025 & 2033
- Figure 10: Asia Pacific Compressed Air as Energy Storage Industry Revenue (billion), by Type 2025 & 2033
- Figure 11: Asia Pacific Compressed Air as Energy Storage Industry Revenue Share (%), by Type 2025 & 2033
- Figure 12: Asia Pacific Compressed Air as Energy Storage Industry Revenue (billion), by Country 2025 & 2033
- Figure 13: Asia Pacific Compressed Air as Energy Storage Industry Revenue Share (%), by Country 2025 & 2033
- Figure 14: Rest of the World Compressed Air as Energy Storage Industry Revenue (billion), by Type 2025 & 2033
- Figure 15: Rest of the World Compressed Air as Energy Storage Industry Revenue Share (%), by Type 2025 & 2033
- Figure 16: Rest of the World Compressed Air as Energy Storage Industry Revenue (billion), by Country 2025 & 2033
- Figure 17: Rest of the World Compressed Air as Energy Storage Industry Revenue Share (%), by Country 2025 & 2033
List of Tables
- Table 1: Global Compressed Air as Energy Storage Industry Revenue billion Forecast, by Type 2020 & 2033
- Table 2: Global Compressed Air as Energy Storage Industry Revenue billion Forecast, by Region 2020 & 2033
- Table 3: Global Compressed Air as Energy Storage Industry Revenue billion Forecast, by Type 2020 & 2033
- Table 4: Global Compressed Air as Energy Storage Industry Revenue billion Forecast, by Country 2020 & 2033
- Table 5: Global Compressed Air as Energy Storage Industry Revenue billion Forecast, by Type 2020 & 2033
- Table 6: Global Compressed Air as Energy Storage Industry Revenue billion Forecast, by Country 2020 & 2033
- Table 7: Global Compressed Air as Energy Storage Industry Revenue billion Forecast, by Type 2020 & 2033
- Table 8: Global Compressed Air as Energy Storage Industry Revenue billion Forecast, by Country 2020 & 2033
- Table 9: Global Compressed Air as Energy Storage Industry Revenue billion Forecast, by Type 2020 & 2033
- Table 10: Global Compressed Air as Energy Storage Industry Revenue billion Forecast, by Country 2020 & 2033
Frequently Asked Questions
1. What is the projected Compound Annual Growth Rate (CAGR) of the Compressed Air as Energy Storage Industry?
The projected CAGR is approximately 31.4%.
2. Which companies are prominent players in the Compressed Air as Energy Storage Industry?
Key companies in the market include Siemens AG, Ridge Energy Storage and Grid Services LP*List Not Exhaustive, Apex Compressed Air Energy Storage LLC, Hydrostor Inc.
3. What are the main segments of the Compressed Air as Energy Storage Industry?
The market segments include Type.
4. Can you provide details about the market size?
The market size is estimated to be USD 0.48 billion as of 2022.
5. What are some drivers contributing to market growth?
4.; Growing Oil and Gas Industry4.; Rapid Growth in the Industrial Sector.
6. What are the notable trends driving market growth?
Diabatic CAES Technology to Dominate the Market.
7. Are there any restraints impacting market growth?
4.; Fluctuation in Oil and Gas Prices.
8. Can you provide examples of recent developments in the market?
N/A
9. What pricing options are available for accessing the report?
Pricing options include single-user, multi-user, and enterprise licenses priced at USD 4750, USD 5250, and USD 8750 respectively.
10. Is the market size provided in terms of value or volume?
The market size is provided in terms of value, measured in billion.
11. Are there any specific market keywords associated with the report?
Yes, the market keyword associated with the report is "Compressed Air as Energy Storage Industry," which aids in identifying and referencing the specific market segment covered.
12. How do I determine which pricing option suits my needs best?
The pricing options vary based on user requirements and access needs. Individual users may opt for single-user licenses, while businesses requiring broader access may choose multi-user or enterprise licenses for cost-effective access to the report.
13. Are there any additional resources or data provided in the Compressed Air as Energy Storage Industry report?
While the report offers comprehensive insights, it's advisable to review the specific contents or supplementary materials provided to ascertain if additional resources or data are available.
14. How can I stay updated on further developments or reports in the Compressed Air as Energy Storage Industry?
To stay informed about further developments, trends, and reports in the Compressed Air as Energy Storage Industry, consider subscribing to industry newsletters, following relevant companies and organizations, or regularly checking reputable industry news sources and publications.
Methodology
Step 1 - Identification of Relevant Samples Size from Population Database


Step 2 - Approaches for Defining Global Market Size (Value, Volume* & Price*)

Note*: In applicable scenarios
Step 3 - Data Sources
Primary Research
- Web Analytics
- Survey Reports
- Research Institute
- Latest Research Reports
- Opinion Leaders
Secondary Research
- Annual Reports
- White Paper
- Latest Press Release
- Industry Association
- Paid Database
- Investor Presentations

Step 4 - Data Triangulation
Involves using different sources of information in order to increase the validity of a study
These sources are likely to be stakeholders in a program - participants, other researchers, program staff, other community members, and so on.
Then we put all data in single framework & apply various statistical tools to find out the dynamic on the market.
During the analysis stage, feedback from the stakeholder groups would be compared to determine areas of agreement as well as areas of divergence