

Key Insights
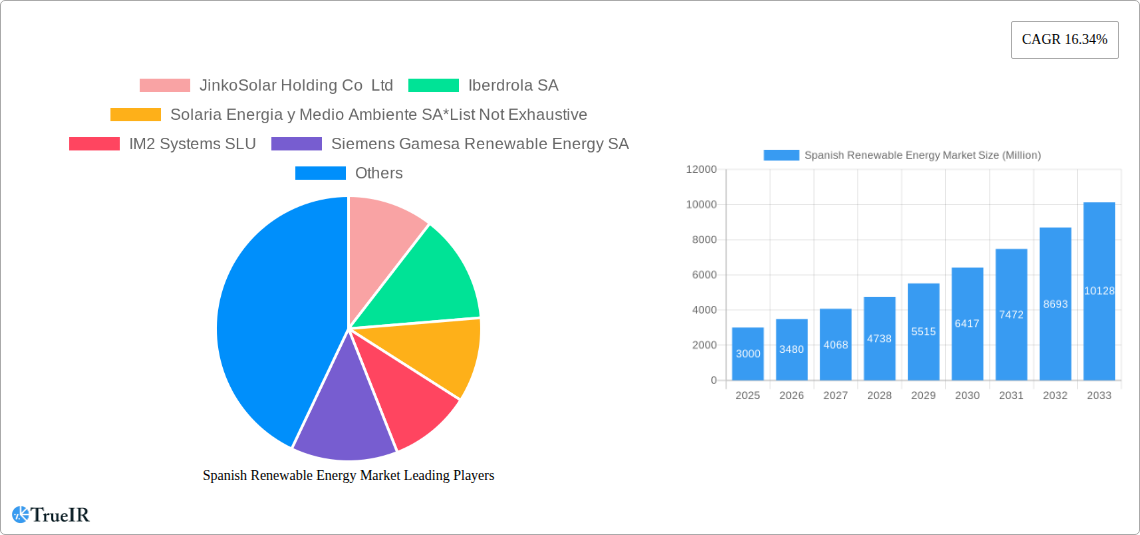
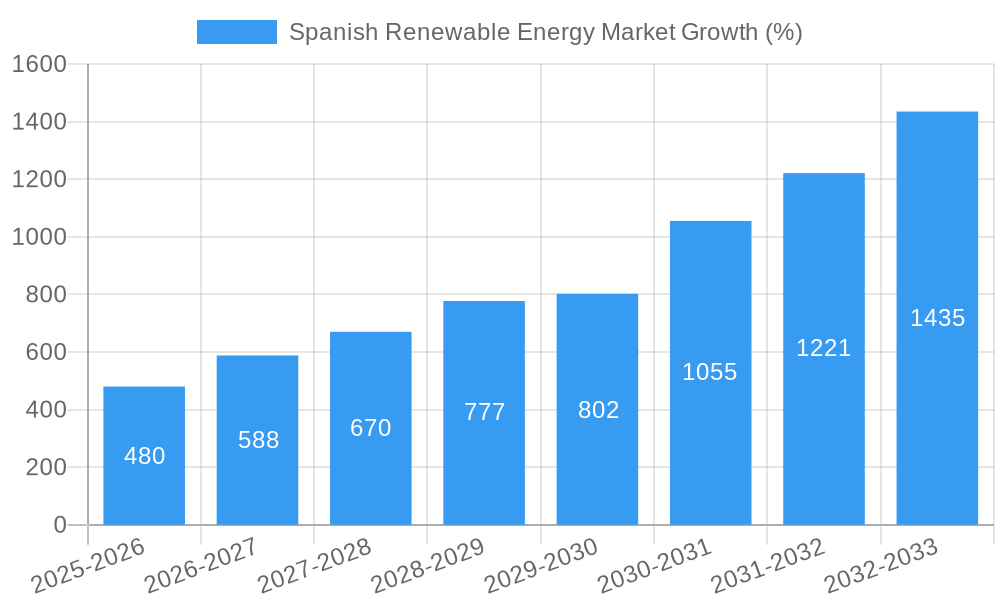
The Spanish renewable energy market, exhibiting a robust Compound Annual Growth Rate (CAGR) of 16.34%, presents a compelling investment opportunity. Driven by ambitious government targets for renewable energy integration, coupled with declining technology costs and increasing environmental awareness, the market is poised for significant expansion. Solar energy, particularly photovoltaic (PV) systems, is anticipated to dominate the technology segment, fueled by abundant sunshine and supportive policy frameworks. Wind energy will remain a significant contributor, with onshore and offshore projects expanding across diverse regions. Biomass and hydropower, while playing a supporting role, will continue to contribute to the country's renewable energy mix. The industrial sector, followed by the commercial sector, is projected to be the primary end-user, driven by energy cost reduction initiatives and corporate sustainability goals. Key players like Iberdrola, Acciona, and Siemens Gamesa Renewable Energy are actively shaping market dynamics through large-scale project developments and technological innovations. The market's growth, however, is not without challenges. Intermittency of renewable energy sources and the need for grid modernization to accommodate fluctuating power supply remain key considerations. Furthermore, securing financing for large-scale renewable energy projects and navigating regulatory complexities may present occasional hurdles. Nevertheless, the long-term outlook for the Spanish renewable energy market remains exceptionally positive, driven by a combination of technological advancements, supportive policy environments, and a growing commitment to sustainable energy solutions.
The forecast period of 2025-2033 will witness substantial growth, with the market likely exceeding €10 billion (assuming a current market size of approximately €3 billion in 2025). The residential segment, while smaller than industrial and commercial sectors, will experience growth driven by individual investments in rooftop solar and energy efficiency measures. Technological advancements, particularly in energy storage solutions, will play a critical role in addressing the intermittency challenges associated with renewable energy sources, further boosting market expansion. Continued government incentives and the growing demand for sustainable energy sources in various economic sectors will continue to foster a positive growth trajectory for the Spanish renewable energy market.
Spanish Renewable Energy Market: A Comprehensive Report (2019-2033)
This in-depth report provides a comprehensive analysis of the Spanish renewable energy market, covering the period 2019-2033, with a focus on market structure, trends, key players, and future outlook. Leveraging extensive data and expert insights, this report is an essential resource for investors, industry professionals, and policymakers seeking to understand and navigate this dynamic market. The report forecasts a robust growth trajectory, driven by supportive government policies, technological advancements, and increasing environmental awareness.
Spanish Renewable Energy Market Market Structure & Competitive Landscape
The Spanish renewable energy market exhibits a moderately concentrated structure, with several large players holding significant market share. However, the market also presents opportunities for smaller, specialized companies focused on niche technologies or geographic areas. The concentration ratio (CR4) for the sector is estimated to be around xx% in 2025, indicating a relatively competitive landscape. Innovation is a key driver, with ongoing advancements in solar PV technology, wind turbine efficiency, and energy storage solutions. Regulatory frameworks, including feed-in tariffs and renewable energy quotas, play a significant role in shaping market dynamics, while the increasing pressure for decarbonization accelerates market growth. Product substitution is limited, with renewable energy sources largely replacing fossil fuels in electricity generation. End-user segmentation encompasses industrial, commercial, and residential sectors, each with unique needs and market characteristics. M&A activity has been significant, particularly in the solar and wind sectors, consolidating market players and driving efficiency gains. The total M&A volume for the 2019-2024 period reached approximately xx Million USD, reflecting significant investment and consolidation within the Spanish renewable energy sector.
Spanish Renewable Energy Market Market Trends & Opportunities
The Spanish renewable energy market is experiencing robust growth, with a projected Compound Annual Growth Rate (CAGR) of xx% from 2025 to 2033. This expansion is fueled by several key factors: a strong government commitment to renewable energy targets, technological improvements leading to reduced costs and increased efficiency, and shifting consumer preferences towards sustainable energy solutions. The market penetration rate for renewables in electricity generation is expected to reach xx% by 2033, surpassing the national targets set by the government. This growth is not uniform across all technologies. Solar PV is experiencing particularly rapid expansion, driven by declining costs and improved efficiency, while wind energy remains a significant contributor, especially in specific geographical regions. The competitive landscape is characterized by both established players and new entrants, creating dynamic interactions and opportunities for innovation. The increased adoption of smart grids and energy storage technologies further supports market growth and efficiency. The market's resilience to external factors, such as volatility in fossil fuel prices, makes the investment in renewable energy particularly attractive and promising.
Dominant Markets & Segments in Spanish Renewable Energy Market
Leading Technology: Solar energy consistently dominates the Spanish renewable energy market, experiencing the highest growth rate among renewable energy technologies. This can be attributed to its declining costs, advancements in efficiency, and ease of implementation, especially in distributed generation systems.
Leading End-User: The industrial sector accounts for the largest share of renewable energy consumption in Spain, driven by the increasing need to reduce carbon footprints and comply with stricter environmental regulations. However, the residential sector is also showing promising growth, driven by government incentives and decreasing technology costs.
Key Growth Drivers:
- Supportive Government Policies: Spain has implemented various policies, including feed-in tariffs and renewable energy targets, designed to encourage the adoption of renewable energy technologies. Significant funding for research and development further boosts the sector.
- Declining Technology Costs: The cost of renewable energy technologies, particularly solar PV, has decreased significantly in recent years, making them increasingly competitive with conventional energy sources.
- Abundant Renewable Resources: Spain enjoys abundant solar and wind resources, providing a solid foundation for large-scale renewable energy projects.
- Infrastructure Development: The expansion of electricity grids and other infrastructure facilitates the integration of renewable energy sources into the national energy system.
Spanish Renewable Energy Market Product Analysis
Significant product innovations are driving the Spanish renewable energy market. Advances in solar PV technology, such as the development of more efficient photovoltaic cells and improved energy storage solutions, are enhancing system performance and reducing costs. Similarly, advancements in wind turbine technology are increasing energy capture and reducing environmental impact. These technological improvements are enhancing the market fit of renewable energy products by enabling increased efficiency, affordability, and reliability. The competitive advantages lie in factors such as technological leadership, cost-effectiveness, and long-term operational efficiency.
Key Drivers, Barriers & Challenges in Spanish Renewable Energy Market
Key Drivers:
- Strong government support through financial incentives and regulatory frameworks.
- Falling technology costs making renewable energy increasingly cost-competitive.
- Growing awareness and acceptance of renewable energy by consumers and businesses.
- Spain's favorable climate conditions for solar and wind power generation.
Challenges:
- Intermittency of renewable energy sources requiring robust grid infrastructure upgrades and energy storage solutions. This adds to the upfront costs which can present a barrier to market entry.
- Potential land use conflicts and permitting processes can slow the development of large-scale projects. These can cause delays and increase costs in the range of xx Million USD annually.
- Fluctuations in raw material prices and supply chain disruptions can impact project timelines and costs.
Growth Drivers in the Spanish Renewable Energy Market Market
The Spanish renewable energy market is propelled by governmental policies incentivizing renewable energy adoption, technological advancements leading to cost reductions and improved efficiency, and a growing public awareness regarding environmental concerns. These factors, coupled with Spain's favorable geographic conditions for solar and wind power, drive significant market growth.
Challenges Impacting Spanish Renewable Energy Market Growth
Challenges include the intermittency of renewable sources, requiring investment in grid modernization and energy storage. Regulatory hurdles and bureaucratic processes can create delays in project development. Supply chain vulnerabilities and price volatility for raw materials pose additional obstacles to consistent market expansion.
Key Players Shaping the Spanish Renewable Energy Market Market
- JinkoSolar Holding Co Ltd
- Iberdrola SA
- Solaria Energia y Medio Ambiente SA
- IM2 Systems SLU
- Siemens Gamesa Renewable Energy SA
- Tudela Solar SL
- Red Electrica Corporacion SA
- Cobra Group
- Acciona SA
- Saclima Solar Fotovoltaica SL
Significant Spanish Renewable Energy Market Industry Milestones
August 2022: Iberdrola commissioned Europe's largest solar plant (590 MW), representing an investment exceeding USD 323 Million. This landmark project significantly boosted the country's solar power capacity and demonstrated the feasibility of large-scale renewable energy deployment.
October 2022: MITECO awarded 146 MW of biomass and 31 MW of distributed solar PV capacity under the third renewable energy auction (520 MW total). This demonstrates ongoing government commitment to renewable energy targets and diversification across technologies.
Future Outlook for Spanish Renewable Energy Market Market
The Spanish renewable energy market is poised for continued robust growth, fueled by supportive government policies, technological innovation, and increasing investor interest. Strategic opportunities exist in large-scale renewable energy projects, smart grid technologies, and energy storage solutions. The market's potential for growth is considerable, making it an attractive sector for both established players and new entrants.
Spanish Renewable Energy Market Segmentation
- 1. Hydro
- 2. Wind
- 3. Solar
- 4. Other Technologies
Spanish Renewable Energy Market Segmentation By Geography
-
1. North America
- 1.1. United States
- 1.2. Canada
- 1.3. Mexico
-
2. South America
- 2.1. Brazil
- 2.2. Argentina
- 2.3. Rest of South America
-
3. Europe
- 3.1. United Kingdom
- 3.2. Germany
- 3.3. France
- 3.4. Italy
- 3.5. Spain
- 3.6. Russia
- 3.7. Benelux
- 3.8. Nordics
- 3.9. Rest of Europe
-
4. Middle East & Africa
- 4.1. Turkey
- 4.2. Israel
- 4.3. GCC
- 4.4. North Africa
- 4.5. South Africa
- 4.6. Rest of Middle East & Africa
-
5. Asia Pacific
- 5.1. China
- 5.2. India
- 5.3. Japan
- 5.4. South Korea
- 5.5. ASEAN
- 5.6. Oceania
- 5.7. Rest of Asia Pacific
Spanish Renewable Energy Market REPORT HIGHLIGHTS
| Aspects | Details |
|---|---|
| Study Period | 2019-2033 |
| Base Year | 2024 |
| Estimated Year | 2025 |
| Forecast Period | 2025-2033 |
| Historical Period | 2019-2024 |
| Growth Rate | CAGR of 16.34% from 2019-2033 |
| Segmentation |
|
Table of Contents
- 1. Introduction
- 1.1. Research Scope
- 1.2. Market Segmentation
- 1.3. Research Methodology
- 1.4. Definitions and Assumptions
- 2. Executive Summary
- 2.1. Introduction
- 3. Market Dynamics
- 3.1. Introduction
- 3.2. Market Drivers
- 3.2.1. 4.; Increasing Adoption Of Solar And Wind Energy4.; Supportive Government Policies And Ambitious Targets
- 3.3. Market Restrains
- 3.3.1. 4.; Integrating Renewables into the Main Electricity Grid
- 3.4. Market Trends
- 3.4.1. Wind Technology is Expected to Dominate the Market
- 4. Market Factor Analysis
- 4.1. Porters Five Forces
- 4.2. Supply/Value Chain
- 4.3. PESTEL analysis
- 4.4. Market Entropy
- 4.5. Patent/Trademark Analysis
- 5. Global Spanish Renewable Energy Market Analysis, Insights and Forecast, 2019-2031
- 5.1. Market Analysis, Insights and Forecast - by Hydro
- 5.2. Market Analysis, Insights and Forecast - by Wind
- 5.3. Market Analysis, Insights and Forecast - by Solar
- 5.4. Market Analysis, Insights and Forecast - by Other Technologies
- 5.5. Market Analysis, Insights and Forecast - by Region
- 5.5.1. North America
- 5.5.2. South America
- 5.5.3. Europe
- 5.5.4. Middle East & Africa
- 5.5.5. Asia Pacific
- 5.1. Market Analysis, Insights and Forecast - by Hydro
- 6. North America Spanish Renewable Energy Market Analysis, Insights and Forecast, 2019-2031
- 6.1. Market Analysis, Insights and Forecast - by Hydro
- 6.2. Market Analysis, Insights and Forecast - by Wind
- 6.3. Market Analysis, Insights and Forecast - by Solar
- 6.4. Market Analysis, Insights and Forecast - by Other Technologies
- 6.1. Market Analysis, Insights and Forecast - by Hydro
- 7. South America Spanish Renewable Energy Market Analysis, Insights and Forecast, 2019-2031
- 7.1. Market Analysis, Insights and Forecast - by Hydro
- 7.2. Market Analysis, Insights and Forecast - by Wind
- 7.3. Market Analysis, Insights and Forecast - by Solar
- 7.4. Market Analysis, Insights and Forecast - by Other Technologies
- 7.1. Market Analysis, Insights and Forecast - by Hydro
- 8. Europe Spanish Renewable Energy Market Analysis, Insights and Forecast, 2019-2031
- 8.1. Market Analysis, Insights and Forecast - by Hydro
- 8.2. Market Analysis, Insights and Forecast - by Wind
- 8.3. Market Analysis, Insights and Forecast - by Solar
- 8.4. Market Analysis, Insights and Forecast - by Other Technologies
- 8.1. Market Analysis, Insights and Forecast - by Hydro
- 9. Middle East & Africa Spanish Renewable Energy Market Analysis, Insights and Forecast, 2019-2031
- 9.1. Market Analysis, Insights and Forecast - by Hydro
- 9.2. Market Analysis, Insights and Forecast - by Wind
- 9.3. Market Analysis, Insights and Forecast - by Solar
- 9.4. Market Analysis, Insights and Forecast - by Other Technologies
- 9.1. Market Analysis, Insights and Forecast - by Hydro
- 10. Asia Pacific Spanish Renewable Energy Market Analysis, Insights and Forecast, 2019-2031
- 10.1. Market Analysis, Insights and Forecast - by Hydro
- 10.2. Market Analysis, Insights and Forecast - by Wind
- 10.3. Market Analysis, Insights and Forecast - by Solar
- 10.4. Market Analysis, Insights and Forecast - by Other Technologies
- 10.1. Market Analysis, Insights and Forecast - by Hydro
- 11. United States Spanish Renewable Energy Market Analysis, Insights and Forecast, 2019-2031
- 11.1. Market Analysis, Insights and Forecast - By Country/Sub-region
- 11.1.1.
- 12. Canada Spanish Renewable Energy Market Analysis, Insights and Forecast, 2019-2031
- 12.1. Market Analysis, Insights and Forecast - By Country/Sub-region
- 12.1.1.
- 13. Rest Of North America Spanish Renewable Energy Market Analysis, Insights and Forecast, 2019-2031
- 13.1. Market Analysis, Insights and Forecast - By Country/Sub-region
- 13.1.1.
- 14. Competitive Analysis
- 14.1. Global Market Share Analysis 2024
- 14.2. Company Profiles
- 14.2.1 JinkoSolar Holding Co Ltd
- 14.2.1.1. Overview
- 14.2.1.2. Products
- 14.2.1.3. SWOT Analysis
- 14.2.1.4. Recent Developments
- 14.2.1.5. Financials (Based on Availability)
- 14.2.2 Iberdrola SA
- 14.2.2.1. Overview
- 14.2.2.2. Products
- 14.2.2.3. SWOT Analysis
- 14.2.2.4. Recent Developments
- 14.2.2.5. Financials (Based on Availability)
- 14.2.3 Solaria Energia y Medio Ambiente SA*List Not Exhaustive
- 14.2.3.1. Overview
- 14.2.3.2. Products
- 14.2.3.3. SWOT Analysis
- 14.2.3.4. Recent Developments
- 14.2.3.5. Financials (Based on Availability)
- 14.2.4 IM2 Systems SLU
- 14.2.4.1. Overview
- 14.2.4.2. Products
- 14.2.4.3. SWOT Analysis
- 14.2.4.4. Recent Developments
- 14.2.4.5. Financials (Based on Availability)
- 14.2.5 Siemens Gamesa Renewable Energy SA
- 14.2.5.1. Overview
- 14.2.5.2. Products
- 14.2.5.3. SWOT Analysis
- 14.2.5.4. Recent Developments
- 14.2.5.5. Financials (Based on Availability)
- 14.2.6 Tudela Solar SL
- 14.2.6.1. Overview
- 14.2.6.2. Products
- 14.2.6.3. SWOT Analysis
- 14.2.6.4. Recent Developments
- 14.2.6.5. Financials (Based on Availability)
- 14.2.7 Red Electrica Corporacion SA
- 14.2.7.1. Overview
- 14.2.7.2. Products
- 14.2.7.3. SWOT Analysis
- 14.2.7.4. Recent Developments
- 14.2.7.5. Financials (Based on Availability)
- 14.2.8 Cobra Group
- 14.2.8.1. Overview
- 14.2.8.2. Products
- 14.2.8.3. SWOT Analysis
- 14.2.8.4. Recent Developments
- 14.2.8.5. Financials (Based on Availability)
- 14.2.9 Acciona SA
- 14.2.9.1. Overview
- 14.2.9.2. Products
- 14.2.9.3. SWOT Analysis
- 14.2.9.4. Recent Developments
- 14.2.9.5. Financials (Based on Availability)
- 14.2.10 Saclima Solar Fotovoltaica SL
- 14.2.10.1. Overview
- 14.2.10.2. Products
- 14.2.10.3. SWOT Analysis
- 14.2.10.4. Recent Developments
- 14.2.10.5. Financials (Based on Availability)
- 14.2.1 JinkoSolar Holding Co Ltd
List of Figures
- Figure 1: Global Spanish Renewable Energy Market Revenue Breakdown (Million, %) by Region 2024 & 2032
- Figure 2: Global Spanish Renewable Energy Market Volume Breakdown (gigawatt, %) by Region 2024 & 2032
- Figure 3: United States Spanish Renewable Energy Market Revenue (Million), by Country 2024 & 2032
- Figure 4: United States Spanish Renewable Energy Market Volume (gigawatt), by Country 2024 & 2032
- Figure 5: United States Spanish Renewable Energy Market Revenue Share (%), by Country 2024 & 2032
- Figure 6: United States Spanish Renewable Energy Market Volume Share (%), by Country 2024 & 2032
- Figure 7: Canada Spanish Renewable Energy Market Revenue (Million), by Country 2024 & 2032
- Figure 8: Canada Spanish Renewable Energy Market Volume (gigawatt), by Country 2024 & 2032
- Figure 9: Canada Spanish Renewable Energy Market Revenue Share (%), by Country 2024 & 2032
- Figure 10: Canada Spanish Renewable Energy Market Volume Share (%), by Country 2024 & 2032
- Figure 11: Rest Of North America Spanish Renewable Energy Market Revenue (Million), by Country 2024 & 2032
- Figure 12: Rest Of North America Spanish Renewable Energy Market Volume (gigawatt), by Country 2024 & 2032
- Figure 13: Rest Of North America Spanish Renewable Energy Market Revenue Share (%), by Country 2024 & 2032
- Figure 14: Rest Of North America Spanish Renewable Energy Market Volume Share (%), by Country 2024 & 2032
- Figure 15: North America Spanish Renewable Energy Market Revenue (Million), by Hydro 2024 & 2032
- Figure 16: North America Spanish Renewable Energy Market Volume (gigawatt), by Hydro 2024 & 2032
- Figure 17: North America Spanish Renewable Energy Market Revenue Share (%), by Hydro 2024 & 2032
- Figure 18: North America Spanish Renewable Energy Market Volume Share (%), by Hydro 2024 & 2032
- Figure 19: North America Spanish Renewable Energy Market Revenue (Million), by Wind 2024 & 2032
- Figure 20: North America Spanish Renewable Energy Market Volume (gigawatt), by Wind 2024 & 2032
- Figure 21: North America Spanish Renewable Energy Market Revenue Share (%), by Wind 2024 & 2032
- Figure 22: North America Spanish Renewable Energy Market Volume Share (%), by Wind 2024 & 2032
- Figure 23: North America Spanish Renewable Energy Market Revenue (Million), by Solar 2024 & 2032
- Figure 24: North America Spanish Renewable Energy Market Volume (gigawatt), by Solar 2024 & 2032
- Figure 25: North America Spanish Renewable Energy Market Revenue Share (%), by Solar 2024 & 2032
- Figure 26: North America Spanish Renewable Energy Market Volume Share (%), by Solar 2024 & 2032
- Figure 27: North America Spanish Renewable Energy Market Revenue (Million), by Other Technologies 2024 & 2032
- Figure 28: North America Spanish Renewable Energy Market Volume (gigawatt), by Other Technologies 2024 & 2032
- Figure 29: North America Spanish Renewable Energy Market Revenue Share (%), by Other Technologies 2024 & 2032
- Figure 30: North America Spanish Renewable Energy Market Volume Share (%), by Other Technologies 2024 & 2032
- Figure 31: North America Spanish Renewable Energy Market Revenue (Million), by Country 2024 & 2032
- Figure 32: North America Spanish Renewable Energy Market Volume (gigawatt), by Country 2024 & 2032
- Figure 33: North America Spanish Renewable Energy Market Revenue Share (%), by Country 2024 & 2032
- Figure 34: North America Spanish Renewable Energy Market Volume Share (%), by Country 2024 & 2032
- Figure 35: South America Spanish Renewable Energy Market Revenue (Million), by Hydro 2024 & 2032
- Figure 36: South America Spanish Renewable Energy Market Volume (gigawatt), by Hydro 2024 & 2032
- Figure 37: South America Spanish Renewable Energy Market Revenue Share (%), by Hydro 2024 & 2032
- Figure 38: South America Spanish Renewable Energy Market Volume Share (%), by Hydro 2024 & 2032
- Figure 39: South America Spanish Renewable Energy Market Revenue (Million), by Wind 2024 & 2032
- Figure 40: South America Spanish Renewable Energy Market Volume (gigawatt), by Wind 2024 & 2032
- Figure 41: South America Spanish Renewable Energy Market Revenue Share (%), by Wind 2024 & 2032
- Figure 42: South America Spanish Renewable Energy Market Volume Share (%), by Wind 2024 & 2032
- Figure 43: South America Spanish Renewable Energy Market Revenue (Million), by Solar 2024 & 2032
- Figure 44: South America Spanish Renewable Energy Market Volume (gigawatt), by Solar 2024 & 2032
- Figure 45: South America Spanish Renewable Energy Market Revenue Share (%), by Solar 2024 & 2032
- Figure 46: South America Spanish Renewable Energy Market Volume Share (%), by Solar 2024 & 2032
- Figure 47: South America Spanish Renewable Energy Market Revenue (Million), by Other Technologies 2024 & 2032
- Figure 48: South America Spanish Renewable Energy Market Volume (gigawatt), by Other Technologies 2024 & 2032
- Figure 49: South America Spanish Renewable Energy Market Revenue Share (%), by Other Technologies 2024 & 2032
- Figure 50: South America Spanish Renewable Energy Market Volume Share (%), by Other Technologies 2024 & 2032
- Figure 51: South America Spanish Renewable Energy Market Revenue (Million), by Country 2024 & 2032
- Figure 52: South America Spanish Renewable Energy Market Volume (gigawatt), by Country 2024 & 2032
- Figure 53: South America Spanish Renewable Energy Market Revenue Share (%), by Country 2024 & 2032
- Figure 54: South America Spanish Renewable Energy Market Volume Share (%), by Country 2024 & 2032
- Figure 55: Europe Spanish Renewable Energy Market Revenue (Million), by Hydro 2024 & 2032
- Figure 56: Europe Spanish Renewable Energy Market Volume (gigawatt), by Hydro 2024 & 2032
- Figure 57: Europe Spanish Renewable Energy Market Revenue Share (%), by Hydro 2024 & 2032
- Figure 58: Europe Spanish Renewable Energy Market Volume Share (%), by Hydro 2024 & 2032
- Figure 59: Europe Spanish Renewable Energy Market Revenue (Million), by Wind 2024 & 2032
- Figure 60: Europe Spanish Renewable Energy Market Volume (gigawatt), by Wind 2024 & 2032
- Figure 61: Europe Spanish Renewable Energy Market Revenue Share (%), by Wind 2024 & 2032
- Figure 62: Europe Spanish Renewable Energy Market Volume Share (%), by Wind 2024 & 2032
- Figure 63: Europe Spanish Renewable Energy Market Revenue (Million), by Solar 2024 & 2032
- Figure 64: Europe Spanish Renewable Energy Market Volume (gigawatt), by Solar 2024 & 2032
- Figure 65: Europe Spanish Renewable Energy Market Revenue Share (%), by Solar 2024 & 2032
- Figure 66: Europe Spanish Renewable Energy Market Volume Share (%), by Solar 2024 & 2032
- Figure 67: Europe Spanish Renewable Energy Market Revenue (Million), by Other Technologies 2024 & 2032
- Figure 68: Europe Spanish Renewable Energy Market Volume (gigawatt), by Other Technologies 2024 & 2032
- Figure 69: Europe Spanish Renewable Energy Market Revenue Share (%), by Other Technologies 2024 & 2032
- Figure 70: Europe Spanish Renewable Energy Market Volume Share (%), by Other Technologies 2024 & 2032
- Figure 71: Europe Spanish Renewable Energy Market Revenue (Million), by Country 2024 & 2032
- Figure 72: Europe Spanish Renewable Energy Market Volume (gigawatt), by Country 2024 & 2032
- Figure 73: Europe Spanish Renewable Energy Market Revenue Share (%), by Country 2024 & 2032
- Figure 74: Europe Spanish Renewable Energy Market Volume Share (%), by Country 2024 & 2032
- Figure 75: Middle East & Africa Spanish Renewable Energy Market Revenue (Million), by Hydro 2024 & 2032
- Figure 76: Middle East & Africa Spanish Renewable Energy Market Volume (gigawatt), by Hydro 2024 & 2032
- Figure 77: Middle East & Africa Spanish Renewable Energy Market Revenue Share (%), by Hydro 2024 & 2032
- Figure 78: Middle East & Africa Spanish Renewable Energy Market Volume Share (%), by Hydro 2024 & 2032
- Figure 79: Middle East & Africa Spanish Renewable Energy Market Revenue (Million), by Wind 2024 & 2032
- Figure 80: Middle East & Africa Spanish Renewable Energy Market Volume (gigawatt), by Wind 2024 & 2032
- Figure 81: Middle East & Africa Spanish Renewable Energy Market Revenue Share (%), by Wind 2024 & 2032
- Figure 82: Middle East & Africa Spanish Renewable Energy Market Volume Share (%), by Wind 2024 & 2032
- Figure 83: Middle East & Africa Spanish Renewable Energy Market Revenue (Million), by Solar 2024 & 2032
- Figure 84: Middle East & Africa Spanish Renewable Energy Market Volume (gigawatt), by Solar 2024 & 2032
- Figure 85: Middle East & Africa Spanish Renewable Energy Market Revenue Share (%), by Solar 2024 & 2032
- Figure 86: Middle East & Africa Spanish Renewable Energy Market Volume Share (%), by Solar 2024 & 2032
- Figure 87: Middle East & Africa Spanish Renewable Energy Market Revenue (Million), by Other Technologies 2024 & 2032
- Figure 88: Middle East & Africa Spanish Renewable Energy Market Volume (gigawatt), by Other Technologies 2024 & 2032
- Figure 89: Middle East & Africa Spanish Renewable Energy Market Revenue Share (%), by Other Technologies 2024 & 2032
- Figure 90: Middle East & Africa Spanish Renewable Energy Market Volume Share (%), by Other Technologies 2024 & 2032
- Figure 91: Middle East & Africa Spanish Renewable Energy Market Revenue (Million), by Country 2024 & 2032
- Figure 92: Middle East & Africa Spanish Renewable Energy Market Volume (gigawatt), by Country 2024 & 2032
- Figure 93: Middle East & Africa Spanish Renewable Energy Market Revenue Share (%), by Country 2024 & 2032
- Figure 94: Middle East & Africa Spanish Renewable Energy Market Volume Share (%), by Country 2024 & 2032
- Figure 95: Asia Pacific Spanish Renewable Energy Market Revenue (Million), by Hydro 2024 & 2032
- Figure 96: Asia Pacific Spanish Renewable Energy Market Volume (gigawatt), by Hydro 2024 & 2032
- Figure 97: Asia Pacific Spanish Renewable Energy Market Revenue Share (%), by Hydro 2024 & 2032
- Figure 98: Asia Pacific Spanish Renewable Energy Market Volume Share (%), by Hydro 2024 & 2032
- Figure 99: Asia Pacific Spanish Renewable Energy Market Revenue (Million), by Wind 2024 & 2032
- Figure 100: Asia Pacific Spanish Renewable Energy Market Volume (gigawatt), by Wind 2024 & 2032
- Figure 101: Asia Pacific Spanish Renewable Energy Market Revenue Share (%), by Wind 2024 & 2032
- Figure 102: Asia Pacific Spanish Renewable Energy Market Volume Share (%), by Wind 2024 & 2032
- Figure 103: Asia Pacific Spanish Renewable Energy Market Revenue (Million), by Solar 2024 & 2032
- Figure 104: Asia Pacific Spanish Renewable Energy Market Volume (gigawatt), by Solar 2024 & 2032
- Figure 105: Asia Pacific Spanish Renewable Energy Market Revenue Share (%), by Solar 2024 & 2032
- Figure 106: Asia Pacific Spanish Renewable Energy Market Volume Share (%), by Solar 2024 & 2032
- Figure 107: Asia Pacific Spanish Renewable Energy Market Revenue (Million), by Other Technologies 2024 & 2032
- Figure 108: Asia Pacific Spanish Renewable Energy Market Volume (gigawatt), by Other Technologies 2024 & 2032
- Figure 109: Asia Pacific Spanish Renewable Energy Market Revenue Share (%), by Other Technologies 2024 & 2032
- Figure 110: Asia Pacific Spanish Renewable Energy Market Volume Share (%), by Other Technologies 2024 & 2032
- Figure 111: Asia Pacific Spanish Renewable Energy Market Revenue (Million), by Country 2024 & 2032
- Figure 112: Asia Pacific Spanish Renewable Energy Market Volume (gigawatt), by Country 2024 & 2032
- Figure 113: Asia Pacific Spanish Renewable Energy Market Revenue Share (%), by Country 2024 & 2032
- Figure 114: Asia Pacific Spanish Renewable Energy Market Volume Share (%), by Country 2024 & 2032
List of Tables
- Table 1: Global Spanish Renewable Energy Market Revenue Million Forecast, by Region 2019 & 2032
- Table 2: Global Spanish Renewable Energy Market Volume gigawatt Forecast, by Region 2019 & 2032
- Table 3: Global Spanish Renewable Energy Market Revenue Million Forecast, by Hydro 2019 & 2032
- Table 4: Global Spanish Renewable Energy Market Volume gigawatt Forecast, by Hydro 2019 & 2032
- Table 5: Global Spanish Renewable Energy Market Revenue Million Forecast, by Wind 2019 & 2032
- Table 6: Global Spanish Renewable Energy Market Volume gigawatt Forecast, by Wind 2019 & 2032
- Table 7: Global Spanish Renewable Energy Market Revenue Million Forecast, by Solar 2019 & 2032
- Table 8: Global Spanish Renewable Energy Market Volume gigawatt Forecast, by Solar 2019 & 2032
- Table 9: Global Spanish Renewable Energy Market Revenue Million Forecast, by Other Technologies 2019 & 2032
- Table 10: Global Spanish Renewable Energy Market Volume gigawatt Forecast, by Other Technologies 2019 & 2032
- Table 11: Global Spanish Renewable Energy Market Revenue Million Forecast, by Region 2019 & 2032
- Table 12: Global Spanish Renewable Energy Market Volume gigawatt Forecast, by Region 2019 & 2032
- Table 13: Global Spanish Renewable Energy Market Revenue Million Forecast, by Country 2019 & 2032
- Table 14: Global Spanish Renewable Energy Market Volume gigawatt Forecast, by Country 2019 & 2032
- Table 15: Spanish Renewable Energy Market Revenue (Million) Forecast, by Application 2019 & 2032
- Table 16: Spanish Renewable Energy Market Volume (gigawatt) Forecast, by Application 2019 & 2032
- Table 17: Global Spanish Renewable Energy Market Revenue Million Forecast, by Country 2019 & 2032
- Table 18: Global Spanish Renewable Energy Market Volume gigawatt Forecast, by Country 2019 & 2032
- Table 19: Spanish Renewable Energy Market Revenue (Million) Forecast, by Application 2019 & 2032
- Table 20: Spanish Renewable Energy Market Volume (gigawatt) Forecast, by Application 2019 & 2032
- Table 21: Global Spanish Renewable Energy Market Revenue Million Forecast, by Country 2019 & 2032
- Table 22: Global Spanish Renewable Energy Market Volume gigawatt Forecast, by Country 2019 & 2032
- Table 23: Spanish Renewable Energy Market Revenue (Million) Forecast, by Application 2019 & 2032
- Table 24: Spanish Renewable Energy Market Volume (gigawatt) Forecast, by Application 2019 & 2032
- Table 25: Global Spanish Renewable Energy Market Revenue Million Forecast, by Hydro 2019 & 2032
- Table 26: Global Spanish Renewable Energy Market Volume gigawatt Forecast, by Hydro 2019 & 2032
- Table 27: Global Spanish Renewable Energy Market Revenue Million Forecast, by Wind 2019 & 2032
- Table 28: Global Spanish Renewable Energy Market Volume gigawatt Forecast, by Wind 2019 & 2032
- Table 29: Global Spanish Renewable Energy Market Revenue Million Forecast, by Solar 2019 & 2032
- Table 30: Global Spanish Renewable Energy Market Volume gigawatt Forecast, by Solar 2019 & 2032
- Table 31: Global Spanish Renewable Energy Market Revenue Million Forecast, by Other Technologies 2019 & 2032
- Table 32: Global Spanish Renewable Energy Market Volume gigawatt Forecast, by Other Technologies 2019 & 2032
- Table 33: Global Spanish Renewable Energy Market Revenue Million Forecast, by Country 2019 & 2032
- Table 34: Global Spanish Renewable Energy Market Volume gigawatt Forecast, by Country 2019 & 2032
- Table 35: United States Spanish Renewable Energy Market Revenue (Million) Forecast, by Application 2019 & 2032
- Table 36: United States Spanish Renewable Energy Market Volume (gigawatt) Forecast, by Application 2019 & 2032
- Table 37: Canada Spanish Renewable Energy Market Revenue (Million) Forecast, by Application 2019 & 2032
- Table 38: Canada Spanish Renewable Energy Market Volume (gigawatt) Forecast, by Application 2019 & 2032
- Table 39: Mexico Spanish Renewable Energy Market Revenue (Million) Forecast, by Application 2019 & 2032
- Table 40: Mexico Spanish Renewable Energy Market Volume (gigawatt) Forecast, by Application 2019 & 2032
- Table 41: Global Spanish Renewable Energy Market Revenue Million Forecast, by Hydro 2019 & 2032
- Table 42: Global Spanish Renewable Energy Market Volume gigawatt Forecast, by Hydro 2019 & 2032
- Table 43: Global Spanish Renewable Energy Market Revenue Million Forecast, by Wind 2019 & 2032
- Table 44: Global Spanish Renewable Energy Market Volume gigawatt Forecast, by Wind 2019 & 2032
- Table 45: Global Spanish Renewable Energy Market Revenue Million Forecast, by Solar 2019 & 2032
- Table 46: Global Spanish Renewable Energy Market Volume gigawatt Forecast, by Solar 2019 & 2032
- Table 47: Global Spanish Renewable Energy Market Revenue Million Forecast, by Other Technologies 2019 & 2032
- Table 48: Global Spanish Renewable Energy Market Volume gigawatt Forecast, by Other Technologies 2019 & 2032
- Table 49: Global Spanish Renewable Energy Market Revenue Million Forecast, by Country 2019 & 2032
- Table 50: Global Spanish Renewable Energy Market Volume gigawatt Forecast, by Country 2019 & 2032
- Table 51: Brazil Spanish Renewable Energy Market Revenue (Million) Forecast, by Application 2019 & 2032
- Table 52: Brazil Spanish Renewable Energy Market Volume (gigawatt) Forecast, by Application 2019 & 2032
- Table 53: Argentina Spanish Renewable Energy Market Revenue (Million) Forecast, by Application 2019 & 2032
- Table 54: Argentina Spanish Renewable Energy Market Volume (gigawatt) Forecast, by Application 2019 & 2032
- Table 55: Rest of South America Spanish Renewable Energy Market Revenue (Million) Forecast, by Application 2019 & 2032
- Table 56: Rest of South America Spanish Renewable Energy Market Volume (gigawatt) Forecast, by Application 2019 & 2032
- Table 57: Global Spanish Renewable Energy Market Revenue Million Forecast, by Hydro 2019 & 2032
- Table 58: Global Spanish Renewable Energy Market Volume gigawatt Forecast, by Hydro 2019 & 2032
- Table 59: Global Spanish Renewable Energy Market Revenue Million Forecast, by Wind 2019 & 2032
- Table 60: Global Spanish Renewable Energy Market Volume gigawatt Forecast, by Wind 2019 & 2032
- Table 61: Global Spanish Renewable Energy Market Revenue Million Forecast, by Solar 2019 & 2032
- Table 62: Global Spanish Renewable Energy Market Volume gigawatt Forecast, by Solar 2019 & 2032
- Table 63: Global Spanish Renewable Energy Market Revenue Million Forecast, by Other Technologies 2019 & 2032
- Table 64: Global Spanish Renewable Energy Market Volume gigawatt Forecast, by Other Technologies 2019 & 2032
- Table 65: Global Spanish Renewable Energy Market Revenue Million Forecast, by Country 2019 & 2032
- Table 66: Global Spanish Renewable Energy Market Volume gigawatt Forecast, by Country 2019 & 2032
- Table 67: United Kingdom Spanish Renewable Energy Market Revenue (Million) Forecast, by Application 2019 & 2032
- Table 68: United Kingdom Spanish Renewable Energy Market Volume (gigawatt) Forecast, by Application 2019 & 2032
- Table 69: Germany Spanish Renewable Energy Market Revenue (Million) Forecast, by Application 2019 & 2032
- Table 70: Germany Spanish Renewable Energy Market Volume (gigawatt) Forecast, by Application 2019 & 2032
- Table 71: France Spanish Renewable Energy Market Revenue (Million) Forecast, by Application 2019 & 2032
- Table 72: France Spanish Renewable Energy Market Volume (gigawatt) Forecast, by Application 2019 & 2032
- Table 73: Italy Spanish Renewable Energy Market Revenue (Million) Forecast, by Application 2019 & 2032
- Table 74: Italy Spanish Renewable Energy Market Volume (gigawatt) Forecast, by Application 2019 & 2032
- Table 75: Spain Spanish Renewable Energy Market Revenue (Million) Forecast, by Application 2019 & 2032
- Table 76: Spain Spanish Renewable Energy Market Volume (gigawatt) Forecast, by Application 2019 & 2032
- Table 77: Russia Spanish Renewable Energy Market Revenue (Million) Forecast, by Application 2019 & 2032
- Table 78: Russia Spanish Renewable Energy Market Volume (gigawatt) Forecast, by Application 2019 & 2032
- Table 79: Benelux Spanish Renewable Energy Market Revenue (Million) Forecast, by Application 2019 & 2032
- Table 80: Benelux Spanish Renewable Energy Market Volume (gigawatt) Forecast, by Application 2019 & 2032
- Table 81: Nordics Spanish Renewable Energy Market Revenue (Million) Forecast, by Application 2019 & 2032
- Table 82: Nordics Spanish Renewable Energy Market Volume (gigawatt) Forecast, by Application 2019 & 2032
- Table 83: Rest of Europe Spanish Renewable Energy Market Revenue (Million) Forecast, by Application 2019 & 2032
- Table 84: Rest of Europe Spanish Renewable Energy Market Volume (gigawatt) Forecast, by Application 2019 & 2032
- Table 85: Global Spanish Renewable Energy Market Revenue Million Forecast, by Hydro 2019 & 2032
- Table 86: Global Spanish Renewable Energy Market Volume gigawatt Forecast, by Hydro 2019 & 2032
- Table 87: Global Spanish Renewable Energy Market Revenue Million Forecast, by Wind 2019 & 2032
- Table 88: Global Spanish Renewable Energy Market Volume gigawatt Forecast, by Wind 2019 & 2032
- Table 89: Global Spanish Renewable Energy Market Revenue Million Forecast, by Solar 2019 & 2032
- Table 90: Global Spanish Renewable Energy Market Volume gigawatt Forecast, by Solar 2019 & 2032
- Table 91: Global Spanish Renewable Energy Market Revenue Million Forecast, by Other Technologies 2019 & 2032
- Table 92: Global Spanish Renewable Energy Market Volume gigawatt Forecast, by Other Technologies 2019 & 2032
- Table 93: Global Spanish Renewable Energy Market Revenue Million Forecast, by Country 2019 & 2032
- Table 94: Global Spanish Renewable Energy Market Volume gigawatt Forecast, by Country 2019 & 2032
- Table 95: Turkey Spanish Renewable Energy Market Revenue (Million) Forecast, by Application 2019 & 2032
- Table 96: Turkey Spanish Renewable Energy Market Volume (gigawatt) Forecast, by Application 2019 & 2032
- Table 97: Israel Spanish Renewable Energy Market Revenue (Million) Forecast, by Application 2019 & 2032
- Table 98: Israel Spanish Renewable Energy Market Volume (gigawatt) Forecast, by Application 2019 & 2032
- Table 99: GCC Spanish Renewable Energy Market Revenue (Million) Forecast, by Application 2019 & 2032
- Table 100: GCC Spanish Renewable Energy Market Volume (gigawatt) Forecast, by Application 2019 & 2032
- Table 101: North Africa Spanish Renewable Energy Market Revenue (Million) Forecast, by Application 2019 & 2032
- Table 102: North Africa Spanish Renewable Energy Market Volume (gigawatt) Forecast, by Application 2019 & 2032
- Table 103: South Africa Spanish Renewable Energy Market Revenue (Million) Forecast, by Application 2019 & 2032
- Table 104: South Africa Spanish Renewable Energy Market Volume (gigawatt) Forecast, by Application 2019 & 2032
- Table 105: Rest of Middle East & Africa Spanish Renewable Energy Market Revenue (Million) Forecast, by Application 2019 & 2032
- Table 106: Rest of Middle East & Africa Spanish Renewable Energy Market Volume (gigawatt) Forecast, by Application 2019 & 2032
- Table 107: Global Spanish Renewable Energy Market Revenue Million Forecast, by Hydro 2019 & 2032
- Table 108: Global Spanish Renewable Energy Market Volume gigawatt Forecast, by Hydro 2019 & 2032
- Table 109: Global Spanish Renewable Energy Market Revenue Million Forecast, by Wind 2019 & 2032
- Table 110: Global Spanish Renewable Energy Market Volume gigawatt Forecast, by Wind 2019 & 2032
- Table 111: Global Spanish Renewable Energy Market Revenue Million Forecast, by Solar 2019 & 2032
- Table 112: Global Spanish Renewable Energy Market Volume gigawatt Forecast, by Solar 2019 & 2032
- Table 113: Global Spanish Renewable Energy Market Revenue Million Forecast, by Other Technologies 2019 & 2032
- Table 114: Global Spanish Renewable Energy Market Volume gigawatt Forecast, by Other Technologies 2019 & 2032
- Table 115: Global Spanish Renewable Energy Market Revenue Million Forecast, by Country 2019 & 2032
- Table 116: Global Spanish Renewable Energy Market Volume gigawatt Forecast, by Country 2019 & 2032
- Table 117: China Spanish Renewable Energy Market Revenue (Million) Forecast, by Application 2019 & 2032
- Table 118: China Spanish Renewable Energy Market Volume (gigawatt) Forecast, by Application 2019 & 2032
- Table 119: India Spanish Renewable Energy Market Revenue (Million) Forecast, by Application 2019 & 2032
- Table 120: India Spanish Renewable Energy Market Volume (gigawatt) Forecast, by Application 2019 & 2032
- Table 121: Japan Spanish Renewable Energy Market Revenue (Million) Forecast, by Application 2019 & 2032
- Table 122: Japan Spanish Renewable Energy Market Volume (gigawatt) Forecast, by Application 2019 & 2032
- Table 123: South Korea Spanish Renewable Energy Market Revenue (Million) Forecast, by Application 2019 & 2032
- Table 124: South Korea Spanish Renewable Energy Market Volume (gigawatt) Forecast, by Application 2019 & 2032
- Table 125: ASEAN Spanish Renewable Energy Market Revenue (Million) Forecast, by Application 2019 & 2032
- Table 126: ASEAN Spanish Renewable Energy Market Volume (gigawatt) Forecast, by Application 2019 & 2032
- Table 127: Oceania Spanish Renewable Energy Market Revenue (Million) Forecast, by Application 2019 & 2032
- Table 128: Oceania Spanish Renewable Energy Market Volume (gigawatt) Forecast, by Application 2019 & 2032
- Table 129: Rest of Asia Pacific Spanish Renewable Energy Market Revenue (Million) Forecast, by Application 2019 & 2032
- Table 130: Rest of Asia Pacific Spanish Renewable Energy Market Volume (gigawatt) Forecast, by Application 2019 & 2032
Frequently Asked Questions
1. What is the projected Compound Annual Growth Rate (CAGR) of the Spanish Renewable Energy Market?
The projected CAGR is approximately 16.34%.
2. Which companies are prominent players in the Spanish Renewable Energy Market?
Key companies in the market include JinkoSolar Holding Co Ltd, Iberdrola SA, Solaria Energia y Medio Ambiente SA*List Not Exhaustive, IM2 Systems SLU, Siemens Gamesa Renewable Energy SA, Tudela Solar SL, Red Electrica Corporacion SA, Cobra Group, Acciona SA, Saclima Solar Fotovoltaica SL.
3. What are the main segments of the Spanish Renewable Energy Market?
The market segments include Hydro, Wind, Solar, Other Technologies.
4. Can you provide details about the market size?
The market size is estimated to be USD XX Million as of 2022.
5. What are some drivers contributing to market growth?
4.; Increasing Adoption Of Solar And Wind Energy4.; Supportive Government Policies And Ambitious Targets.
6. What are the notable trends driving market growth?
Wind Technology is Expected to Dominate the Market.
7. Are there any restraints impacting market growth?
4.; Integrating Renewables into the Main Electricity Grid.
8. Can you provide examples of recent developments in the market?
August 2022: Iberdrola put into operation the largest solar plant in Europe, with an installed capacity of 590 MW and an investment exceeding USD 323 million.
9. What pricing options are available for accessing the report?
Pricing options include single-user, multi-user, and enterprise licenses priced at USD 3800, USD 4500, and USD 5800 respectively.
10. Is the market size provided in terms of value or volume?
The market size is provided in terms of value, measured in Million and volume, measured in gigawatt.
11. Are there any specific market keywords associated with the report?
Yes, the market keyword associated with the report is "Spanish Renewable Energy Market," which aids in identifying and referencing the specific market segment covered.
12. How do I determine which pricing option suits my needs best?
The pricing options vary based on user requirements and access needs. Individual users may opt for single-user licenses, while businesses requiring broader access may choose multi-user or enterprise licenses for cost-effective access to the report.
13. Are there any additional resources or data provided in the Spanish Renewable Energy Market report?
While the report offers comprehensive insights, it's advisable to review the specific contents or supplementary materials provided to ascertain if additional resources or data are available.
14. How can I stay updated on further developments or reports in the Spanish Renewable Energy Market?
To stay informed about further developments, trends, and reports in the Spanish Renewable Energy Market, consider subscribing to industry newsletters, following relevant companies and organizations, or regularly checking reputable industry news sources and publications.
Methodology
Step 1 - Identification of Relevant Samples Size from Population Database


Step 2 - Approaches for Defining Global Market Size (Value, Volume* & Price*)

Note*: In applicable scenarios
Step 3 - Data Sources
Primary Research
- Web Analytics
- Survey Reports
- Research Institute
- Latest Research Reports
- Opinion Leaders
Secondary Research
- Annual Reports
- White Paper
- Latest Press Release
- Industry Association
- Paid Database
- Investor Presentations

Step 4 - Data Triangulation
Involves using different sources of information in order to increase the validity of a study
These sources are likely to be stakeholders in a program - participants, other researchers, program staff, other community members, and so on.
Then we put all data in single framework & apply various statistical tools to find out the dynamic on the market.
During the analysis stage, feedback from the stakeholder groups would be compared to determine areas of agreement as well as areas of divergence
