

Key Insights
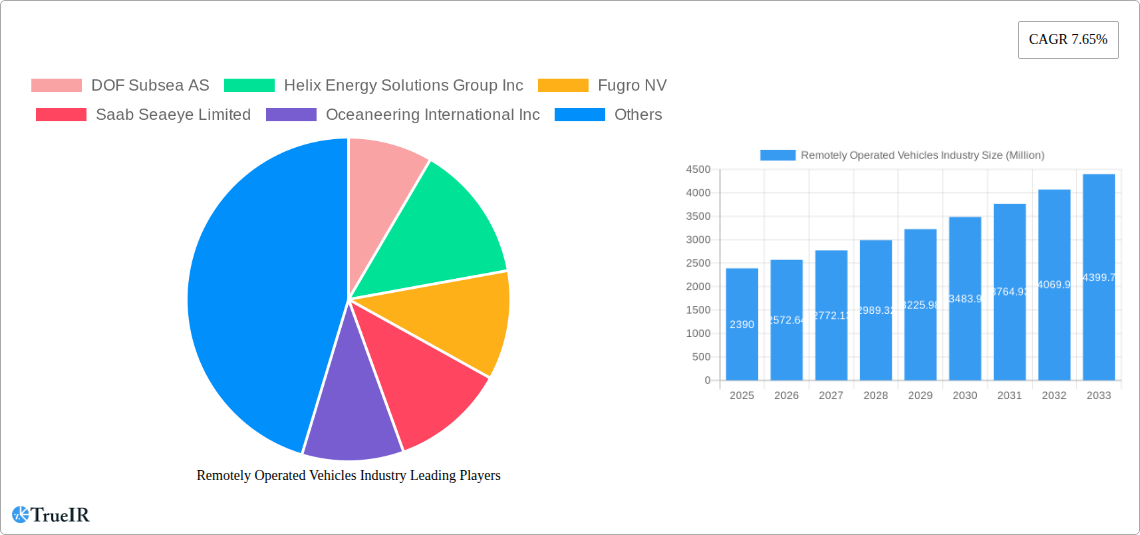
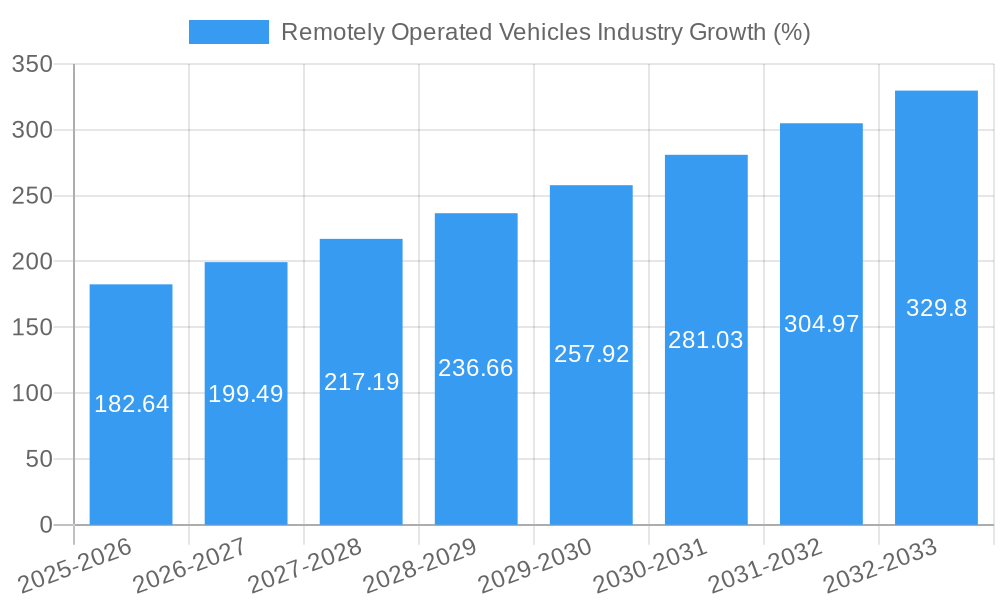
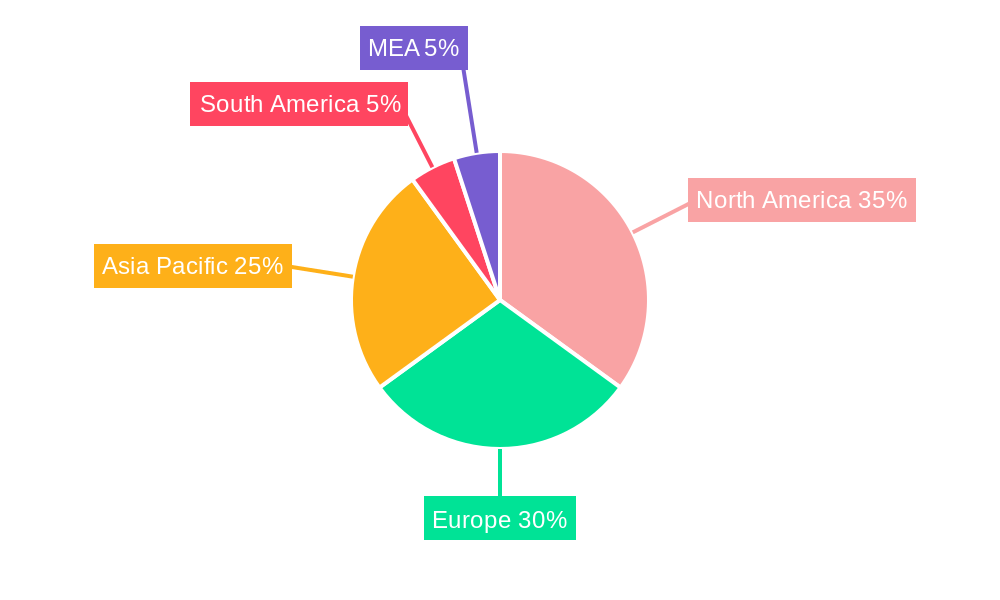
The Remotely Operated Vehicle (ROV) industry is experiencing robust growth, projected to reach a market size of $2.39 billion in 2025, expanding at a Compound Annual Growth Rate (CAGR) of 7.65%. This expansion is fueled by several key drivers. The increasing demand for subsea infrastructure development in the oil and gas sector, coupled with rising investments in deep-sea exploration and marine research, significantly boosts ROV adoption. Furthermore, the growing need for efficient and cost-effective solutions for underwater inspection, repair, and maintenance (IRM) across various industries, including defense and renewable energy, fuels market growth. Technological advancements, such as improved sensor technologies and enhanced maneuverability, are also contributing factors. The ROV market is segmented by type (Work Class, Observatory Class), application (Oil & Gas, Defense, Deep Sea Exploration, Other), and activity (Survey, Inspection, Repair & Maintenance, Burial & Trenching, Other). The geographic distribution reveals strong market presence in North America and Europe, with Asia-Pacific showing significant growth potential. Leading players like DOF Subsea, Oceaneering International, and Fugro are strategically investing in research and development to maintain their market share and capitalize on emerging opportunities.
The competitive landscape is characterized by both established players and emerging technology providers. The market's future growth hinges on several factors. Continued technological innovation, especially in areas like autonomous navigation and AI-powered data analysis, will be crucial. Furthermore, regulatory frameworks and safety standards related to underwater operations will significantly impact market expansion. The increasing focus on sustainable practices in the offshore energy sector will also influence the demand for ROVs. The integration of ROVs with other subsea technologies, creating a more comprehensive and efficient underwater operation system, represents a compelling growth opportunity for the industry. Geographical expansion, particularly in developing economies with significant offshore resources, will play a major role in shaping the future trajectory of the ROV market.
Remotely Operated Vehicles (ROV) Industry Market Report: 2019-2033
This comprehensive report provides a detailed analysis of the Remotely Operated Vehicles (ROV) industry, projecting a market value exceeding $XX Million by 2033. Leveraging data from 2019-2024, with 2025 as the base year, this report offers crucial insights for investors, industry professionals, and strategic decision-makers. The study period covers 2019-2033, with a forecast period spanning 2025-2033.
Remotely Operated Vehicles Industry Market Structure & Competitive Landscape
The ROV market is characterized by a moderately concentrated structure with key players commanding significant market share. The Herfindahl-Hirschman Index (HHI) is estimated at XX, indicating a moderately consolidated market. Innovation in areas such as AI-powered navigation, enhanced sensor technology, and improved maneuverability are key drivers. Stringent safety regulations and environmental concerns influence market dynamics. Product substitutes, including autonomous underwater vehicles (AUVs) are gaining traction, though ROVs maintain dominance in certain applications due to their versatility and real-time control capabilities. The market exhibits strong end-user segmentation, primarily across oil and gas, defense, and deep-sea exploration sectors. M&A activity has been moderate in recent years, with an estimated XX Million in total deal value between 2019-2024. This activity is expected to increase as companies seek to expand their capabilities and geographical reach.
- Key Players: DOF Subsea AS, Helix Energy Solutions Group Inc, Fugro NV, Saab Seaeye Limited, Oceaneering International Inc, Delta SubSea LLC, Saipem SpA, DeepOcean AS, Forum Energy Technologies Inc, ROVOP, TechnipFMC PLC, Bourbon Corporation SA, and several other prominent players.
- Market Concentration: Moderately concentrated, with HHI estimated at XX.
- M&A Activity (2019-2024): Estimated total deal value of XX Million.
- Innovation Drivers: AI-powered navigation, enhanced sensor technology, improved maneuverability.
Remotely Operated Vehicles Industry Market Trends & Opportunities
The global ROV market is experiencing robust growth, driven by increasing demand from the offshore oil and gas industry, expanding deep-sea exploration activities, and heightened investment in underwater infrastructure development. The market is estimated to be worth $XX Million in 2025, projecting a Compound Annual Growth Rate (CAGR) of XX% from 2025 to 2033. Technological advancements, particularly in robotics and AI, are significantly influencing market trends, leading to improved ROV capabilities, reduced operational costs, and increased efficiency. Growing consumer preferences for sustainable and environmentally friendly underwater operations are pushing the adoption of advanced ROVs. Market penetration rates vary significantly across different segments, with the oil and gas sector demonstrating higher penetration compared to defense and other applications. The competitive landscape is dynamic, with established players facing competition from innovative startups offering specialized ROV solutions.
Dominant Markets & Segments in Remotely Operated Vehicles Industry
The oil and gas sector dominates the ROV market, accounting for approximately XX% of the total market share in 2025. The Asia-Pacific region is expected to experience the highest growth rate due to significant investments in offshore energy infrastructure and expanding deep-sea exploration activities.
- Dominant Segment (by Type): Work Class ROVs constitute a larger share due to their versatility and capacity for heavier-duty operations.
- Dominant Segment (by Application): Oil and Gas exploration and production remains the primary application.
- Dominant Region: Asia-Pacific is projected for the fastest growth.
Key Growth Drivers:
- Extensive investments in offshore oil and gas exploration and production in the Asia-Pacific region.
- Growing demand for underwater inspection, maintenance, and repair services.
- Increasing adoption of ROVs for deep-sea exploration and research.
- Growing government support and funding for underwater technology development.
Remotely Operated Vehicles Industry Product Analysis
Recent innovations in ROV technology include enhanced sensors, improved maneuverability systems, and AI-powered navigation capabilities. These advancements improve operational efficiency, reduce downtime, and expand the capabilities of ROVs across various applications. The market success of new ROV models hinges on their ability to deliver enhanced performance, reliability, and cost-effectiveness compared to existing solutions. This is particularly true for deep-sea applications which demand robust and dependable technology.
Key Drivers, Barriers & Challenges in Remotely Operated Vehicles Industry
Key Drivers:
Technological advancements in robotics, sensor technology, and AI are significantly pushing market growth. Increasing demand for underwater infrastructure inspection and maintenance, particularly in the offshore oil and gas sector, is another key driver. Government regulations promoting the use of remotely operated vehicles for environmental monitoring and deep-sea exploration are also propelling market expansion.
Challenges and Restraints:
High initial investment costs for advanced ROV systems can be a barrier to entry for smaller companies. Supply chain disruptions, particularly regarding specialized components and materials, can impact production and delivery timelines. Strict safety regulations and environmental concerns necessitate rigorous testing and certification processes, adding to overall costs. Competition from alternative technologies like AUVs and human-occupied vehicles (HOVs) also presents challenges. These factors contribute to a complex and evolving market landscape.
Growth Drivers in the Remotely Operated Vehicles Industry Market
Technological advancements like AI integration, enhanced sensor technologies, and improved manipulation systems drive market growth. The rising demand for subsea infrastructure inspection, repair, and maintenance in offshore oil and gas and renewable energy sectors is another major driver. Government initiatives promoting the use of ROVs in environmental monitoring and scientific research further fuel market expansion.
Challenges Impacting Remotely Operated Vehicles Industry Growth
High capital expenditure requirements for advanced ROV systems pose a significant barrier to entry for smaller players. Supply chain complexities and the reliance on specialized components can cause delays and impact production. Stringent safety regulations and environmental compliance standards increase operational costs and complexity. Furthermore, increasing competition from alternative technologies like AUVs and increased labor costs present ongoing challenges for the industry.
Key Players Shaping the Remotely Operated Vehicles Industry Market
- DOF Subsea AS
- Helix Energy Solutions Group Inc
- Fugro NV
- Saab Seaeye Limited
- Oceaneering International Inc
- Delta SubSea LLC
- Saipem SpA
- DeepOcean AS
- Forum Energy Technologies Inc
- ROVOP
- TechnipFMC PLC
- Bourbon Corporation SA
Significant Remotely Operated Vehicles Industry Milestones
- May 2023: Blueye Robotics received contracts from the Norwegian Coast Guard to provide new ROV systems.
- January 2024: Solstad Offshore expanded its ROV fleet by equipping six more vessels.
- April 2024: Forssea Robotics launched its ARGOS-X ROV for uncrewed surface vessel integration.
Future Outlook for Remotely Operated Vehicles Industry Market
The ROV market is poised for continued growth, driven by technological innovations, increasing demand from various sectors, and supportive government policies. Strategic partnerships and collaborations are expected to play a key role in accelerating market penetration. The development of more autonomous and AI-powered ROVs presents significant opportunities for growth. The market’s future hinges on addressing the challenges related to cost reduction, improved reliability, and efficient supply chains.
Remotely Operated Vehicles Industry Segmentation
-
1. Type
- 1.1. Work Class ROV
- 1.2. Observatory Class ROV
-
2. Application
- 2.1. Oil and Gas
- 2.2. Defense
- 2.3. Other Applications
- 2.4. Deep Sea Marine Exploration
-
3. Activity
- 3.1. Survey
- 3.2. Inspection, Repair, and Maintenance
- 3.3. Burial and Trenching
- 3.4. Other Activities
Remotely Operated Vehicles Industry Segmentation By Geography
-
1. North America
- 1.1. United States
- 1.2. Canada
- 1.3. Rest of North America
-
2. Europe
- 2.1. Germany
- 2.2. Denmark
- 2.3. Norway
- 2.4. United Kingdom
- 2.5. Italy
- 2.6. NORDIC
- 2.7. Russia
- 2.8. France
- 2.9. Turkey
- 2.10. Rest of Europe
-
3. Asia Pacific
- 3.1. China
- 3.2. India
- 3.3. Japan
- 3.4. Australia
- 3.5. Thailand
- 3.6. Malaysia
- 3.7. Indonesia
- 3.8. Vietnam
- 3.9. Rest of Asia Pacific
-
4. South America
- 4.1. Brazil
- 4.2. Argentina
- 4.3. Colombia
- 4.4. Rest of South America
-
5. Middle East and Africa
- 5.1. Saudi Arabia
- 5.2. United Arab Emirates
- 5.3. Nigeria
- 5.4. South Africa
- 5.5. Qatar
- 5.6. Egypt
- 5.7. Rest of Middle East and Africa
Remotely Operated Vehicles Industry REPORT HIGHLIGHTS
| Aspects | Details |
|---|---|
| Study Period | 2019-2033 |
| Base Year | 2024 |
| Estimated Year | 2025 |
| Forecast Period | 2025-2033 |
| Historical Period | 2019-2024 |
| Growth Rate | CAGR of 7.65% from 2019-2033 |
| Segmentation |
|
Table of Contents
- 1. Introduction
- 1.1. Research Scope
- 1.2. Market Segmentation
- 1.3. Research Methodology
- 1.4. Definitions and Assumptions
- 2. Executive Summary
- 2.1. Introduction
- 3. Market Dynamics
- 3.1. Introduction
- 3.2. Market Drivers
- 3.2.1 4.; Increasing Offshore Oil & Gas Exploration Activities in the Americas
- 3.2.2 Asia-Pacific
- 3.2.3 and Middle East and Africa 4.; Growing Offshore Renewable Technologies
- 3.3. Market Restrains
- 3.3.1. 4.; Ban on Offshore Exploration and Production Activities in Multiple Regions
- 3.4. Market Trends
- 3.4.1. The Oil & Gas Application Segment is Expected to Dominate the Market
- 4. Market Factor Analysis
- 4.1. Porters Five Forces
- 4.2. Supply/Value Chain
- 4.3. PESTEL analysis
- 4.4. Market Entropy
- 4.5. Patent/Trademark Analysis
- 5. Global Remotely Operated Vehicles Industry Analysis, Insights and Forecast, 2019-2031
- 5.1. Market Analysis, Insights and Forecast - by Type
- 5.1.1. Work Class ROV
- 5.1.2. Observatory Class ROV
- 5.2. Market Analysis, Insights and Forecast - by Application
- 5.2.1. Oil and Gas
- 5.2.2. Defense
- 5.2.3. Other Applications
- 5.2.4. Deep Sea Marine Exploration
- 5.3. Market Analysis, Insights and Forecast - by Activity
- 5.3.1. Survey
- 5.3.2. Inspection, Repair, and Maintenance
- 5.3.3. Burial and Trenching
- 5.3.4. Other Activities
- 5.4. Market Analysis, Insights and Forecast - by Region
- 5.4.1. North America
- 5.4.2. Europe
- 5.4.3. Asia Pacific
- 5.4.4. South America
- 5.4.5. Middle East and Africa
- 5.1. Market Analysis, Insights and Forecast - by Type
- 6. North America Remotely Operated Vehicles Industry Analysis, Insights and Forecast, 2019-2031
- 6.1. Market Analysis, Insights and Forecast - by Type
- 6.1.1. Work Class ROV
- 6.1.2. Observatory Class ROV
- 6.2. Market Analysis, Insights and Forecast - by Application
- 6.2.1. Oil and Gas
- 6.2.2. Defense
- 6.2.3. Other Applications
- 6.2.4. Deep Sea Marine Exploration
- 6.3. Market Analysis, Insights and Forecast - by Activity
- 6.3.1. Survey
- 6.3.2. Inspection, Repair, and Maintenance
- 6.3.3. Burial and Trenching
- 6.3.4. Other Activities
- 6.1. Market Analysis, Insights and Forecast - by Type
- 7. Europe Remotely Operated Vehicles Industry Analysis, Insights and Forecast, 2019-2031
- 7.1. Market Analysis, Insights and Forecast - by Type
- 7.1.1. Work Class ROV
- 7.1.2. Observatory Class ROV
- 7.2. Market Analysis, Insights and Forecast - by Application
- 7.2.1. Oil and Gas
- 7.2.2. Defense
- 7.2.3. Other Applications
- 7.2.4. Deep Sea Marine Exploration
- 7.3. Market Analysis, Insights and Forecast - by Activity
- 7.3.1. Survey
- 7.3.2. Inspection, Repair, and Maintenance
- 7.3.3. Burial and Trenching
- 7.3.4. Other Activities
- 7.1. Market Analysis, Insights and Forecast - by Type
- 8. Asia Pacific Remotely Operated Vehicles Industry Analysis, Insights and Forecast, 2019-2031
- 8.1. Market Analysis, Insights and Forecast - by Type
- 8.1.1. Work Class ROV
- 8.1.2. Observatory Class ROV
- 8.2. Market Analysis, Insights and Forecast - by Application
- 8.2.1. Oil and Gas
- 8.2.2. Defense
- 8.2.3. Other Applications
- 8.2.4. Deep Sea Marine Exploration
- 8.3. Market Analysis, Insights and Forecast - by Activity
- 8.3.1. Survey
- 8.3.2. Inspection, Repair, and Maintenance
- 8.3.3. Burial and Trenching
- 8.3.4. Other Activities
- 8.1. Market Analysis, Insights and Forecast - by Type
- 9. South America Remotely Operated Vehicles Industry Analysis, Insights and Forecast, 2019-2031
- 9.1. Market Analysis, Insights and Forecast - by Type
- 9.1.1. Work Class ROV
- 9.1.2. Observatory Class ROV
- 9.2. Market Analysis, Insights and Forecast - by Application
- 9.2.1. Oil and Gas
- 9.2.2. Defense
- 9.2.3. Other Applications
- 9.2.4. Deep Sea Marine Exploration
- 9.3. Market Analysis, Insights and Forecast - by Activity
- 9.3.1. Survey
- 9.3.2. Inspection, Repair, and Maintenance
- 9.3.3. Burial and Trenching
- 9.3.4. Other Activities
- 9.1. Market Analysis, Insights and Forecast - by Type
- 10. Middle East and Africa Remotely Operated Vehicles Industry Analysis, Insights and Forecast, 2019-2031
- 10.1. Market Analysis, Insights and Forecast - by Type
- 10.1.1. Work Class ROV
- 10.1.2. Observatory Class ROV
- 10.2. Market Analysis, Insights and Forecast - by Application
- 10.2.1. Oil and Gas
- 10.2.2. Defense
- 10.2.3. Other Applications
- 10.2.4. Deep Sea Marine Exploration
- 10.3. Market Analysis, Insights and Forecast - by Activity
- 10.3.1. Survey
- 10.3.2. Inspection, Repair, and Maintenance
- 10.3.3. Burial and Trenching
- 10.3.4. Other Activities
- 10.1. Market Analysis, Insights and Forecast - by Type
- 11. North America Remotely Operated Vehicles Industry Analysis, Insights and Forecast, 2019-2031
- 11.1. Market Analysis, Insights and Forecast - By Country/Sub-region
- 11.1.1 United States
- 11.1.2 Canada
- 11.1.3 Mexico
- 12. Europe Remotely Operated Vehicles Industry Analysis, Insights and Forecast, 2019-2031
- 12.1. Market Analysis, Insights and Forecast - By Country/Sub-region
- 12.1.1 Germany
- 12.1.2 United Kingdom
- 12.1.3 France
- 12.1.4 Spain
- 12.1.5 Italy
- 12.1.6 Spain
- 12.1.7 Belgium
- 12.1.8 Netherland
- 12.1.9 Nordics
- 12.1.10 Rest of Europe
- 13. Asia Pacific Remotely Operated Vehicles Industry Analysis, Insights and Forecast, 2019-2031
- 13.1. Market Analysis, Insights and Forecast - By Country/Sub-region
- 13.1.1 China
- 13.1.2 Japan
- 13.1.3 India
- 13.1.4 South Korea
- 13.1.5 Southeast Asia
- 13.1.6 Australia
- 13.1.7 Indonesia
- 13.1.8 Phillipes
- 13.1.9 Singapore
- 13.1.10 Thailandc
- 13.1.11 Rest of Asia Pacific
- 14. South America Remotely Operated Vehicles Industry Analysis, Insights and Forecast, 2019-2031
- 14.1. Market Analysis, Insights and Forecast - By Country/Sub-region
- 14.1.1 Brazil
- 14.1.2 Argentina
- 14.1.3 Peru
- 14.1.4 Chile
- 14.1.5 Colombia
- 14.1.6 Ecuador
- 14.1.7 Venezuela
- 14.1.8 Rest of South America
- 15. North America Remotely Operated Vehicles Industry Analysis, Insights and Forecast, 2019-2031
- 15.1. Market Analysis, Insights and Forecast - By Country/Sub-region
- 15.1.1 United States
- 15.1.2 Canada
- 15.1.3 Mexico
- 16. MEA Remotely Operated Vehicles Industry Analysis, Insights and Forecast, 2019-2031
- 16.1. Market Analysis, Insights and Forecast - By Country/Sub-region
- 16.1.1 United Arab Emirates
- 16.1.2 Saudi Arabia
- 16.1.3 South Africa
- 16.1.4 Rest of Middle East and Africa
- 17. Competitive Analysis
- 17.1. Global Market Share Analysis 2024
- 17.2. Company Profiles
- 17.2.1 DOF Subsea AS
- 17.2.1.1. Overview
- 17.2.1.2. Products
- 17.2.1.3. SWOT Analysis
- 17.2.1.4. Recent Developments
- 17.2.1.5. Financials (Based on Availability)
- 17.2.2 Helix Energy Solutions Group Inc
- 17.2.2.1. Overview
- 17.2.2.2. Products
- 17.2.2.3. SWOT Analysis
- 17.2.2.4. Recent Developments
- 17.2.2.5. Financials (Based on Availability)
- 17.2.3 Fugro NV
- 17.2.3.1. Overview
- 17.2.3.2. Products
- 17.2.3.3. SWOT Analysis
- 17.2.3.4. Recent Developments
- 17.2.3.5. Financials (Based on Availability)
- 17.2.4 Saab Seaeye Limited
- 17.2.4.1. Overview
- 17.2.4.2. Products
- 17.2.4.3. SWOT Analysis
- 17.2.4.4. Recent Developments
- 17.2.4.5. Financials (Based on Availability)
- 17.2.5 Oceaneering International Inc
- 17.2.5.1. Overview
- 17.2.5.2. Products
- 17.2.5.3. SWOT Analysis
- 17.2.5.4. Recent Developments
- 17.2.5.5. Financials (Based on Availability)
- 17.2.6 Delta SubSea LLC
- 17.2.6.1. Overview
- 17.2.6.2. Products
- 17.2.6.3. SWOT Analysis
- 17.2.6.4. Recent Developments
- 17.2.6.5. Financials (Based on Availability)
- 17.2.7 Saipem SpA
- 17.2.7.1. Overview
- 17.2.7.2. Products
- 17.2.7.3. SWOT Analysis
- 17.2.7.4. Recent Developments
- 17.2.7.5. Financials (Based on Availability)
- 17.2.8 DeepOcean AS
- 17.2.8.1. Overview
- 17.2.8.2. Products
- 17.2.8.3. SWOT Analysis
- 17.2.8.4. Recent Developments
- 17.2.8.5. Financials (Based on Availability)
- 17.2.9 Forum Energy Technologies Inc
- 17.2.9.1. Overview
- 17.2.9.2. Products
- 17.2.9.3. SWOT Analysis
- 17.2.9.4. Recent Developments
- 17.2.9.5. Financials (Based on Availability)
- 17.2.10 ROVOP*List Not Exhaustive 6 4 List of Other Prominent Players6 5 Market Ranking/Share (%) Analysi
- 17.2.10.1. Overview
- 17.2.10.2. Products
- 17.2.10.3. SWOT Analysis
- 17.2.10.4. Recent Developments
- 17.2.10.5. Financials (Based on Availability)
- 17.2.11 TechnipFMC PLC
- 17.2.11.1. Overview
- 17.2.11.2. Products
- 17.2.11.3. SWOT Analysis
- 17.2.11.4. Recent Developments
- 17.2.11.5. Financials (Based on Availability)
- 17.2.12 Bourbon Corporation SA
- 17.2.12.1. Overview
- 17.2.12.2. Products
- 17.2.12.3. SWOT Analysis
- 17.2.12.4. Recent Developments
- 17.2.12.5. Financials (Based on Availability)
- 17.2.1 DOF Subsea AS
List of Figures
- Figure 1: Global Remotely Operated Vehicles Industry Revenue Breakdown (Million, %) by Region 2024 & 2032
- Figure 2: North America Remotely Operated Vehicles Industry Revenue (Million), by Country 2024 & 2032
- Figure 3: North America Remotely Operated Vehicles Industry Revenue Share (%), by Country 2024 & 2032
- Figure 4: Europe Remotely Operated Vehicles Industry Revenue (Million), by Country 2024 & 2032
- Figure 5: Europe Remotely Operated Vehicles Industry Revenue Share (%), by Country 2024 & 2032
- Figure 6: Asia Pacific Remotely Operated Vehicles Industry Revenue (Million), by Country 2024 & 2032
- Figure 7: Asia Pacific Remotely Operated Vehicles Industry Revenue Share (%), by Country 2024 & 2032
- Figure 8: South America Remotely Operated Vehicles Industry Revenue (Million), by Country 2024 & 2032
- Figure 9: South America Remotely Operated Vehicles Industry Revenue Share (%), by Country 2024 & 2032
- Figure 10: North America Remotely Operated Vehicles Industry Revenue (Million), by Country 2024 & 2032
- Figure 11: North America Remotely Operated Vehicles Industry Revenue Share (%), by Country 2024 & 2032
- Figure 12: MEA Remotely Operated Vehicles Industry Revenue (Million), by Country 2024 & 2032
- Figure 13: MEA Remotely Operated Vehicles Industry Revenue Share (%), by Country 2024 & 2032
- Figure 14: North America Remotely Operated Vehicles Industry Revenue (Million), by Type 2024 & 2032
- Figure 15: North America Remotely Operated Vehicles Industry Revenue Share (%), by Type 2024 & 2032
- Figure 16: North America Remotely Operated Vehicles Industry Revenue (Million), by Application 2024 & 2032
- Figure 17: North America Remotely Operated Vehicles Industry Revenue Share (%), by Application 2024 & 2032
- Figure 18: North America Remotely Operated Vehicles Industry Revenue (Million), by Activity 2024 & 2032
- Figure 19: North America Remotely Operated Vehicles Industry Revenue Share (%), by Activity 2024 & 2032
- Figure 20: North America Remotely Operated Vehicles Industry Revenue (Million), by Country 2024 & 2032
- Figure 21: North America Remotely Operated Vehicles Industry Revenue Share (%), by Country 2024 & 2032
- Figure 22: Europe Remotely Operated Vehicles Industry Revenue (Million), by Type 2024 & 2032
- Figure 23: Europe Remotely Operated Vehicles Industry Revenue Share (%), by Type 2024 & 2032
- Figure 24: Europe Remotely Operated Vehicles Industry Revenue (Million), by Application 2024 & 2032
- Figure 25: Europe Remotely Operated Vehicles Industry Revenue Share (%), by Application 2024 & 2032
- Figure 26: Europe Remotely Operated Vehicles Industry Revenue (Million), by Activity 2024 & 2032
- Figure 27: Europe Remotely Operated Vehicles Industry Revenue Share (%), by Activity 2024 & 2032
- Figure 28: Europe Remotely Operated Vehicles Industry Revenue (Million), by Country 2024 & 2032
- Figure 29: Europe Remotely Operated Vehicles Industry Revenue Share (%), by Country 2024 & 2032
- Figure 30: Asia Pacific Remotely Operated Vehicles Industry Revenue (Million), by Type 2024 & 2032
- Figure 31: Asia Pacific Remotely Operated Vehicles Industry Revenue Share (%), by Type 2024 & 2032
- Figure 32: Asia Pacific Remotely Operated Vehicles Industry Revenue (Million), by Application 2024 & 2032
- Figure 33: Asia Pacific Remotely Operated Vehicles Industry Revenue Share (%), by Application 2024 & 2032
- Figure 34: Asia Pacific Remotely Operated Vehicles Industry Revenue (Million), by Activity 2024 & 2032
- Figure 35: Asia Pacific Remotely Operated Vehicles Industry Revenue Share (%), by Activity 2024 & 2032
- Figure 36: Asia Pacific Remotely Operated Vehicles Industry Revenue (Million), by Country 2024 & 2032
- Figure 37: Asia Pacific Remotely Operated Vehicles Industry Revenue Share (%), by Country 2024 & 2032
- Figure 38: South America Remotely Operated Vehicles Industry Revenue (Million), by Type 2024 & 2032
- Figure 39: South America Remotely Operated Vehicles Industry Revenue Share (%), by Type 2024 & 2032
- Figure 40: South America Remotely Operated Vehicles Industry Revenue (Million), by Application 2024 & 2032
- Figure 41: South America Remotely Operated Vehicles Industry Revenue Share (%), by Application 2024 & 2032
- Figure 42: South America Remotely Operated Vehicles Industry Revenue (Million), by Activity 2024 & 2032
- Figure 43: South America Remotely Operated Vehicles Industry Revenue Share (%), by Activity 2024 & 2032
- Figure 44: South America Remotely Operated Vehicles Industry Revenue (Million), by Country 2024 & 2032
- Figure 45: South America Remotely Operated Vehicles Industry Revenue Share (%), by Country 2024 & 2032
- Figure 46: Middle East and Africa Remotely Operated Vehicles Industry Revenue (Million), by Type 2024 & 2032
- Figure 47: Middle East and Africa Remotely Operated Vehicles Industry Revenue Share (%), by Type 2024 & 2032
- Figure 48: Middle East and Africa Remotely Operated Vehicles Industry Revenue (Million), by Application 2024 & 2032
- Figure 49: Middle East and Africa Remotely Operated Vehicles Industry Revenue Share (%), by Application 2024 & 2032
- Figure 50: Middle East and Africa Remotely Operated Vehicles Industry Revenue (Million), by Activity 2024 & 2032
- Figure 51: Middle East and Africa Remotely Operated Vehicles Industry Revenue Share (%), by Activity 2024 & 2032
- Figure 52: Middle East and Africa Remotely Operated Vehicles Industry Revenue (Million), by Country 2024 & 2032
- Figure 53: Middle East and Africa Remotely Operated Vehicles Industry Revenue Share (%), by Country 2024 & 2032
List of Tables
- Table 1: Global Remotely Operated Vehicles Industry Revenue Million Forecast, by Region 2019 & 2032
- Table 2: Global Remotely Operated Vehicles Industry Revenue Million Forecast, by Type 2019 & 2032
- Table 3: Global Remotely Operated Vehicles Industry Revenue Million Forecast, by Application 2019 & 2032
- Table 4: Global Remotely Operated Vehicles Industry Revenue Million Forecast, by Activity 2019 & 2032
- Table 5: Global Remotely Operated Vehicles Industry Revenue Million Forecast, by Region 2019 & 2032
- Table 6: Global Remotely Operated Vehicles Industry Revenue Million Forecast, by Country 2019 & 2032
- Table 7: United States Remotely Operated Vehicles Industry Revenue (Million) Forecast, by Application 2019 & 2032
- Table 8: Canada Remotely Operated Vehicles Industry Revenue (Million) Forecast, by Application 2019 & 2032
- Table 9: Mexico Remotely Operated Vehicles Industry Revenue (Million) Forecast, by Application 2019 & 2032
- Table 10: Global Remotely Operated Vehicles Industry Revenue Million Forecast, by Country 2019 & 2032
- Table 11: Germany Remotely Operated Vehicles Industry Revenue (Million) Forecast, by Application 2019 & 2032
- Table 12: United Kingdom Remotely Operated Vehicles Industry Revenue (Million) Forecast, by Application 2019 & 2032
- Table 13: France Remotely Operated Vehicles Industry Revenue (Million) Forecast, by Application 2019 & 2032
- Table 14: Spain Remotely Operated Vehicles Industry Revenue (Million) Forecast, by Application 2019 & 2032
- Table 15: Italy Remotely Operated Vehicles Industry Revenue (Million) Forecast, by Application 2019 & 2032
- Table 16: Spain Remotely Operated Vehicles Industry Revenue (Million) Forecast, by Application 2019 & 2032
- Table 17: Belgium Remotely Operated Vehicles Industry Revenue (Million) Forecast, by Application 2019 & 2032
- Table 18: Netherland Remotely Operated Vehicles Industry Revenue (Million) Forecast, by Application 2019 & 2032
- Table 19: Nordics Remotely Operated Vehicles Industry Revenue (Million) Forecast, by Application 2019 & 2032
- Table 20: Rest of Europe Remotely Operated Vehicles Industry Revenue (Million) Forecast, by Application 2019 & 2032
- Table 21: Global Remotely Operated Vehicles Industry Revenue Million Forecast, by Country 2019 & 2032
- Table 22: China Remotely Operated Vehicles Industry Revenue (Million) Forecast, by Application 2019 & 2032
- Table 23: Japan Remotely Operated Vehicles Industry Revenue (Million) Forecast, by Application 2019 & 2032
- Table 24: India Remotely Operated Vehicles Industry Revenue (Million) Forecast, by Application 2019 & 2032
- Table 25: South Korea Remotely Operated Vehicles Industry Revenue (Million) Forecast, by Application 2019 & 2032
- Table 26: Southeast Asia Remotely Operated Vehicles Industry Revenue (Million) Forecast, by Application 2019 & 2032
- Table 27: Australia Remotely Operated Vehicles Industry Revenue (Million) Forecast, by Application 2019 & 2032
- Table 28: Indonesia Remotely Operated Vehicles Industry Revenue (Million) Forecast, by Application 2019 & 2032
- Table 29: Phillipes Remotely Operated Vehicles Industry Revenue (Million) Forecast, by Application 2019 & 2032
- Table 30: Singapore Remotely Operated Vehicles Industry Revenue (Million) Forecast, by Application 2019 & 2032
- Table 31: Thailandc Remotely Operated Vehicles Industry Revenue (Million) Forecast, by Application 2019 & 2032
- Table 32: Rest of Asia Pacific Remotely Operated Vehicles Industry Revenue (Million) Forecast, by Application 2019 & 2032
- Table 33: Global Remotely Operated Vehicles Industry Revenue Million Forecast, by Country 2019 & 2032
- Table 34: Brazil Remotely Operated Vehicles Industry Revenue (Million) Forecast, by Application 2019 & 2032
- Table 35: Argentina Remotely Operated Vehicles Industry Revenue (Million) Forecast, by Application 2019 & 2032
- Table 36: Peru Remotely Operated Vehicles Industry Revenue (Million) Forecast, by Application 2019 & 2032
- Table 37: Chile Remotely Operated Vehicles Industry Revenue (Million) Forecast, by Application 2019 & 2032
- Table 38: Colombia Remotely Operated Vehicles Industry Revenue (Million) Forecast, by Application 2019 & 2032
- Table 39: Ecuador Remotely Operated Vehicles Industry Revenue (Million) Forecast, by Application 2019 & 2032
- Table 40: Venezuela Remotely Operated Vehicles Industry Revenue (Million) Forecast, by Application 2019 & 2032
- Table 41: Rest of South America Remotely Operated Vehicles Industry Revenue (Million) Forecast, by Application 2019 & 2032
- Table 42: Global Remotely Operated Vehicles Industry Revenue Million Forecast, by Country 2019 & 2032
- Table 43: United States Remotely Operated Vehicles Industry Revenue (Million) Forecast, by Application 2019 & 2032
- Table 44: Canada Remotely Operated Vehicles Industry Revenue (Million) Forecast, by Application 2019 & 2032
- Table 45: Mexico Remotely Operated Vehicles Industry Revenue (Million) Forecast, by Application 2019 & 2032
- Table 46: Global Remotely Operated Vehicles Industry Revenue Million Forecast, by Country 2019 & 2032
- Table 47: United Arab Emirates Remotely Operated Vehicles Industry Revenue (Million) Forecast, by Application 2019 & 2032
- Table 48: Saudi Arabia Remotely Operated Vehicles Industry Revenue (Million) Forecast, by Application 2019 & 2032
- Table 49: South Africa Remotely Operated Vehicles Industry Revenue (Million) Forecast, by Application 2019 & 2032
- Table 50: Rest of Middle East and Africa Remotely Operated Vehicles Industry Revenue (Million) Forecast, by Application 2019 & 2032
- Table 51: Global Remotely Operated Vehicles Industry Revenue Million Forecast, by Type 2019 & 2032
- Table 52: Global Remotely Operated Vehicles Industry Revenue Million Forecast, by Application 2019 & 2032
- Table 53: Global Remotely Operated Vehicles Industry Revenue Million Forecast, by Activity 2019 & 2032
- Table 54: Global Remotely Operated Vehicles Industry Revenue Million Forecast, by Country 2019 & 2032
- Table 55: United States Remotely Operated Vehicles Industry Revenue (Million) Forecast, by Application 2019 & 2032
- Table 56: Canada Remotely Operated Vehicles Industry Revenue (Million) Forecast, by Application 2019 & 2032
- Table 57: Rest of North America Remotely Operated Vehicles Industry Revenue (Million) Forecast, by Application 2019 & 2032
- Table 58: Global Remotely Operated Vehicles Industry Revenue Million Forecast, by Type 2019 & 2032
- Table 59: Global Remotely Operated Vehicles Industry Revenue Million Forecast, by Application 2019 & 2032
- Table 60: Global Remotely Operated Vehicles Industry Revenue Million Forecast, by Activity 2019 & 2032
- Table 61: Global Remotely Operated Vehicles Industry Revenue Million Forecast, by Country 2019 & 2032
- Table 62: Germany Remotely Operated Vehicles Industry Revenue (Million) Forecast, by Application 2019 & 2032
- Table 63: Denmark Remotely Operated Vehicles Industry Revenue (Million) Forecast, by Application 2019 & 2032
- Table 64: Norway Remotely Operated Vehicles Industry Revenue (Million) Forecast, by Application 2019 & 2032
- Table 65: United Kingdom Remotely Operated Vehicles Industry Revenue (Million) Forecast, by Application 2019 & 2032
- Table 66: Italy Remotely Operated Vehicles Industry Revenue (Million) Forecast, by Application 2019 & 2032
- Table 67: NORDIC Remotely Operated Vehicles Industry Revenue (Million) Forecast, by Application 2019 & 2032
- Table 68: Russia Remotely Operated Vehicles Industry Revenue (Million) Forecast, by Application 2019 & 2032
- Table 69: France Remotely Operated Vehicles Industry Revenue (Million) Forecast, by Application 2019 & 2032
- Table 70: Turkey Remotely Operated Vehicles Industry Revenue (Million) Forecast, by Application 2019 & 2032
- Table 71: Rest of Europe Remotely Operated Vehicles Industry Revenue (Million) Forecast, by Application 2019 & 2032
- Table 72: Global Remotely Operated Vehicles Industry Revenue Million Forecast, by Type 2019 & 2032
- Table 73: Global Remotely Operated Vehicles Industry Revenue Million Forecast, by Application 2019 & 2032
- Table 74: Global Remotely Operated Vehicles Industry Revenue Million Forecast, by Activity 2019 & 2032
- Table 75: Global Remotely Operated Vehicles Industry Revenue Million Forecast, by Country 2019 & 2032
- Table 76: China Remotely Operated Vehicles Industry Revenue (Million) Forecast, by Application 2019 & 2032
- Table 77: India Remotely Operated Vehicles Industry Revenue (Million) Forecast, by Application 2019 & 2032
- Table 78: Japan Remotely Operated Vehicles Industry Revenue (Million) Forecast, by Application 2019 & 2032
- Table 79: Australia Remotely Operated Vehicles Industry Revenue (Million) Forecast, by Application 2019 & 2032
- Table 80: Thailand Remotely Operated Vehicles Industry Revenue (Million) Forecast, by Application 2019 & 2032
- Table 81: Malaysia Remotely Operated Vehicles Industry Revenue (Million) Forecast, by Application 2019 & 2032
- Table 82: Indonesia Remotely Operated Vehicles Industry Revenue (Million) Forecast, by Application 2019 & 2032
- Table 83: Vietnam Remotely Operated Vehicles Industry Revenue (Million) Forecast, by Application 2019 & 2032
- Table 84: Rest of Asia Pacific Remotely Operated Vehicles Industry Revenue (Million) Forecast, by Application 2019 & 2032
- Table 85: Global Remotely Operated Vehicles Industry Revenue Million Forecast, by Type 2019 & 2032
- Table 86: Global Remotely Operated Vehicles Industry Revenue Million Forecast, by Application 2019 & 2032
- Table 87: Global Remotely Operated Vehicles Industry Revenue Million Forecast, by Activity 2019 & 2032
- Table 88: Global Remotely Operated Vehicles Industry Revenue Million Forecast, by Country 2019 & 2032
- Table 89: Brazil Remotely Operated Vehicles Industry Revenue (Million) Forecast, by Application 2019 & 2032
- Table 90: Argentina Remotely Operated Vehicles Industry Revenue (Million) Forecast, by Application 2019 & 2032
- Table 91: Colombia Remotely Operated Vehicles Industry Revenue (Million) Forecast, by Application 2019 & 2032
- Table 92: Rest of South America Remotely Operated Vehicles Industry Revenue (Million) Forecast, by Application 2019 & 2032
- Table 93: Global Remotely Operated Vehicles Industry Revenue Million Forecast, by Type 2019 & 2032
- Table 94: Global Remotely Operated Vehicles Industry Revenue Million Forecast, by Application 2019 & 2032
- Table 95: Global Remotely Operated Vehicles Industry Revenue Million Forecast, by Activity 2019 & 2032
- Table 96: Global Remotely Operated Vehicles Industry Revenue Million Forecast, by Country 2019 & 2032
- Table 97: Saudi Arabia Remotely Operated Vehicles Industry Revenue (Million) Forecast, by Application 2019 & 2032
- Table 98: United Arab Emirates Remotely Operated Vehicles Industry Revenue (Million) Forecast, by Application 2019 & 2032
- Table 99: Nigeria Remotely Operated Vehicles Industry Revenue (Million) Forecast, by Application 2019 & 2032
- Table 100: South Africa Remotely Operated Vehicles Industry Revenue (Million) Forecast, by Application 2019 & 2032
- Table 101: Qatar Remotely Operated Vehicles Industry Revenue (Million) Forecast, by Application 2019 & 2032
- Table 102: Egypt Remotely Operated Vehicles Industry Revenue (Million) Forecast, by Application 2019 & 2032
- Table 103: Rest of Middle East and Africa Remotely Operated Vehicles Industry Revenue (Million) Forecast, by Application 2019 & 2032
Frequently Asked Questions
1. What is the projected Compound Annual Growth Rate (CAGR) of the Remotely Operated Vehicles Industry?
The projected CAGR is approximately 7.65%.
2. Which companies are prominent players in the Remotely Operated Vehicles Industry?
Key companies in the market include DOF Subsea AS, Helix Energy Solutions Group Inc, Fugro NV, Saab Seaeye Limited, Oceaneering International Inc, Delta SubSea LLC, Saipem SpA, DeepOcean AS, Forum Energy Technologies Inc, ROVOP*List Not Exhaustive 6 4 List of Other Prominent Players6 5 Market Ranking/Share (%) Analysi, TechnipFMC PLC, Bourbon Corporation SA.
3. What are the main segments of the Remotely Operated Vehicles Industry?
The market segments include Type, Application, Activity.
4. Can you provide details about the market size?
The market size is estimated to be USD 2.39 Million as of 2022.
5. What are some drivers contributing to market growth?
4.; Increasing Offshore Oil & Gas Exploration Activities in the Americas. Asia-Pacific. and Middle East and Africa 4.; Growing Offshore Renewable Technologies.
6. What are the notable trends driving market growth?
The Oil & Gas Application Segment is Expected to Dominate the Market.
7. Are there any restraints impacting market growth?
4.; Ban on Offshore Exploration and Production Activities in Multiple Regions.
8. Can you provide examples of recent developments in the market?
April 2024: Forssea Robotics, a French company, introduced its remotely operated vehicle (ROV) ARGOS-X. The vehicle is developed for integration with uncrewed surface vessels and shallow water deployments.
9. What pricing options are available for accessing the report?
Pricing options include single-user, multi-user, and enterprise licenses priced at USD 4750, USD 5250, and USD 8750 respectively.
10. Is the market size provided in terms of value or volume?
The market size is provided in terms of value, measured in Million.
11. Are there any specific market keywords associated with the report?
Yes, the market keyword associated with the report is "Remotely Operated Vehicles Industry," which aids in identifying and referencing the specific market segment covered.
12. How do I determine which pricing option suits my needs best?
The pricing options vary based on user requirements and access needs. Individual users may opt for single-user licenses, while businesses requiring broader access may choose multi-user or enterprise licenses for cost-effective access to the report.
13. Are there any additional resources or data provided in the Remotely Operated Vehicles Industry report?
While the report offers comprehensive insights, it's advisable to review the specific contents or supplementary materials provided to ascertain if additional resources or data are available.
14. How can I stay updated on further developments or reports in the Remotely Operated Vehicles Industry?
To stay informed about further developments, trends, and reports in the Remotely Operated Vehicles Industry, consider subscribing to industry newsletters, following relevant companies and organizations, or regularly checking reputable industry news sources and publications.
Methodology
Step 1 - Identification of Relevant Samples Size from Population Database


Step 2 - Approaches for Defining Global Market Size (Value, Volume* & Price*)

Note*: In applicable scenarios
Step 3 - Data Sources
Primary Research
- Web Analytics
- Survey Reports
- Research Institute
- Latest Research Reports
- Opinion Leaders
Secondary Research
- Annual Reports
- White Paper
- Latest Press Release
- Industry Association
- Paid Database
- Investor Presentations

Step 4 - Data Triangulation
Involves using different sources of information in order to increase the validity of a study
These sources are likely to be stakeholders in a program - participants, other researchers, program staff, other community members, and so on.
Then we put all data in single framework & apply various statistical tools to find out the dynamic on the market.
During the analysis stage, feedback from the stakeholder groups would be compared to determine areas of agreement as well as areas of divergence
