

Key Insights
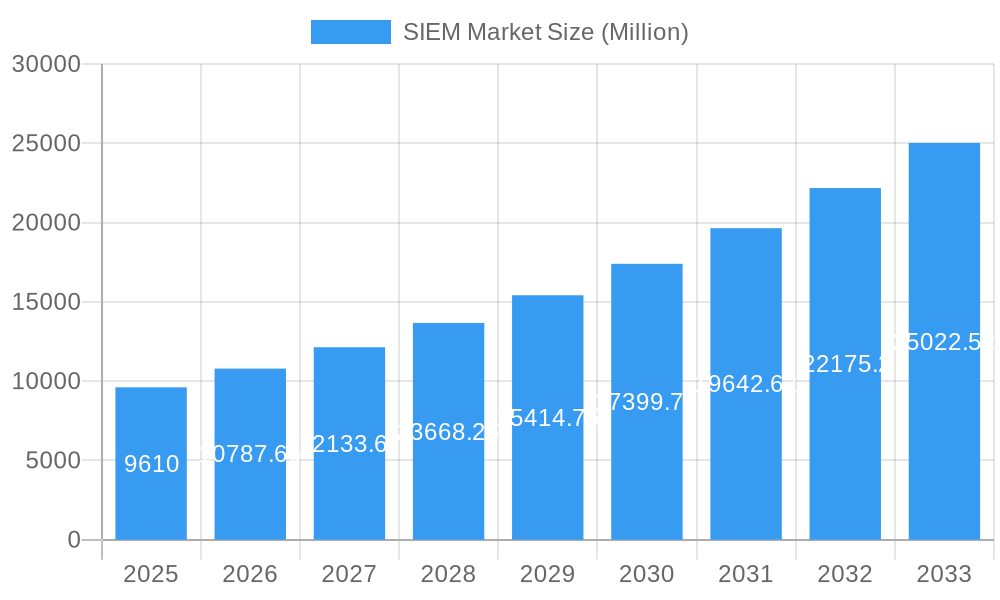
The global Security Information and Event Management (SIEM) market is experiencing robust growth, projected to reach \$9.61 billion in 2025 and maintain a Compound Annual Growth Rate (CAGR) of 12.16% from 2025 to 2033. This expansion is fueled by several key factors. The increasing frequency and sophistication of cyberattacks across diverse industries, from BFSI and healthcare to retail and manufacturing, necessitate robust security solutions. The rising adoption of cloud computing introduces new security challenges, driving demand for cloud-based SIEM solutions capable of managing and analyzing data from hybrid environments. Furthermore, stringent government regulations regarding data privacy and security compliance are compelling organizations of all sizes, from SMEs to large enterprises, to invest in advanced SIEM technologies. The market is also witnessing a shift towards Artificial Intelligence (AI) and Machine Learning (ML)-powered SIEM solutions that offer enhanced threat detection, response automation, and improved security posture management.
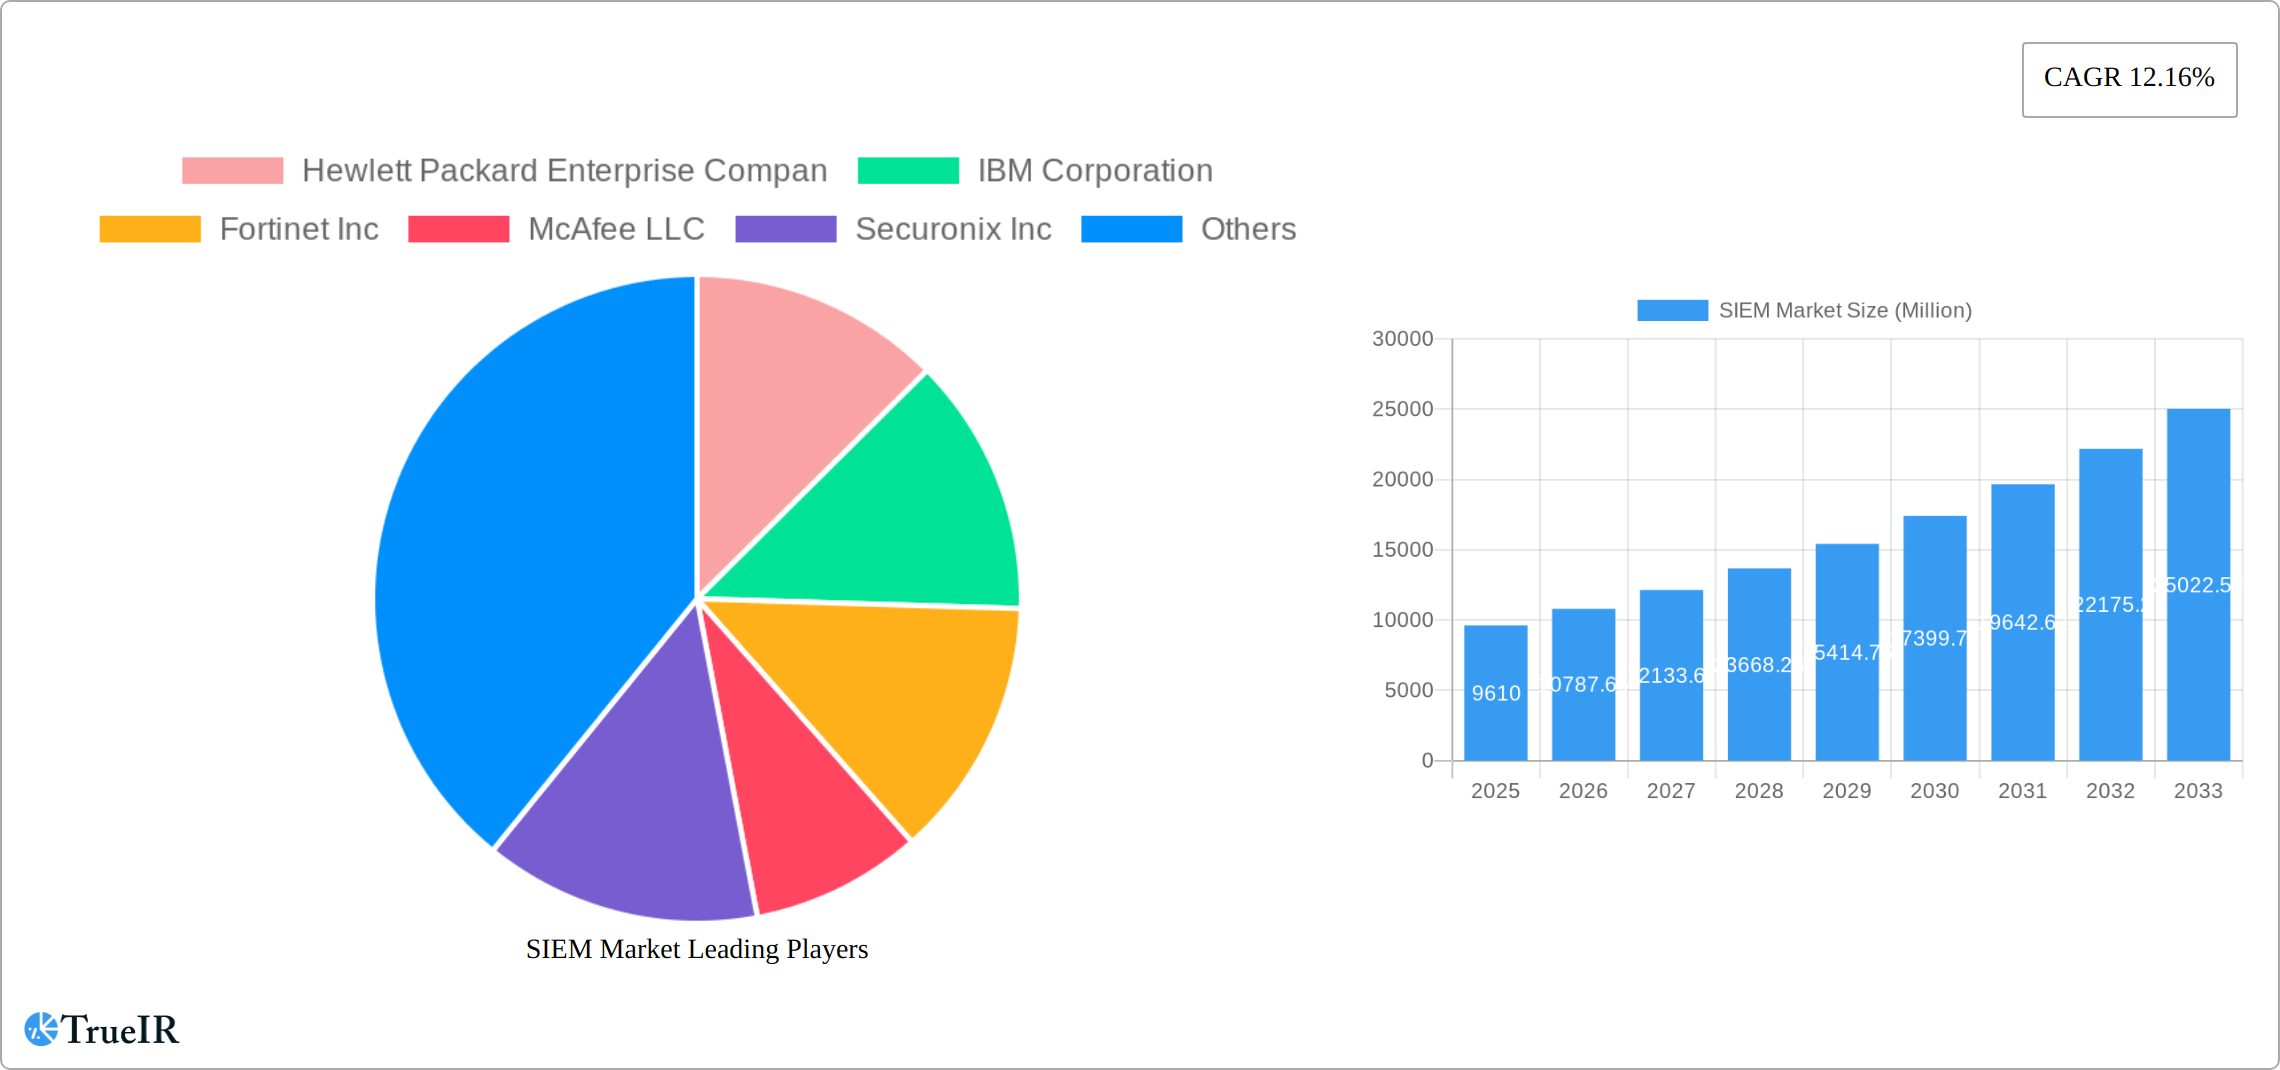
SIEM Market Market Size (In Billion)
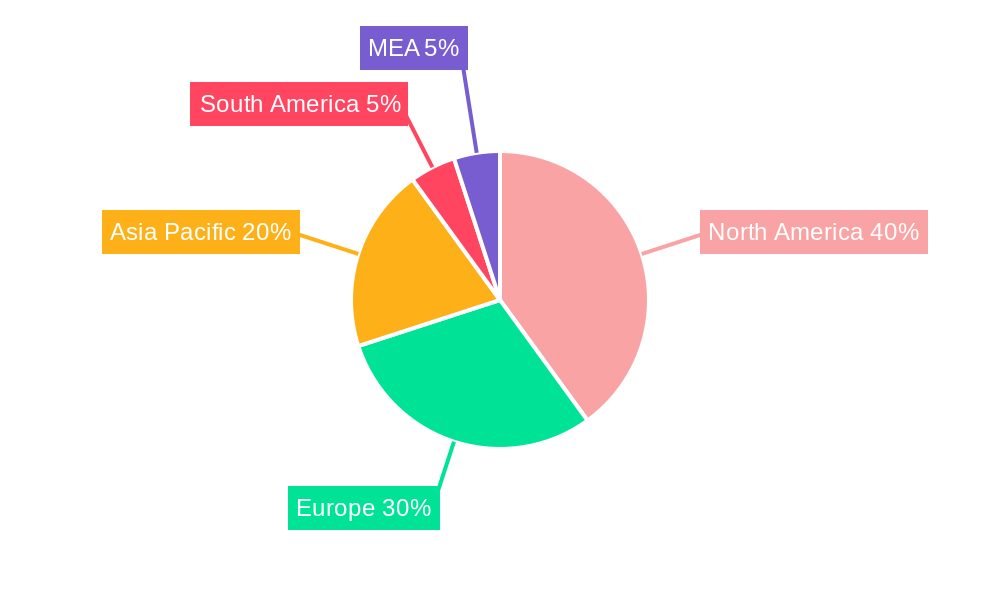
The market segmentation reveals significant opportunities across different deployment models (on-premise and cloud), organization types (SMEs and large enterprises), and end-user industries. While North America currently holds a dominant market share, regions like Asia-Pacific are expected to witness accelerated growth driven by increasing digitalization and rising cybersecurity awareness. The competitive landscape is dynamic, with established players like Hewlett Packard Enterprise, IBM, and Splunk competing alongside emerging innovative companies like Securonix and Exabeam. The continuous evolution of cyber threats necessitates ongoing innovation in SIEM technologies, focusing on advanced analytics, threat intelligence integration, and automation capabilities. This competitive environment fosters market growth through continuous improvement and feature expansion. Future market success will depend on companies' ability to adapt to evolving threat landscapes and offer scalable, user-friendly, and cost-effective solutions.
SIEM Market Company Market Share
SIEM Market Report: A Comprehensive Analysis (2019-2033)
This dynamic report provides a deep dive into the SIEM (Security Information and Event Management) market, offering invaluable insights for businesses, investors, and industry professionals. We analyze market size, growth drivers, competitive dynamics, and future trends, using data from the historical period (2019-2024), base year (2025), and forecast period (2025-2033). The report projects a market value exceeding xx Million by 2033, representing a significant CAGR.
SIEM Market Structure & Competitive Landscape
The SIEM market exhibits a moderately concentrated structure, with key players holding significant market share. However, the landscape is dynamic, influenced by continuous innovation, evolving regulatory compliance needs, and strategic mergers and acquisitions (M&A). The market is experiencing a surge in cloud-based solutions, challenging the dominance of on-premise deployments.
- Market Concentration: The Herfindahl-Hirschman Index (HHI) is estimated at xx, indicating a moderately concentrated market.
- Innovation Drivers: AI/ML integration, automation, threat intelligence enrichment, and cloud-native architectures are driving innovation.
- Regulatory Impacts: Increasing data privacy regulations (e.g., GDPR, CCPA) are fueling demand for robust SIEM solutions.
- Product Substitutes: While no direct substitutes exist, emerging technologies like SOAR (Security Orchestration, Automation, and Response) are impacting the market.
- End-User Segmentation: The market is segmented by deployment (on-premise, cloud), organization type (SMEs, large enterprises), and end-user industry (retail, BFSI, manufacturing, government, healthcare, others).
- M&A Trends: The past five years have witnessed xx M&A deals, with a trend towards consolidation among smaller players. This consolidation is expected to continue in the coming years.
SIEM Market Trends & Opportunities
The global SIEM market is experiencing robust growth, driven by the increasing sophistication of cyber threats and rising adoption of cloud technologies. The market size is projected to reach xx Million by 2025 and xx Million by 2033. This growth is fueled by several factors:
- Technological Advancements: The integration of AI and machine learning (ML) into SIEM solutions is enhancing threat detection and response capabilities. This shift is improving efficiency and reducing the reliance on manual intervention.
- Rising Cyberattacks: The escalating frequency and severity of cyberattacks across various industries are pushing organizations to invest heavily in robust security solutions, including SIEM.
- Cloud Adoption: The growing adoption of cloud computing is driving the demand for cloud-based SIEM solutions, which offer scalability, flexibility, and cost-effectiveness.
- Increased Regulatory Scrutiny: Stringent data privacy regulations are mandating organizations to implement robust security measures, including SIEM systems, to comply with legal requirements and mitigate potential risks.
- Shifting Consumer Preferences: Organizations are increasingly favoring solutions that offer comprehensive security capabilities, streamlined workflows, and effective threat intelligence integration.
Dominant Markets & Segments in SIEM Market
The North American region currently holds the largest market share, followed by Europe. This dominance is attributed to factors such as robust technological infrastructure, high cybersecurity awareness, and a significant concentration of large enterprises with complex IT environments. However, significant growth is observed in the Asia-Pacific region, driven by increasing digitalization and government initiatives promoting cybersecurity.
- By Deployment: Cloud-based SIEM solutions are experiencing exponential growth, surpassing on-premise deployments. This shift is fueled by their inherent scalability, cost-effectiveness, and accessibility. Hybrid deployment models are also gaining traction, offering a balance between on-premise security and cloud agility.
- By Organization Type: While large enterprises remain the primary consumers of SIEM solutions due to their intricate IT infrastructures and heightened security needs, the adoption rate among Small and Medium-sized Enterprises (SMEs) is rapidly increasing. This is largely driven by the availability of affordable, cloud-based SIEM solutions tailored to their specific needs and the rising awareness of cyber threats.
- By End-user Industry: The BFSI (Banking, Financial Services, and Insurance) sector continues to be a dominant force, driven by stringent regulatory compliance (e.g., GDPR, CCPA) and the protection of highly sensitive financial data. However, substantial growth is also witnessed in healthcare (HIPAA compliance), government (national security), manufacturing (critical infrastructure protection and OT/IT convergence), and retail (PCI DSS compliance) sectors.
Key Growth Drivers:
- BFSI: Stringent regulatory compliance mandates, increasing frequency and severity of data breaches, and the significant financial impact of data loss.
- Healthcare: Strict HIPAA and other global data privacy regulations, escalating cyberattacks targeting sensitive patient data, and the need for robust patient data protection.
- Government: National security concerns, protection of critical infrastructure, and the increasing sophistication of state-sponsored cyberattacks.
- Manufacturing: Protection of critical infrastructure, OT and IT convergence leading to increased attack surface, safeguarding intellectual property, and maintaining operational continuity.
- Retail: PCI DSS compliance, protection of customer payment data, and mitigating reputational damage from data breaches.
SIEM Market Product Analysis
SIEM products are evolving rapidly, integrating advanced analytics, AI/ML capabilities, and seamless threat intelligence feeds. This enables proactive threat detection, automated incident response, and improved security posture management. Key competitive advantages include ease of use, scalability, and integration with other security tools. The market is seeing the rise of cloud-native SIEM platforms that leverage the advantages of cloud infrastructure for scalability and agility.
Key Drivers, Barriers & Challenges in SIEM Market
Key Drivers:
The market's expansion is fueled by the escalating need for robust threat detection and response solutions in the face of increasingly sophisticated and pervasive cyberattacks. This demand is further amplified by technological advancements in Artificial Intelligence/Machine Learning (AI/ML), cloud computing, and sophisticated threat intelligence platforms, enabling more effective threat detection and response. The rise of extended detection and response (XDR) solutions is also a significant driver, integrating multiple security layers for improved visibility and response capabilities.
Challenges & Restraints:
High initial implementation costs, the complexity of integrating SIEM with existing security infrastructure (legacy systems), and the persistent shortage of skilled cybersecurity professionals remain significant hurdles to broader adoption. Furthermore, the rapidly evolving threat landscape necessitates continuous updates, upgrades, and adaptation, adding to the ongoing costs and operational complexity. Data volume and velocity, coupled with the need for real-time threat detection, also pose significant challenges.
Growth Drivers in the SIEM Market Market
The key drivers for growth are increasing cyber threats, stringent regulatory compliance mandates, the rise of cloud computing, and the adoption of advanced analytics and AI/ML in security solutions. The need for proactive threat detection and streamlined security operations is further accelerating market growth.
Challenges Impacting SIEM Market Growth
High initial investment costs, integration complexity, skills gap in cybersecurity professionals, and the constant evolution of threat landscapes present significant challenges. These factors impact the market's growth trajectory and require innovative solutions and proactive strategies.
Key Players Shaping the SIEM Market Market
Significant SIEM Market Industry Milestones
- November 2023: IBM launched a major update to its QRadar SIEM product, leveraging a cloud-native foundation and integrating Watsonx AI capabilities. This significantly enhanced its capabilities and market competitiveness, focusing on improved threat detection and response using AI-powered automation.
- April 2023: ManageEngine released the MSSP Edition of its Log360 Cloud SIEM solution, expanding its reach to managed security service providers (MSSPs). This strategic move broadened market access for cloud-based SIEM offerings and facilitated the growth of the MSSP ecosystem.
- [Add another recent milestone here with date and brief description]
Future Outlook for SIEM Market Market
The SIEM market is poised for continued strong growth, driven by persistent cyber threats, regulatory pressures, and technological innovation. Opportunities lie in the integration of AI/ML, automation, and threat intelligence into next-generation SIEM solutions. The expanding cloud-based SIEM segment will continue to dominate, creating significant growth potential for market players.
SIEM Market Segmentation
-
1. Deployment
- 1.1. On-premise
- 1.2. Cloud
-
2. Organisation Type
- 2.1. Small and Medium Enterprises (SMEs)
- 2.2. Large Enterprises
-
3. End-user Industry
- 3.1. Retail
- 3.2. BFSI
- 3.3. Manufacturing
- 3.4. Government
- 3.5. Healthcare
- 3.6. Other End-user Industries
SIEM Market Segmentation By Geography
-
1. North America
- 1.1. United States
- 1.2. Canada
-
2. Europe
- 2.1. Germany
- 2.2. United Kingdom
- 2.3. France
-
3. Asia
- 3.1. China
- 3.2. Japan
- 3.3. India
- 3.4. Australia and New Zealand
-
4. Latin America
- 4.1. Brazil
- 4.2. Argentina
-
5. Middle East and Africa
- 5.1. United Arab Emirates
SIEM Market Regional Market Share
Geographic Coverage of SIEM Market
SIEM Market REPORT HIGHLIGHTS
| Aspects | Details |
|---|---|
| Study Period | 2020-2034 |
| Base Year | 2025 |
| Estimated Year | 2026 |
| Forecast Period | 2026-2034 |
| Historical Period | 2020-2025 |
| Growth Rate | CAGR of 12.16% from 2020-2034 |
| Segmentation |
|
Table of Contents
- 1. Introduction
- 1.1. Research Scope
- 1.2. Market Segmentation
- 1.3. Research Methodology
- 1.4. Definitions and Assumptions
- 2. Executive Summary
- 2.1. Introduction
- 3. Market Dynamics
- 3.1. Introduction
- 3.2. Market Drivers
- 3.2.1. Growth in Security Concerns; Increasing Adoption of BYOD
- 3.3. Market Restrains
- 3.3.1. Lack of Skilled Labor
- 3.4. Market Trends
- 3.4.1. Cloud to Witness Significant Growth
- 4. Market Factor Analysis
- 4.1. Porters Five Forces
- 4.2. Supply/Value Chain
- 4.3. PESTEL analysis
- 4.4. Market Entropy
- 4.5. Patent/Trademark Analysis
- 5. Global SIEM Market Analysis, Insights and Forecast, 2020-2032
- 5.1. Market Analysis, Insights and Forecast - by Deployment
- 5.1.1. On-premise
- 5.1.2. Cloud
- 5.2. Market Analysis, Insights and Forecast - by Organisation Type
- 5.2.1. Small and Medium Enterprises (SMEs)
- 5.2.2. Large Enterprises
- 5.3. Market Analysis, Insights and Forecast - by End-user Industry
- 5.3.1. Retail
- 5.3.2. BFSI
- 5.3.3. Manufacturing
- 5.3.4. Government
- 5.3.5. Healthcare
- 5.3.6. Other End-user Industries
- 5.4. Market Analysis, Insights and Forecast - by Region
- 5.4.1. North America
- 5.4.2. Europe
- 5.4.3. Asia
- 5.4.4. Latin America
- 5.4.5. Middle East and Africa
- 5.1. Market Analysis, Insights and Forecast - by Deployment
- 6. North America SIEM Market Analysis, Insights and Forecast, 2020-2032
- 6.1. Market Analysis, Insights and Forecast - by Deployment
- 6.1.1. On-premise
- 6.1.2. Cloud
- 6.2. Market Analysis, Insights and Forecast - by Organisation Type
- 6.2.1. Small and Medium Enterprises (SMEs)
- 6.2.2. Large Enterprises
- 6.3. Market Analysis, Insights and Forecast - by End-user Industry
- 6.3.1. Retail
- 6.3.2. BFSI
- 6.3.3. Manufacturing
- 6.3.4. Government
- 6.3.5. Healthcare
- 6.3.6. Other End-user Industries
- 6.1. Market Analysis, Insights and Forecast - by Deployment
- 7. Europe SIEM Market Analysis, Insights and Forecast, 2020-2032
- 7.1. Market Analysis, Insights and Forecast - by Deployment
- 7.1.1. On-premise
- 7.1.2. Cloud
- 7.2. Market Analysis, Insights and Forecast - by Organisation Type
- 7.2.1. Small and Medium Enterprises (SMEs)
- 7.2.2. Large Enterprises
- 7.3. Market Analysis, Insights and Forecast - by End-user Industry
- 7.3.1. Retail
- 7.3.2. BFSI
- 7.3.3. Manufacturing
- 7.3.4. Government
- 7.3.5. Healthcare
- 7.3.6. Other End-user Industries
- 7.1. Market Analysis, Insights and Forecast - by Deployment
- 8. Asia SIEM Market Analysis, Insights and Forecast, 2020-2032
- 8.1. Market Analysis, Insights and Forecast - by Deployment
- 8.1.1. On-premise
- 8.1.2. Cloud
- 8.2. Market Analysis, Insights and Forecast - by Organisation Type
- 8.2.1. Small and Medium Enterprises (SMEs)
- 8.2.2. Large Enterprises
- 8.3. Market Analysis, Insights and Forecast - by End-user Industry
- 8.3.1. Retail
- 8.3.2. BFSI
- 8.3.3. Manufacturing
- 8.3.4. Government
- 8.3.5. Healthcare
- 8.3.6. Other End-user Industries
- 8.1. Market Analysis, Insights and Forecast - by Deployment
- 9. Latin America SIEM Market Analysis, Insights and Forecast, 2020-2032
- 9.1. Market Analysis, Insights and Forecast - by Deployment
- 9.1.1. On-premise
- 9.1.2. Cloud
- 9.2. Market Analysis, Insights and Forecast - by Organisation Type
- 9.2.1. Small and Medium Enterprises (SMEs)
- 9.2.2. Large Enterprises
- 9.3. Market Analysis, Insights and Forecast - by End-user Industry
- 9.3.1. Retail
- 9.3.2. BFSI
- 9.3.3. Manufacturing
- 9.3.4. Government
- 9.3.5. Healthcare
- 9.3.6. Other End-user Industries
- 9.1. Market Analysis, Insights and Forecast - by Deployment
- 10. Middle East and Africa SIEM Market Analysis, Insights and Forecast, 2020-2032
- 10.1. Market Analysis, Insights and Forecast - by Deployment
- 10.1.1. On-premise
- 10.1.2. Cloud
- 10.2. Market Analysis, Insights and Forecast - by Organisation Type
- 10.2.1. Small and Medium Enterprises (SMEs)
- 10.2.2. Large Enterprises
- 10.3. Market Analysis, Insights and Forecast - by End-user Industry
- 10.3.1. Retail
- 10.3.2. BFSI
- 10.3.3. Manufacturing
- 10.3.4. Government
- 10.3.5. Healthcare
- 10.3.6. Other End-user Industries
- 10.1. Market Analysis, Insights and Forecast - by Deployment
- 11. Competitive Analysis
- 11.1. Global Market Share Analysis 2025
- 11.2. Company Profiles
- 11.2.1 Hewlett Packard Enterprise Compan
- 11.2.1.1. Overview
- 11.2.1.2. Products
- 11.2.1.3. SWOT Analysis
- 11.2.1.4. Recent Developments
- 11.2.1.5. Financials (Based on Availability)
- 11.2.2 IBM Corporation
- 11.2.2.1. Overview
- 11.2.2.2. Products
- 11.2.2.3. SWOT Analysis
- 11.2.2.4. Recent Developments
- 11.2.2.5. Financials (Based on Availability)
- 11.2.3 Fortinet Inc
- 11.2.3.1. Overview
- 11.2.3.2. Products
- 11.2.3.3. SWOT Analysis
- 11.2.3.4. Recent Developments
- 11.2.3.5. Financials (Based on Availability)
- 11.2.4 McAfee LLC
- 11.2.4.1. Overview
- 11.2.4.2. Products
- 11.2.4.3. SWOT Analysis
- 11.2.4.4. Recent Developments
- 11.2.4.5. Financials (Based on Availability)
- 11.2.5 Securonix Inc
- 11.2.5.1. Overview
- 11.2.5.2. Products
- 11.2.5.3. SWOT Analysis
- 11.2.5.4. Recent Developments
- 11.2.5.5. Financials (Based on Availability)
- 11.2.6 Rapid7 Inc
- 11.2.6.1. Overview
- 11.2.6.2. Products
- 11.2.6.3. SWOT Analysis
- 11.2.6.4. Recent Developments
- 11.2.6.5. Financials (Based on Availability)
- 11.2.7 LogRhythm Inc
- 11.2.7.1. Overview
- 11.2.7.2. Products
- 11.2.7.3. SWOT Analysis
- 11.2.7.4. Recent Developments
- 11.2.7.5. Financials (Based on Availability)
- 11.2.8 RSA Security LLC (Dell Technologies)
- 11.2.8.1. Overview
- 11.2.8.2. Products
- 11.2.8.3. SWOT Analysis
- 11.2.8.4. Recent Developments
- 11.2.8.5. Financials (Based on Availability)
- 11.2.9 Open Text Corporation
- 11.2.9.1. Overview
- 11.2.9.2. Products
- 11.2.9.3. SWOT Analysis
- 11.2.9.4. Recent Developments
- 11.2.9.5. Financials (Based on Availability)
- 11.2.10 Exabeam Inc
- 11.2.10.1. Overview
- 11.2.10.2. Products
- 11.2.10.3. SWOT Analysis
- 11.2.10.4. Recent Developments
- 11.2.10.5. Financials (Based on Availability)
- 11.2.11 AlienVault Inc
- 11.2.11.1. Overview
- 11.2.11.2. Products
- 11.2.11.3. SWOT Analysis
- 11.2.11.4. Recent Developments
- 11.2.11.5. Financials (Based on Availability)
- 11.2.12 Splunk Inc
- 11.2.12.1. Overview
- 11.2.12.2. Products
- 11.2.12.3. SWOT Analysis
- 11.2.12.4. Recent Developments
- 11.2.12.5. Financials (Based on Availability)
- 11.2.1 Hewlett Packard Enterprise Compan
List of Figures
- Figure 1: Global SIEM Market Revenue Breakdown (Million, %) by Region 2025 & 2033
- Figure 2: North America SIEM Market Revenue (Million), by Deployment 2025 & 2033
- Figure 3: North America SIEM Market Revenue Share (%), by Deployment 2025 & 2033
- Figure 4: North America SIEM Market Revenue (Million), by Organisation Type 2025 & 2033
- Figure 5: North America SIEM Market Revenue Share (%), by Organisation Type 2025 & 2033
- Figure 6: North America SIEM Market Revenue (Million), by End-user Industry 2025 & 2033
- Figure 7: North America SIEM Market Revenue Share (%), by End-user Industry 2025 & 2033
- Figure 8: North America SIEM Market Revenue (Million), by Country 2025 & 2033
- Figure 9: North America SIEM Market Revenue Share (%), by Country 2025 & 2033
- Figure 10: Europe SIEM Market Revenue (Million), by Deployment 2025 & 2033
- Figure 11: Europe SIEM Market Revenue Share (%), by Deployment 2025 & 2033
- Figure 12: Europe SIEM Market Revenue (Million), by Organisation Type 2025 & 2033
- Figure 13: Europe SIEM Market Revenue Share (%), by Organisation Type 2025 & 2033
- Figure 14: Europe SIEM Market Revenue (Million), by End-user Industry 2025 & 2033
- Figure 15: Europe SIEM Market Revenue Share (%), by End-user Industry 2025 & 2033
- Figure 16: Europe SIEM Market Revenue (Million), by Country 2025 & 2033
- Figure 17: Europe SIEM Market Revenue Share (%), by Country 2025 & 2033
- Figure 18: Asia SIEM Market Revenue (Million), by Deployment 2025 & 2033
- Figure 19: Asia SIEM Market Revenue Share (%), by Deployment 2025 & 2033
- Figure 20: Asia SIEM Market Revenue (Million), by Organisation Type 2025 & 2033
- Figure 21: Asia SIEM Market Revenue Share (%), by Organisation Type 2025 & 2033
- Figure 22: Asia SIEM Market Revenue (Million), by End-user Industry 2025 & 2033
- Figure 23: Asia SIEM Market Revenue Share (%), by End-user Industry 2025 & 2033
- Figure 24: Asia SIEM Market Revenue (Million), by Country 2025 & 2033
- Figure 25: Asia SIEM Market Revenue Share (%), by Country 2025 & 2033
- Figure 26: Latin America SIEM Market Revenue (Million), by Deployment 2025 & 2033
- Figure 27: Latin America SIEM Market Revenue Share (%), by Deployment 2025 & 2033
- Figure 28: Latin America SIEM Market Revenue (Million), by Organisation Type 2025 & 2033
- Figure 29: Latin America SIEM Market Revenue Share (%), by Organisation Type 2025 & 2033
- Figure 30: Latin America SIEM Market Revenue (Million), by End-user Industry 2025 & 2033
- Figure 31: Latin America SIEM Market Revenue Share (%), by End-user Industry 2025 & 2033
- Figure 32: Latin America SIEM Market Revenue (Million), by Country 2025 & 2033
- Figure 33: Latin America SIEM Market Revenue Share (%), by Country 2025 & 2033
- Figure 34: Middle East and Africa SIEM Market Revenue (Million), by Deployment 2025 & 2033
- Figure 35: Middle East and Africa SIEM Market Revenue Share (%), by Deployment 2025 & 2033
- Figure 36: Middle East and Africa SIEM Market Revenue (Million), by Organisation Type 2025 & 2033
- Figure 37: Middle East and Africa SIEM Market Revenue Share (%), by Organisation Type 2025 & 2033
- Figure 38: Middle East and Africa SIEM Market Revenue (Million), by End-user Industry 2025 & 2033
- Figure 39: Middle East and Africa SIEM Market Revenue Share (%), by End-user Industry 2025 & 2033
- Figure 40: Middle East and Africa SIEM Market Revenue (Million), by Country 2025 & 2033
- Figure 41: Middle East and Africa SIEM Market Revenue Share (%), by Country 2025 & 2033
List of Tables
- Table 1: Global SIEM Market Revenue Million Forecast, by Deployment 2020 & 2033
- Table 2: Global SIEM Market Revenue Million Forecast, by Organisation Type 2020 & 2033
- Table 3: Global SIEM Market Revenue Million Forecast, by End-user Industry 2020 & 2033
- Table 4: Global SIEM Market Revenue Million Forecast, by Region 2020 & 2033
- Table 5: Global SIEM Market Revenue Million Forecast, by Deployment 2020 & 2033
- Table 6: Global SIEM Market Revenue Million Forecast, by Organisation Type 2020 & 2033
- Table 7: Global SIEM Market Revenue Million Forecast, by End-user Industry 2020 & 2033
- Table 8: Global SIEM Market Revenue Million Forecast, by Country 2020 & 2033
- Table 9: United States SIEM Market Revenue (Million) Forecast, by Application 2020 & 2033
- Table 10: Canada SIEM Market Revenue (Million) Forecast, by Application 2020 & 2033
- Table 11: Global SIEM Market Revenue Million Forecast, by Deployment 2020 & 2033
- Table 12: Global SIEM Market Revenue Million Forecast, by Organisation Type 2020 & 2033
- Table 13: Global SIEM Market Revenue Million Forecast, by End-user Industry 2020 & 2033
- Table 14: Global SIEM Market Revenue Million Forecast, by Country 2020 & 2033
- Table 15: Germany SIEM Market Revenue (Million) Forecast, by Application 2020 & 2033
- Table 16: United Kingdom SIEM Market Revenue (Million) Forecast, by Application 2020 & 2033
- Table 17: France SIEM Market Revenue (Million) Forecast, by Application 2020 & 2033
- Table 18: Global SIEM Market Revenue Million Forecast, by Deployment 2020 & 2033
- Table 19: Global SIEM Market Revenue Million Forecast, by Organisation Type 2020 & 2033
- Table 20: Global SIEM Market Revenue Million Forecast, by End-user Industry 2020 & 2033
- Table 21: Global SIEM Market Revenue Million Forecast, by Country 2020 & 2033
- Table 22: China SIEM Market Revenue (Million) Forecast, by Application 2020 & 2033
- Table 23: Japan SIEM Market Revenue (Million) Forecast, by Application 2020 & 2033
- Table 24: India SIEM Market Revenue (Million) Forecast, by Application 2020 & 2033
- Table 25: Australia and New Zealand SIEM Market Revenue (Million) Forecast, by Application 2020 & 2033
- Table 26: Global SIEM Market Revenue Million Forecast, by Deployment 2020 & 2033
- Table 27: Global SIEM Market Revenue Million Forecast, by Organisation Type 2020 & 2033
- Table 28: Global SIEM Market Revenue Million Forecast, by End-user Industry 2020 & 2033
- Table 29: Global SIEM Market Revenue Million Forecast, by Country 2020 & 2033
- Table 30: Brazil SIEM Market Revenue (Million) Forecast, by Application 2020 & 2033
- Table 31: Argentina SIEM Market Revenue (Million) Forecast, by Application 2020 & 2033
- Table 32: Global SIEM Market Revenue Million Forecast, by Deployment 2020 & 2033
- Table 33: Global SIEM Market Revenue Million Forecast, by Organisation Type 2020 & 2033
- Table 34: Global SIEM Market Revenue Million Forecast, by End-user Industry 2020 & 2033
- Table 35: Global SIEM Market Revenue Million Forecast, by Country 2020 & 2033
- Table 36: United Arab Emirates SIEM Market Revenue (Million) Forecast, by Application 2020 & 2033
Frequently Asked Questions
1. What is the projected Compound Annual Growth Rate (CAGR) of the SIEM Market?
The projected CAGR is approximately 12.16%.
2. Which companies are prominent players in the SIEM Market?
Key companies in the market include Hewlett Packard Enterprise Compan, IBM Corporation, Fortinet Inc, McAfee LLC, Securonix Inc, Rapid7 Inc, LogRhythm Inc, RSA Security LLC (Dell Technologies), Open Text Corporation, Exabeam Inc, AlienVault Inc, Splunk Inc.
3. What are the main segments of the SIEM Market?
The market segments include Deployment, Organisation Type, End-user Industry.
4. Can you provide details about the market size?
The market size is estimated to be USD 9.61 Million as of 2022.
5. What are some drivers contributing to market growth?
Growth in Security Concerns; Increasing Adoption of BYOD.
6. What are the notable trends driving market growth?
Cloud to Witness Significant Growth.
7. Are there any restraints impacting market growth?
Lack of Skilled Labor.
8. Can you provide examples of recent developments in the market?
November 2023: IBM unveiled a major update to its enterprise-ready threat detection and response (QRadar) SIEM product. The product has been re-engineered on a cloud-native foundation, designed for hybrid cloud scalability, speed, and flexibility. IBM also announced plans to deliver generic AI capabilities across its threat detection and response product portfolio – leveraging Watsonx, its enterprise data & AI platform.
9. What pricing options are available for accessing the report?
Pricing options include single-user, multi-user, and enterprise licenses priced at USD 4750, USD 5250, and USD 8750 respectively.
10. Is the market size provided in terms of value or volume?
The market size is provided in terms of value, measured in Million.
11. Are there any specific market keywords associated with the report?
Yes, the market keyword associated with the report is "SIEM Market," which aids in identifying and referencing the specific market segment covered.
12. How do I determine which pricing option suits my needs best?
The pricing options vary based on user requirements and access needs. Individual users may opt for single-user licenses, while businesses requiring broader access may choose multi-user or enterprise licenses for cost-effective access to the report.
13. Are there any additional resources or data provided in the SIEM Market report?
While the report offers comprehensive insights, it's advisable to review the specific contents or supplementary materials provided to ascertain if additional resources or data are available.
14. How can I stay updated on further developments or reports in the SIEM Market?
To stay informed about further developments, trends, and reports in the SIEM Market, consider subscribing to industry newsletters, following relevant companies and organizations, or regularly checking reputable industry news sources and publications.
Methodology
Step 1 - Identification of Relevant Samples Size from Population Database


Step 2 - Approaches for Defining Global Market Size (Value, Volume* & Price*)

Note*: In applicable scenarios
Step 3 - Data Sources
Primary Research
- Web Analytics
- Survey Reports
- Research Institute
- Latest Research Reports
- Opinion Leaders
Secondary Research
- Annual Reports
- White Paper
- Latest Press Release
- Industry Association
- Paid Database
- Investor Presentations

Step 4 - Data Triangulation
Involves using different sources of information in order to increase the validity of a study
These sources are likely to be stakeholders in a program - participants, other researchers, program staff, other community members, and so on.
Then we put all data in single framework & apply various statistical tools to find out the dynamic on the market.
During the analysis stage, feedback from the stakeholder groups would be compared to determine areas of agreement as well as areas of divergence