

Key Insights
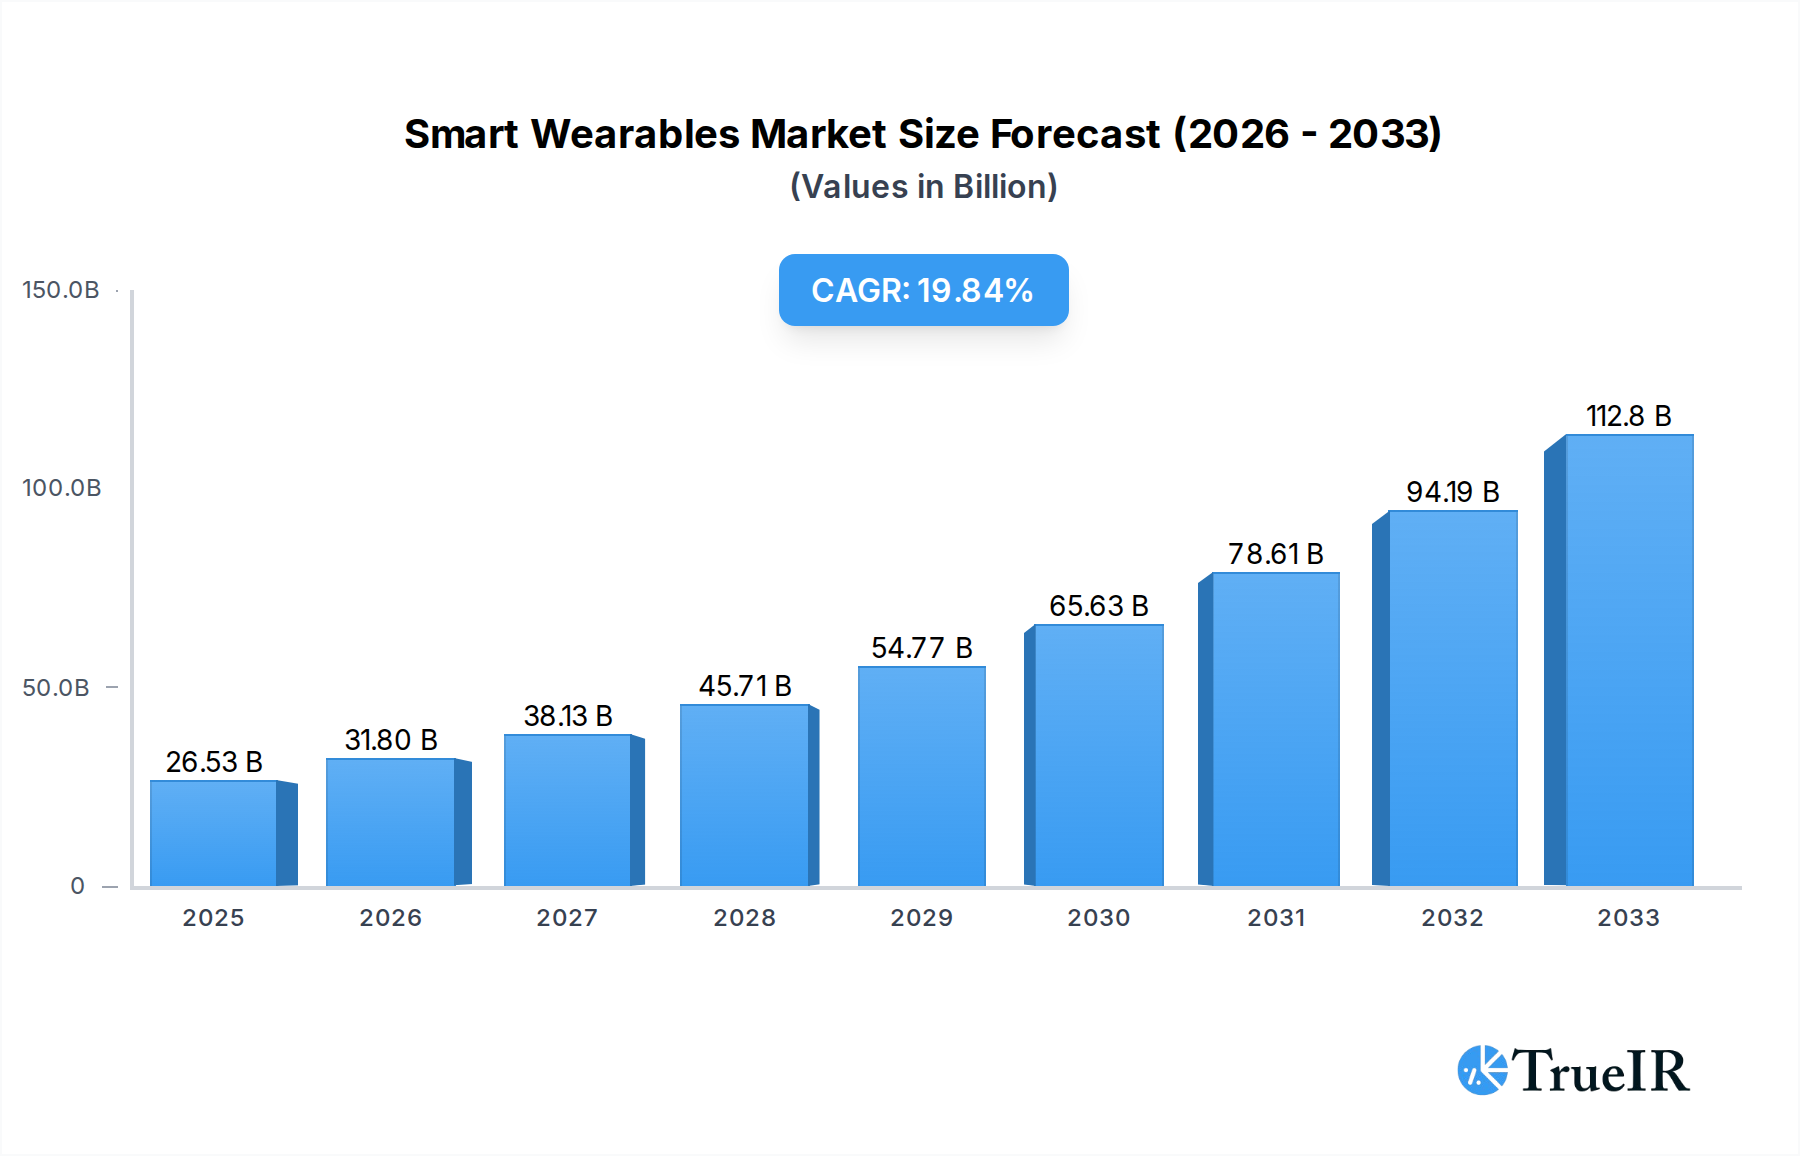
The global Smart Wearables market is poised for remarkable expansion, projected to reach USD 26.53 billion in 2025, driven by a compelling CAGR of 19.72%. This robust growth trajectory highlights the increasing consumer adoption of connected devices that seamlessly integrate into daily life for health, fitness, and information access. Key drivers fueling this surge include the escalating awareness of personal health and wellness, the continuous innovation in device functionalities such as advanced health monitoring and biometric tracking, and the growing integration of these devices with smartphones and other digital ecosystems. The burgeoning demand for personalized fitness regimes and the convenience offered by real-time data access are further cementing the market's upward momentum. Furthermore, the increasing affordability and stylistic diversification of smart wearables, from sophisticated smartwatches to discreet fitness bands and emerging smart glasses, are broadening their appeal across a wider demographic. This dynamic landscape is characterized by a fervent pursuit of enhanced user experience, extended battery life, and improved data security and privacy measures, all contributing to a vibrant and competitive market environment.

Smart Wearables Market Size (In Billion)
Looking ahead, the market is expected to witness sustained innovation and diversification. While fitness and wellness applications currently dominate, infotainment features are gaining significant traction, blurring the lines between dedicated health devices and comprehensive personal assistants. The competitive landscape is robust, featuring established giants like Apple, Samsung, and Fitbit alongside agile players such as Xiaomi and Garmin, all vying for market share through product differentiation and strategic partnerships. The market's growth is also significantly influenced by regional trends, with North America and Asia Pacific expected to lead in adoption rates due to higher disposable incomes and a tech-savvy population. However, emerging economies are also showing considerable promise, driven by increasing internet penetration and a growing middle class. Challenges such as data privacy concerns and the need for standardization across platforms are present, but the overarching trend of technological advancement and consumer demand for convenient, health-conscious solutions points towards a highly promising future for the smart wearables industry.
Smart Wearables Company Market Share
Smart Wearables Market Structure & Competitive Landscape
The global smart wearables market exhibits a dynamic and evolving competitive structure, characterized by a significant presence of both established technology giants and emerging innovators. Market concentration is moderately high, with leading players such as Apple, Samsung, and Xiaomi commanding substantial market share, estimated at over $120 billion in combined revenue. Innovation remains a primary driver, fueled by advancements in sensor technology, artificial intelligence, and miniaturization, enabling the development of increasingly sophisticated and personalized user experiences. Regulatory impacts, while currently less pronounced than in other tech sectors, are anticipated to grow, particularly concerning data privacy and security, with compliance costs potentially creating barriers for smaller entrants. Product substitutes, while limited in direct functionality, include traditional watches and smartphones, which may fulfill some, but not all, smart wearable use cases. End-user segmentation reveals a growing demand for fitness and wellness applications, alongside a rising interest in infotainment features, diversifying the market's appeal. Mergers and acquisitions (M&A) activity, though not at peak levels, is strategically driven, with larger players acquiring innovative startups to gain access to new technologies and market segments. The volume of M&A transactions in the historical period (2019-2024) is estimated to be in the billions.
Smart Wearables Market Trends & Opportunities
The smart wearables market is on an unprecedented growth trajectory, projected to reach a colossal market size exceeding $250 billion by 2033. This explosive expansion is underpinned by a compound annual growth rate (CAGR) of approximately 15.8% during the forecast period of 2025–2033. Technological shifts are the bedrock of this surge, with continuous advancements in areas such as bio-sensing capabilities, extended battery life, enhanced connectivity (5G integration), and the seamless integration of artificial intelligence for personalized insights and predictive analytics. The evolution from basic fitness trackers to sophisticated smartwatches and even nascent smart glasses is a testament to this technological evolution. Consumer preferences are increasingly leaning towards devices that offer holistic health monitoring, proactive wellness management, and seamless integration into daily life for enhanced productivity and entertainment. The demand for personalized health data, real-time coaching, and stress management tools is accelerating adoption across diverse demographics.
Competitive dynamics are intensifying, with established players like Apple, Samsung, and Garmin fiercely competing through innovation, ecosystem integration, and aggressive marketing. Xiaomi and Huawei are making significant inroads, particularly in emerging markets, by offering compelling value propositions. Smaller, specialized brands are carving out niches by focusing on specific functionalities like advanced sports tracking or unique design aesthetics. The market penetration rate, already significant in developed economies, is poised to surge globally as device costs decrease and awareness of the benefits of connected health and lifestyle management grows. Opportunities abound for companies that can leverage these trends. The development of specialized smart wearables for niche applications, such as elderly care monitoring, industrial safety, or advanced athletic performance analysis, presents substantial untapped potential. Furthermore, the integration of wearables with broader IoT ecosystems, including smart homes and connected vehicles, will unlock new use cases and revenue streams. The growing emphasis on preventative healthcare and the increasing prevalence of chronic diseases are major catalysts, driving demand for wearable health monitoring solutions. The expanding digital health landscape and the increasing comfort of consumers with sharing health data further bolster the market's prospects. The expansion of the gig economy and the need for flexible, connected work solutions also contribute to the demand for smart wearables that enhance productivity and communication on the go. The rising disposable incomes in developing economies, coupled with increasing health consciousness, are opening up new frontiers for market expansion. The advent of more sophisticated diagnostic capabilities within wearables, such as non-invasive blood glucose monitoring, represents a significant technological leap that could revolutionize healthcare and drive unprecedented market growth.
Dominant Markets & Segments in Smart Wearables
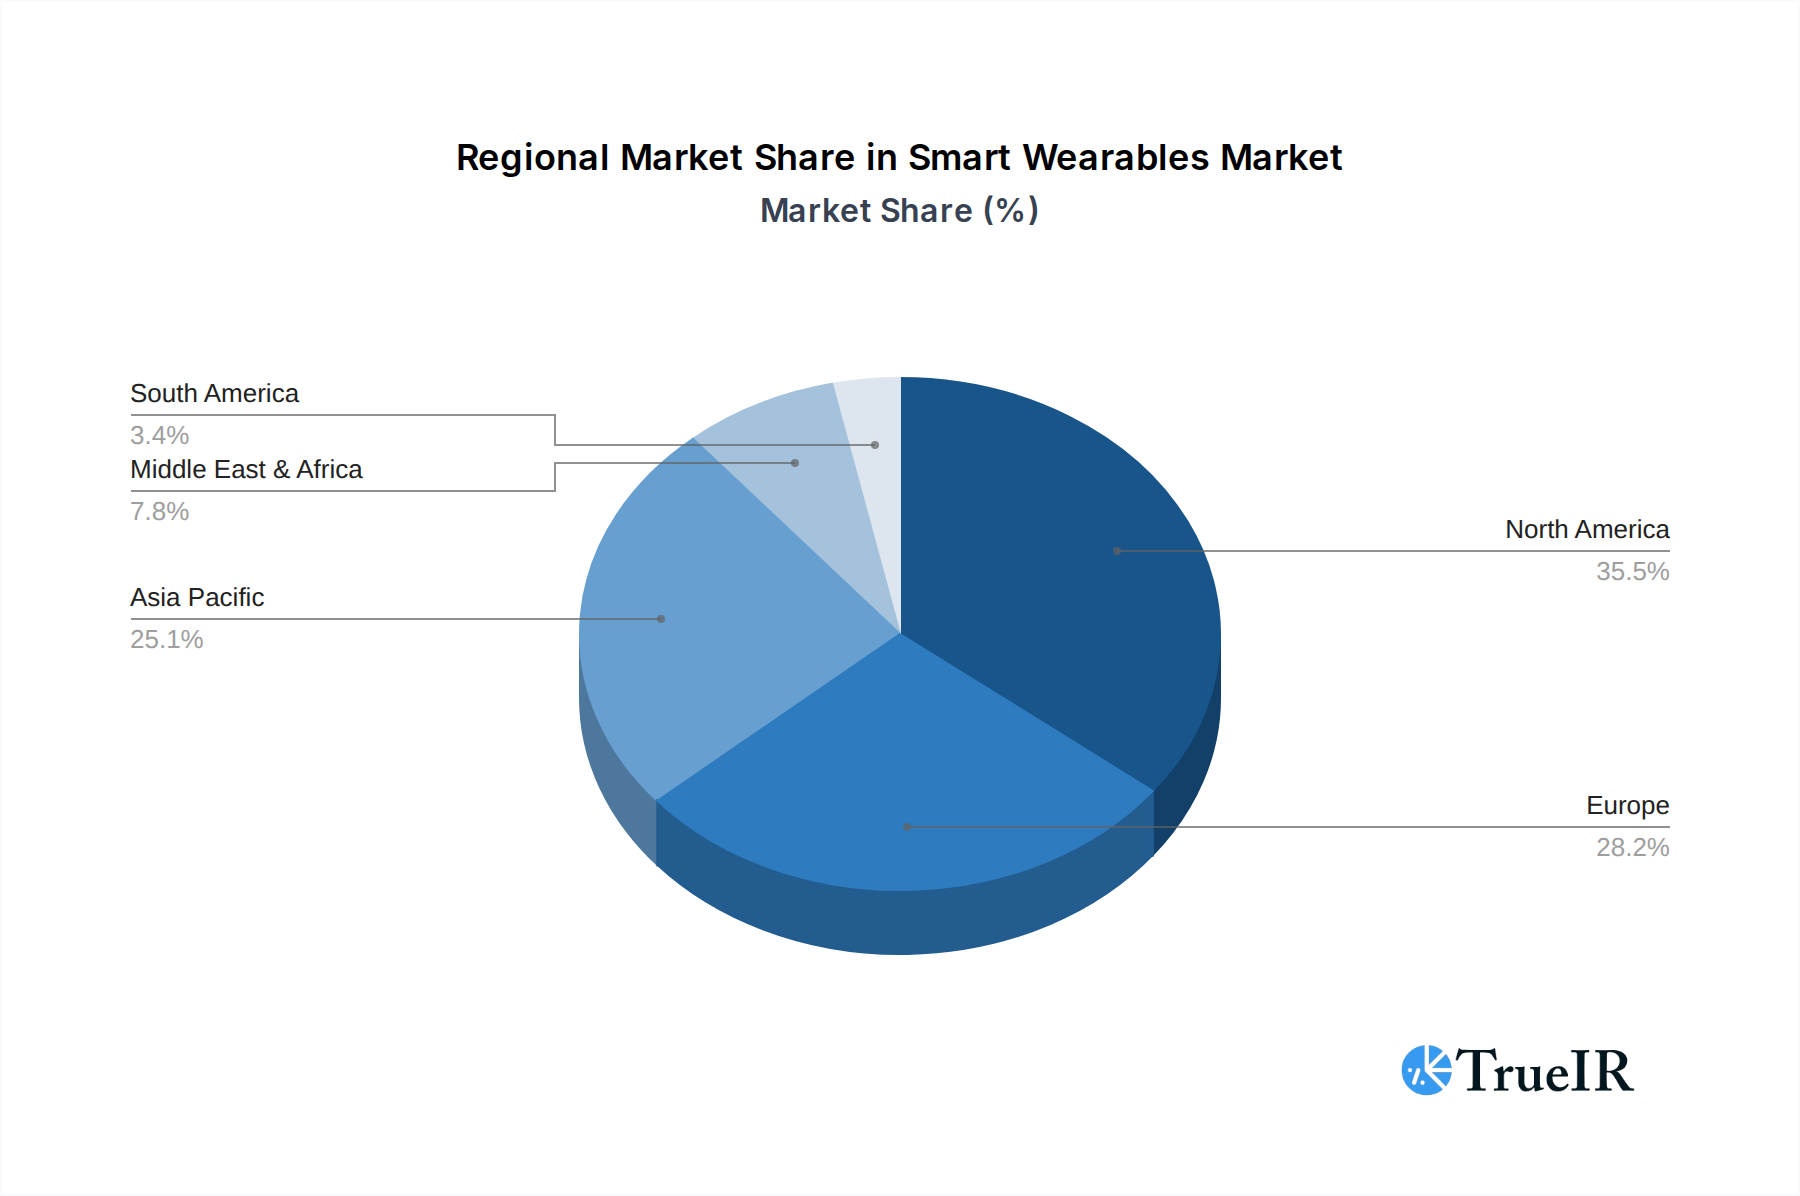
The global smart wearables market is characterized by dominant regions and highly influential segments, demonstrating a clear hierarchy of demand and adoption. North America and Europe currently lead in market penetration and revenue, driven by high disposable incomes, advanced technological infrastructure, and a strong consumer focus on health and wellness. However, the Asia-Pacific region, particularly China and India, is exhibiting the fastest growth, fueled by a burgeoning middle class, increasing health awareness, and aggressive market expansion by local players like Xiaomi and Huawei.
Within the Application segment, Fitness and Wellness reigns supreme, accounting for a substantial portion of the market, estimated at over $150 billion in revenue during the forecast period. This dominance is propelled by:
- Growing Health Consciousness: A global trend towards proactive health management, preventative care, and an active lifestyle.
- Advanced Health Monitoring Features: Integration of sophisticated sensors for heart rate, SpO2, sleep tracking, ECG, and stress detection.
- Gamification and Social Features: Engagement through fitness challenges, leaderboards, and community interaction encouraging consistent usage.
- Integration with Digital Health Platforms: Seamless data sharing with healthcare providers and wellness apps.
The Infotainment segment is also experiencing robust growth, driven by the desire for convenience and enhanced user experience. This includes features like:
- Smart Notifications: Receiving calls, texts, and app alerts directly on the wrist.
- Music Control and Playback: Seamless management of audio content.
- Contactless Payments: Facilitating quick and secure transactions.
- Voice Assistants: Enabling hands-free control and information retrieval.
In terms of Types, Smart Watches are the dominant category, with a market value projected to exceed $180 billion by 2033. Their appeal stems from:
- Versatility: Combining fitness tracking, communication, and entertainment in a single device.
- Aesthetics and Personalization: Wide range of designs, customizable watch faces, and interchangeable straps appealing to fashion-conscious consumers.
- Technological Advancements: Continuous improvements in display technology, processing power, and battery efficiency.
- Ecosystem Integration: Seamless connectivity with smartphones and other smart devices within their respective ecosystems (e.g., Apple Watch with iOS).
Fitness Bands continue to hold a significant share, particularly in price-sensitive markets, offering core fitness tracking functionalities at a more accessible price point. Smart Glasses are an emerging category, with early adoption driven by niche applications in augmented reality and industrial use cases, though mass market penetration is still anticipated. The "Others" category, encompassing a variety of smart rings, patches, and other wearable form factors, represents a growing segment with potential for specialized applications.
Smart Wearables Product Analysis
Smart wearable products are characterized by rapid innovation, focusing on miniaturization, enhanced sensor accuracy, and seamless user experience. Key product advancements include sophisticated biometric sensors for real-time health monitoring (e.g., continuous glucose monitoring, advanced sleep stage analysis), extended battery life through energy-efficient chipsets, and improved connectivity via Bluetooth 5.x and Wi-Fi 6. Competitive advantages are derived from integrated ecosystems, intuitive user interfaces, and robust data analytics platforms that provide actionable health and lifestyle insights. The focus is increasingly on personalized wellness, early disease detection, and proactive health management, differentiating products beyond basic activity tracking.
Key Drivers, Barriers & Challenges in Smart Wearables
Key Drivers:
- Technological Advancements: Miniaturization of sensors, AI integration for personalized insights, and improved battery technology are fueling innovation and functionality.
- Growing Health and Wellness Consciousness: A global shift towards preventative healthcare and active lifestyles drives demand for health monitoring devices.
- Increased Disposable Income: Rising global affluence, particularly in emerging economies, makes advanced consumer electronics more accessible.
- Demand for Convenience and Connectivity: Wearables offer seamless integration into daily life for communication, payments, and information access.
- Expanding Digital Health Ecosystems: The integration of wearables with telehealth services and digital health platforms broadens their utility.
Barriers & Challenges:
- Data Privacy and Security Concerns: User apprehension regarding the collection and use of sensitive personal health data remains a significant hurdle.
- High Device Costs: Premium smartwatches and specialized wearables can still be prohibitively expensive for a large segment of the population.
- Battery Life Limitations: While improving, battery life remains a concern for continuous, multi-day usage of feature-rich devices.
- Regulatory Hurdles: Evolving regulations around medical device certification and data handling can slow down product development and market entry.
- Interoperability Issues: Lack of seamless compatibility between different brands and operating systems can fragment the user experience.
- Accuracy and Reliability of Sensors: Ensuring consistent and clinically validated accuracy of biometric sensors is critical for trust and adoption.
Growth Drivers in the Smart Wearables Market
The smart wearables market is experiencing robust growth propelled by several critical factors. Technologically, the relentless pursuit of miniaturization and enhanced sensor accuracy, coupled with the integration of advanced AI for personalized health analytics, is expanding device capabilities and appeal. Economically, rising disposable incomes globally, especially in emerging markets, are making these once-premium devices more accessible to a wider consumer base. Policy-driven factors, such as government initiatives promoting digital health and preventative care, further catalyze adoption. The increasing prevalence of chronic diseases and a growing societal emphasis on proactive health management create a fertile ground for devices offering continuous monitoring and early detection capabilities. Furthermore, the seamless integration of wearables into broader IoT ecosystems is unlocking new use cases and enhancing their value proposition for consumers seeking connected lifestyle solutions.
Challenges Impacting Smart Wearables Growth
Despite the promising growth trajectory, the smart wearables market faces significant challenges that can impede its expansion. Regulatory complexities surrounding data privacy and security, particularly concerning sensitive health information, pose a constant threat, requiring substantial compliance investments and potentially limiting the scope of data collection and analysis. Supply chain disruptions, as witnessed in recent years, can impact production volumes and increase manufacturing costs, affecting device availability and pricing. Competitive pressures are also intensifying, with numerous players vying for market share, leading to potential price wars and a struggle for differentiation. The perceived lack of compelling "must-have" features beyond basic fitness tracking for a segment of the population can also limit mainstream adoption. Furthermore, ensuring the long-term accuracy and reliability of sensor data for medical-grade applications remains a technical challenge, impacting user trust and the potential for clinical integration.
Key Players Shaping the Smart Wearables Market
- Apple
- Samsung
- Xiaomi
- Fitbit
- Garmin
- Huawei
- Polar
- Jawbone
- Misfit
- Razer
- BBK (XTC)
- Lifesense
- Moto
Significant Smart Wearables Industry Milestones
- 2019: Introduction of advanced ECG capabilities in leading smartwatches, enhancing cardiac monitoring.
- 2020: Increased focus on SpO2 (blood oxygen) tracking amidst global health events, driving demand for enhanced health features.
- 2021: Significant advancements in battery technology, enabling multi-day usage for more sophisticated devices.
- 2022: Growing integration of AI and machine learning for personalized health insights and predictive analytics.
- 2023: Emergence of specialized wearables for remote patient monitoring and chronic disease management gaining traction.
- 2024: Increased investment in R&D for non-invasive health sensing technologies, such as blood glucose monitoring.
Future Outlook for Smart Wearables Market
The future outlook for the smart wearables market is exceptionally bright, characterized by sustained growth and transformative innovation. Strategic opportunities lie in the continued evolution of health monitoring capabilities, with the potential for non-invasive diagnostics to revolutionize personal healthcare. The expansion of augmented and virtual reality integrations within smart glasses will unlock new immersive experiences. Furthermore, the seamless integration of wearables into the broader IoT ecosystem, including smart homes and autonomous vehicles, will create unparalleled convenience and utility. Market potential is immense as wearable technology becomes more personalized, predictive, and preventative, moving beyond passive tracking to actively guiding users towards healthier and more efficient lives, with a projected market value reaching hundreds of billions in the coming years.
Smart Wearables Segmentation
-
1. Application
- 1.1. Fitness and Wellness
- 1.2. Infotainment
-
2. Types
- 2.1. Fitness Band
- 2.2. Smart Watches
- 2.3. Smart Glasses
- 2.4. Others
Smart Wearables Segmentation By Geography
-
1. North America
- 1.1. United States
- 1.2. Canada
- 1.3. Mexico
-
2. South America
- 2.1. Brazil
- 2.2. Argentina
- 2.3. Rest of South America
-
3. Europe
- 3.1. United Kingdom
- 3.2. Germany
- 3.3. France
- 3.4. Italy
- 3.5. Spain
- 3.6. Russia
- 3.7. Benelux
- 3.8. Nordics
- 3.9. Rest of Europe
-
4. Middle East & Africa
- 4.1. Turkey
- 4.2. Israel
- 4.3. GCC
- 4.4. North Africa
- 4.5. South Africa
- 4.6. Rest of Middle East & Africa
-
5. Asia Pacific
- 5.1. China
- 5.2. India
- 5.3. Japan
- 5.4. South Korea
- 5.5. ASEAN
- 5.6. Oceania
- 5.7. Rest of Asia Pacific
Smart Wearables Regional Market Share
Geographic Coverage of Smart Wearables
Smart Wearables REPORT HIGHLIGHTS
| Aspects | Details |
|---|---|
| Study Period | 2020-2034 |
| Base Year | 2025 |
| Estimated Year | 2026 |
| Forecast Period | 2026-2034 |
| Historical Period | 2020-2025 |
| Growth Rate | CAGR of 19.72% from 2020-2034 |
| Segmentation |
|
Table of Contents
- 1. Introduction
- 1.1. Research Scope
- 1.2. Market Segmentation
- 1.3. Research Methodology
- 1.4. Definitions and Assumptions
- 2. Executive Summary
- 2.1. Introduction
- 3. Market Dynamics
- 3.1. Introduction
- 3.2. Market Drivers
- 3.3. Market Restrains
- 3.4. Market Trends
- 4. Market Factor Analysis
- 4.1. Porters Five Forces
- 4.2. Supply/Value Chain
- 4.3. PESTEL analysis
- 4.4. Market Entropy
- 4.5. Patent/Trademark Analysis
- 5. Global Smart Wearables Analysis, Insights and Forecast, 2020-2032
- 5.1. Market Analysis, Insights and Forecast - by Application
- 5.1.1. Fitness and Wellness
- 5.1.2. Infotainment
- 5.2. Market Analysis, Insights and Forecast - by Types
- 5.2.1. Fitness Band
- 5.2.2. Smart Watches
- 5.2.3. Smart Glasses
- 5.2.4. Others
- 5.3. Market Analysis, Insights and Forecast - by Region
- 5.3.1. North America
- 5.3.2. South America
- 5.3.3. Europe
- 5.3.4. Middle East & Africa
- 5.3.5. Asia Pacific
- 5.1. Market Analysis, Insights and Forecast - by Application
- 6. North America Smart Wearables Analysis, Insights and Forecast, 2020-2032
- 6.1. Market Analysis, Insights and Forecast - by Application
- 6.1.1. Fitness and Wellness
- 6.1.2. Infotainment
- 6.2. Market Analysis, Insights and Forecast - by Types
- 6.2.1. Fitness Band
- 6.2.2. Smart Watches
- 6.2.3. Smart Glasses
- 6.2.4. Others
- 6.1. Market Analysis, Insights and Forecast - by Application
- 7. South America Smart Wearables Analysis, Insights and Forecast, 2020-2032
- 7.1. Market Analysis, Insights and Forecast - by Application
- 7.1.1. Fitness and Wellness
- 7.1.2. Infotainment
- 7.2. Market Analysis, Insights and Forecast - by Types
- 7.2.1. Fitness Band
- 7.2.2. Smart Watches
- 7.2.3. Smart Glasses
- 7.2.4. Others
- 7.1. Market Analysis, Insights and Forecast - by Application
- 8. Europe Smart Wearables Analysis, Insights and Forecast, 2020-2032
- 8.1. Market Analysis, Insights and Forecast - by Application
- 8.1.1. Fitness and Wellness
- 8.1.2. Infotainment
- 8.2. Market Analysis, Insights and Forecast - by Types
- 8.2.1. Fitness Band
- 8.2.2. Smart Watches
- 8.2.3. Smart Glasses
- 8.2.4. Others
- 8.1. Market Analysis, Insights and Forecast - by Application
- 9. Middle East & Africa Smart Wearables Analysis, Insights and Forecast, 2020-2032
- 9.1. Market Analysis, Insights and Forecast - by Application
- 9.1.1. Fitness and Wellness
- 9.1.2. Infotainment
- 9.2. Market Analysis, Insights and Forecast - by Types
- 9.2.1. Fitness Band
- 9.2.2. Smart Watches
- 9.2.3. Smart Glasses
- 9.2.4. Others
- 9.1. Market Analysis, Insights and Forecast - by Application
- 10. Asia Pacific Smart Wearables Analysis, Insights and Forecast, 2020-2032
- 10.1. Market Analysis, Insights and Forecast - by Application
- 10.1.1. Fitness and Wellness
- 10.1.2. Infotainment
- 10.2. Market Analysis, Insights and Forecast - by Types
- 10.2.1. Fitness Band
- 10.2.2. Smart Watches
- 10.2.3. Smart Glasses
- 10.2.4. Others
- 10.1. Market Analysis, Insights and Forecast - by Application
- 11. Competitive Analysis
- 11.1. Global Market Share Analysis 2025
- 11.2. Company Profiles
- 11.2.1 Fitbit
- 11.2.1.1. Overview
- 11.2.1.2. Products
- 11.2.1.3. SWOT Analysis
- 11.2.1.4. Recent Developments
- 11.2.1.5. Financials (Based on Availability)
- 11.2.2 Xiaomi
- 11.2.2.1. Overview
- 11.2.2.2. Products
- 11.2.2.3. SWOT Analysis
- 11.2.2.4. Recent Developments
- 11.2.2.5. Financials (Based on Availability)
- 11.2.3 Apple
- 11.2.3.1. Overview
- 11.2.3.2. Products
- 11.2.3.3. SWOT Analysis
- 11.2.3.4. Recent Developments
- 11.2.3.5. Financials (Based on Availability)
- 11.2.4 Garmin
- 11.2.4.1. Overview
- 11.2.4.2. Products
- 11.2.4.3. SWOT Analysis
- 11.2.4.4. Recent Developments
- 11.2.4.5. Financials (Based on Availability)
- 11.2.5 Samsung
- 11.2.5.1. Overview
- 11.2.5.2. Products
- 11.2.5.3. SWOT Analysis
- 11.2.5.4. Recent Developments
- 11.2.5.5. Financials (Based on Availability)
- 11.2.6 Jawbone
- 11.2.6.1. Overview
- 11.2.6.2. Products
- 11.2.6.3. SWOT Analysis
- 11.2.6.4. Recent Developments
- 11.2.6.5. Financials (Based on Availability)
- 11.2.7 Misfit
- 11.2.7.1. Overview
- 11.2.7.2. Products
- 11.2.7.3. SWOT Analysis
- 11.2.7.4. Recent Developments
- 11.2.7.5. Financials (Based on Availability)
- 11.2.8 Polar
- 11.2.8.1. Overview
- 11.2.8.2. Products
- 11.2.8.3. SWOT Analysis
- 11.2.8.4. Recent Developments
- 11.2.8.5. Financials (Based on Availability)
- 11.2.9 Moto
- 11.2.9.1. Overview
- 11.2.9.2. Products
- 11.2.9.3. SWOT Analysis
- 11.2.9.4. Recent Developments
- 11.2.9.5. Financials (Based on Availability)
- 11.2.10 Huawei
- 11.2.10.1. Overview
- 11.2.10.2. Products
- 11.2.10.3. SWOT Analysis
- 11.2.10.4. Recent Developments
- 11.2.10.5. Financials (Based on Availability)
- 11.2.11 BBK(XTC)
- 11.2.11.1. Overview
- 11.2.11.2. Products
- 11.2.11.3. SWOT Analysis
- 11.2.11.4. Recent Developments
- 11.2.11.5. Financials (Based on Availability)
- 11.2.12 Lifesense
- 11.2.12.1. Overview
- 11.2.12.2. Products
- 11.2.12.3. SWOT Analysis
- 11.2.12.4. Recent Developments
- 11.2.12.5. Financials (Based on Availability)
- 11.2.13 Razer
- 11.2.13.1. Overview
- 11.2.13.2. Products
- 11.2.13.3. SWOT Analysis
- 11.2.13.4. Recent Developments
- 11.2.13.5. Financials (Based on Availability)
- 11.2.1 Fitbit
List of Figures
- Figure 1: Global Smart Wearables Revenue Breakdown (billion, %) by Region 2025 & 2033
- Figure 2: Global Smart Wearables Volume Breakdown (K, %) by Region 2025 & 2033
- Figure 3: North America Smart Wearables Revenue (billion), by Application 2025 & 2033
- Figure 4: North America Smart Wearables Volume (K), by Application 2025 & 2033
- Figure 5: North America Smart Wearables Revenue Share (%), by Application 2025 & 2033
- Figure 6: North America Smart Wearables Volume Share (%), by Application 2025 & 2033
- Figure 7: North America Smart Wearables Revenue (billion), by Types 2025 & 2033
- Figure 8: North America Smart Wearables Volume (K), by Types 2025 & 2033
- Figure 9: North America Smart Wearables Revenue Share (%), by Types 2025 & 2033
- Figure 10: North America Smart Wearables Volume Share (%), by Types 2025 & 2033
- Figure 11: North America Smart Wearables Revenue (billion), by Country 2025 & 2033
- Figure 12: North America Smart Wearables Volume (K), by Country 2025 & 2033
- Figure 13: North America Smart Wearables Revenue Share (%), by Country 2025 & 2033
- Figure 14: North America Smart Wearables Volume Share (%), by Country 2025 & 2033
- Figure 15: South America Smart Wearables Revenue (billion), by Application 2025 & 2033
- Figure 16: South America Smart Wearables Volume (K), by Application 2025 & 2033
- Figure 17: South America Smart Wearables Revenue Share (%), by Application 2025 & 2033
- Figure 18: South America Smart Wearables Volume Share (%), by Application 2025 & 2033
- Figure 19: South America Smart Wearables Revenue (billion), by Types 2025 & 2033
- Figure 20: South America Smart Wearables Volume (K), by Types 2025 & 2033
- Figure 21: South America Smart Wearables Revenue Share (%), by Types 2025 & 2033
- Figure 22: South America Smart Wearables Volume Share (%), by Types 2025 & 2033
- Figure 23: South America Smart Wearables Revenue (billion), by Country 2025 & 2033
- Figure 24: South America Smart Wearables Volume (K), by Country 2025 & 2033
- Figure 25: South America Smart Wearables Revenue Share (%), by Country 2025 & 2033
- Figure 26: South America Smart Wearables Volume Share (%), by Country 2025 & 2033
- Figure 27: Europe Smart Wearables Revenue (billion), by Application 2025 & 2033
- Figure 28: Europe Smart Wearables Volume (K), by Application 2025 & 2033
- Figure 29: Europe Smart Wearables Revenue Share (%), by Application 2025 & 2033
- Figure 30: Europe Smart Wearables Volume Share (%), by Application 2025 & 2033
- Figure 31: Europe Smart Wearables Revenue (billion), by Types 2025 & 2033
- Figure 32: Europe Smart Wearables Volume (K), by Types 2025 & 2033
- Figure 33: Europe Smart Wearables Revenue Share (%), by Types 2025 & 2033
- Figure 34: Europe Smart Wearables Volume Share (%), by Types 2025 & 2033
- Figure 35: Europe Smart Wearables Revenue (billion), by Country 2025 & 2033
- Figure 36: Europe Smart Wearables Volume (K), by Country 2025 & 2033
- Figure 37: Europe Smart Wearables Revenue Share (%), by Country 2025 & 2033
- Figure 38: Europe Smart Wearables Volume Share (%), by Country 2025 & 2033
- Figure 39: Middle East & Africa Smart Wearables Revenue (billion), by Application 2025 & 2033
- Figure 40: Middle East & Africa Smart Wearables Volume (K), by Application 2025 & 2033
- Figure 41: Middle East & Africa Smart Wearables Revenue Share (%), by Application 2025 & 2033
- Figure 42: Middle East & Africa Smart Wearables Volume Share (%), by Application 2025 & 2033
- Figure 43: Middle East & Africa Smart Wearables Revenue (billion), by Types 2025 & 2033
- Figure 44: Middle East & Africa Smart Wearables Volume (K), by Types 2025 & 2033
- Figure 45: Middle East & Africa Smart Wearables Revenue Share (%), by Types 2025 & 2033
- Figure 46: Middle East & Africa Smart Wearables Volume Share (%), by Types 2025 & 2033
- Figure 47: Middle East & Africa Smart Wearables Revenue (billion), by Country 2025 & 2033
- Figure 48: Middle East & Africa Smart Wearables Volume (K), by Country 2025 & 2033
- Figure 49: Middle East & Africa Smart Wearables Revenue Share (%), by Country 2025 & 2033
- Figure 50: Middle East & Africa Smart Wearables Volume Share (%), by Country 2025 & 2033
- Figure 51: Asia Pacific Smart Wearables Revenue (billion), by Application 2025 & 2033
- Figure 52: Asia Pacific Smart Wearables Volume (K), by Application 2025 & 2033
- Figure 53: Asia Pacific Smart Wearables Revenue Share (%), by Application 2025 & 2033
- Figure 54: Asia Pacific Smart Wearables Volume Share (%), by Application 2025 & 2033
- Figure 55: Asia Pacific Smart Wearables Revenue (billion), by Types 2025 & 2033
- Figure 56: Asia Pacific Smart Wearables Volume (K), by Types 2025 & 2033
- Figure 57: Asia Pacific Smart Wearables Revenue Share (%), by Types 2025 & 2033
- Figure 58: Asia Pacific Smart Wearables Volume Share (%), by Types 2025 & 2033
- Figure 59: Asia Pacific Smart Wearables Revenue (billion), by Country 2025 & 2033
- Figure 60: Asia Pacific Smart Wearables Volume (K), by Country 2025 & 2033
- Figure 61: Asia Pacific Smart Wearables Revenue Share (%), by Country 2025 & 2033
- Figure 62: Asia Pacific Smart Wearables Volume Share (%), by Country 2025 & 2033
List of Tables
- Table 1: Global Smart Wearables Revenue billion Forecast, by Application 2020 & 2033
- Table 2: Global Smart Wearables Volume K Forecast, by Application 2020 & 2033
- Table 3: Global Smart Wearables Revenue billion Forecast, by Types 2020 & 2033
- Table 4: Global Smart Wearables Volume K Forecast, by Types 2020 & 2033
- Table 5: Global Smart Wearables Revenue billion Forecast, by Region 2020 & 2033
- Table 6: Global Smart Wearables Volume K Forecast, by Region 2020 & 2033
- Table 7: Global Smart Wearables Revenue billion Forecast, by Application 2020 & 2033
- Table 8: Global Smart Wearables Volume K Forecast, by Application 2020 & 2033
- Table 9: Global Smart Wearables Revenue billion Forecast, by Types 2020 & 2033
- Table 10: Global Smart Wearables Volume K Forecast, by Types 2020 & 2033
- Table 11: Global Smart Wearables Revenue billion Forecast, by Country 2020 & 2033
- Table 12: Global Smart Wearables Volume K Forecast, by Country 2020 & 2033
- Table 13: United States Smart Wearables Revenue (billion) Forecast, by Application 2020 & 2033
- Table 14: United States Smart Wearables Volume (K) Forecast, by Application 2020 & 2033
- Table 15: Canada Smart Wearables Revenue (billion) Forecast, by Application 2020 & 2033
- Table 16: Canada Smart Wearables Volume (K) Forecast, by Application 2020 & 2033
- Table 17: Mexico Smart Wearables Revenue (billion) Forecast, by Application 2020 & 2033
- Table 18: Mexico Smart Wearables Volume (K) Forecast, by Application 2020 & 2033
- Table 19: Global Smart Wearables Revenue billion Forecast, by Application 2020 & 2033
- Table 20: Global Smart Wearables Volume K Forecast, by Application 2020 & 2033
- Table 21: Global Smart Wearables Revenue billion Forecast, by Types 2020 & 2033
- Table 22: Global Smart Wearables Volume K Forecast, by Types 2020 & 2033
- Table 23: Global Smart Wearables Revenue billion Forecast, by Country 2020 & 2033
- Table 24: Global Smart Wearables Volume K Forecast, by Country 2020 & 2033
- Table 25: Brazil Smart Wearables Revenue (billion) Forecast, by Application 2020 & 2033
- Table 26: Brazil Smart Wearables Volume (K) Forecast, by Application 2020 & 2033
- Table 27: Argentina Smart Wearables Revenue (billion) Forecast, by Application 2020 & 2033
- Table 28: Argentina Smart Wearables Volume (K) Forecast, by Application 2020 & 2033
- Table 29: Rest of South America Smart Wearables Revenue (billion) Forecast, by Application 2020 & 2033
- Table 30: Rest of South America Smart Wearables Volume (K) Forecast, by Application 2020 & 2033
- Table 31: Global Smart Wearables Revenue billion Forecast, by Application 2020 & 2033
- Table 32: Global Smart Wearables Volume K Forecast, by Application 2020 & 2033
- Table 33: Global Smart Wearables Revenue billion Forecast, by Types 2020 & 2033
- Table 34: Global Smart Wearables Volume K Forecast, by Types 2020 & 2033
- Table 35: Global Smart Wearables Revenue billion Forecast, by Country 2020 & 2033
- Table 36: Global Smart Wearables Volume K Forecast, by Country 2020 & 2033
- Table 37: United Kingdom Smart Wearables Revenue (billion) Forecast, by Application 2020 & 2033
- Table 38: United Kingdom Smart Wearables Volume (K) Forecast, by Application 2020 & 2033
- Table 39: Germany Smart Wearables Revenue (billion) Forecast, by Application 2020 & 2033
- Table 40: Germany Smart Wearables Volume (K) Forecast, by Application 2020 & 2033
- Table 41: France Smart Wearables Revenue (billion) Forecast, by Application 2020 & 2033
- Table 42: France Smart Wearables Volume (K) Forecast, by Application 2020 & 2033
- Table 43: Italy Smart Wearables Revenue (billion) Forecast, by Application 2020 & 2033
- Table 44: Italy Smart Wearables Volume (K) Forecast, by Application 2020 & 2033
- Table 45: Spain Smart Wearables Revenue (billion) Forecast, by Application 2020 & 2033
- Table 46: Spain Smart Wearables Volume (K) Forecast, by Application 2020 & 2033
- Table 47: Russia Smart Wearables Revenue (billion) Forecast, by Application 2020 & 2033
- Table 48: Russia Smart Wearables Volume (K) Forecast, by Application 2020 & 2033
- Table 49: Benelux Smart Wearables Revenue (billion) Forecast, by Application 2020 & 2033
- Table 50: Benelux Smart Wearables Volume (K) Forecast, by Application 2020 & 2033
- Table 51: Nordics Smart Wearables Revenue (billion) Forecast, by Application 2020 & 2033
- Table 52: Nordics Smart Wearables Volume (K) Forecast, by Application 2020 & 2033
- Table 53: Rest of Europe Smart Wearables Revenue (billion) Forecast, by Application 2020 & 2033
- Table 54: Rest of Europe Smart Wearables Volume (K) Forecast, by Application 2020 & 2033
- Table 55: Global Smart Wearables Revenue billion Forecast, by Application 2020 & 2033
- Table 56: Global Smart Wearables Volume K Forecast, by Application 2020 & 2033
- Table 57: Global Smart Wearables Revenue billion Forecast, by Types 2020 & 2033
- Table 58: Global Smart Wearables Volume K Forecast, by Types 2020 & 2033
- Table 59: Global Smart Wearables Revenue billion Forecast, by Country 2020 & 2033
- Table 60: Global Smart Wearables Volume K Forecast, by Country 2020 & 2033
- Table 61: Turkey Smart Wearables Revenue (billion) Forecast, by Application 2020 & 2033
- Table 62: Turkey Smart Wearables Volume (K) Forecast, by Application 2020 & 2033
- Table 63: Israel Smart Wearables Revenue (billion) Forecast, by Application 2020 & 2033
- Table 64: Israel Smart Wearables Volume (K) Forecast, by Application 2020 & 2033
- Table 65: GCC Smart Wearables Revenue (billion) Forecast, by Application 2020 & 2033
- Table 66: GCC Smart Wearables Volume (K) Forecast, by Application 2020 & 2033
- Table 67: North Africa Smart Wearables Revenue (billion) Forecast, by Application 2020 & 2033
- Table 68: North Africa Smart Wearables Volume (K) Forecast, by Application 2020 & 2033
- Table 69: South Africa Smart Wearables Revenue (billion) Forecast, by Application 2020 & 2033
- Table 70: South Africa Smart Wearables Volume (K) Forecast, by Application 2020 & 2033
- Table 71: Rest of Middle East & Africa Smart Wearables Revenue (billion) Forecast, by Application 2020 & 2033
- Table 72: Rest of Middle East & Africa Smart Wearables Volume (K) Forecast, by Application 2020 & 2033
- Table 73: Global Smart Wearables Revenue billion Forecast, by Application 2020 & 2033
- Table 74: Global Smart Wearables Volume K Forecast, by Application 2020 & 2033
- Table 75: Global Smart Wearables Revenue billion Forecast, by Types 2020 & 2033
- Table 76: Global Smart Wearables Volume K Forecast, by Types 2020 & 2033
- Table 77: Global Smart Wearables Revenue billion Forecast, by Country 2020 & 2033
- Table 78: Global Smart Wearables Volume K Forecast, by Country 2020 & 2033
- Table 79: China Smart Wearables Revenue (billion) Forecast, by Application 2020 & 2033
- Table 80: China Smart Wearables Volume (K) Forecast, by Application 2020 & 2033
- Table 81: India Smart Wearables Revenue (billion) Forecast, by Application 2020 & 2033
- Table 82: India Smart Wearables Volume (K) Forecast, by Application 2020 & 2033
- Table 83: Japan Smart Wearables Revenue (billion) Forecast, by Application 2020 & 2033
- Table 84: Japan Smart Wearables Volume (K) Forecast, by Application 2020 & 2033
- Table 85: South Korea Smart Wearables Revenue (billion) Forecast, by Application 2020 & 2033
- Table 86: South Korea Smart Wearables Volume (K) Forecast, by Application 2020 & 2033
- Table 87: ASEAN Smart Wearables Revenue (billion) Forecast, by Application 2020 & 2033
- Table 88: ASEAN Smart Wearables Volume (K) Forecast, by Application 2020 & 2033
- Table 89: Oceania Smart Wearables Revenue (billion) Forecast, by Application 2020 & 2033
- Table 90: Oceania Smart Wearables Volume (K) Forecast, by Application 2020 & 2033
- Table 91: Rest of Asia Pacific Smart Wearables Revenue (billion) Forecast, by Application 2020 & 2033
- Table 92: Rest of Asia Pacific Smart Wearables Volume (K) Forecast, by Application 2020 & 2033
Frequently Asked Questions
1. What is the projected Compound Annual Growth Rate (CAGR) of the Smart Wearables?
The projected CAGR is approximately 19.72%.
2. Which companies are prominent players in the Smart Wearables?
Key companies in the market include Fitbit, Xiaomi, Apple, Garmin, Samsung, Jawbone, Misfit, Polar, Moto, Huawei, BBK(XTC), Lifesense, Razer.
3. What are the main segments of the Smart Wearables?
The market segments include Application, Types.
4. Can you provide details about the market size?
The market size is estimated to be USD 26.53 billion as of 2022.
5. What are some drivers contributing to market growth?
N/A
6. What are the notable trends driving market growth?
N/A
7. Are there any restraints impacting market growth?
N/A
8. Can you provide examples of recent developments in the market?
N/A
9. What pricing options are available for accessing the report?
Pricing options include single-user, multi-user, and enterprise licenses priced at USD 3950.00, USD 5925.00, and USD 7900.00 respectively.
10. Is the market size provided in terms of value or volume?
The market size is provided in terms of value, measured in billion and volume, measured in K.
11. Are there any specific market keywords associated with the report?
Yes, the market keyword associated with the report is "Smart Wearables," which aids in identifying and referencing the specific market segment covered.
12. How do I determine which pricing option suits my needs best?
The pricing options vary based on user requirements and access needs. Individual users may opt for single-user licenses, while businesses requiring broader access may choose multi-user or enterprise licenses for cost-effective access to the report.
13. Are there any additional resources or data provided in the Smart Wearables report?
While the report offers comprehensive insights, it's advisable to review the specific contents or supplementary materials provided to ascertain if additional resources or data are available.
14. How can I stay updated on further developments or reports in the Smart Wearables?
To stay informed about further developments, trends, and reports in the Smart Wearables, consider subscribing to industry newsletters, following relevant companies and organizations, or regularly checking reputable industry news sources and publications.
Methodology
Step 1 - Identification of Relevant Samples Size from Population Database


Step 2 - Approaches for Defining Global Market Size (Value, Volume* & Price*)

Note*: In applicable scenarios
Step 3 - Data Sources
Primary Research
- Web Analytics
- Survey Reports
- Research Institute
- Latest Research Reports
- Opinion Leaders
Secondary Research
- Annual Reports
- White Paper
- Latest Press Release
- Industry Association
- Paid Database
- Investor Presentations

Step 4 - Data Triangulation
Involves using different sources of information in order to increase the validity of a study
These sources are likely to be stakeholders in a program - participants, other researchers, program staff, other community members, and so on.
Then we put all data in single framework & apply various statistical tools to find out the dynamic on the market.
During the analysis stage, feedback from the stakeholder groups would be compared to determine areas of agreement as well as areas of divergence