

Key Insights
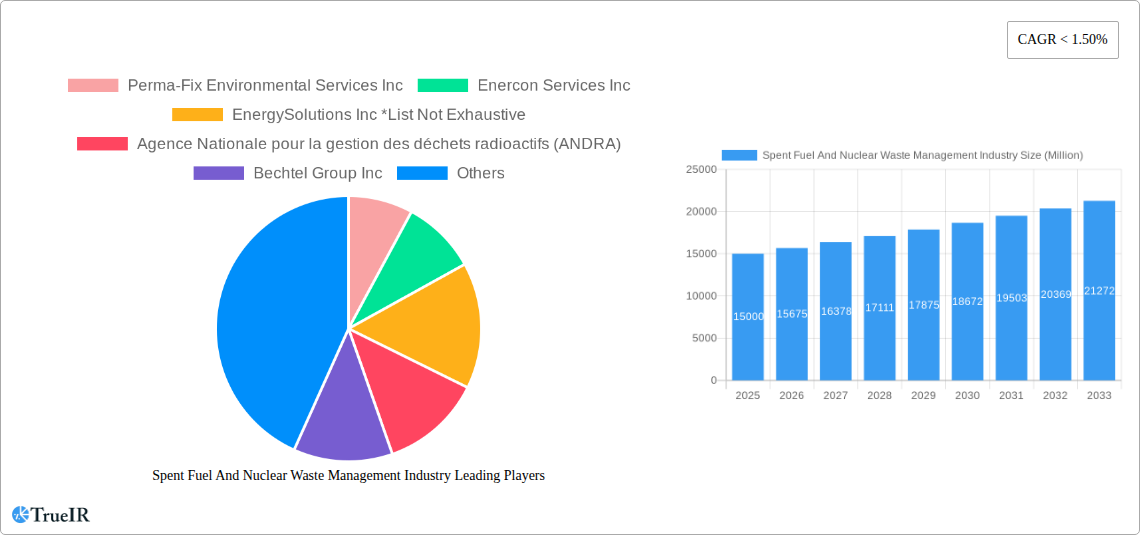
The Spent Fuel and Nuclear Waste Management industry is experiencing steady growth, driven by the increasing operational lifespan of existing nuclear power plants and the ongoing commissioning of new ones globally. The industry's market size in 2025 is estimated at $15 billion, reflecting a significant investment in safe and efficient waste management solutions. This growth is projected to continue throughout the forecast period (2025-2033), with a Compound Annual Growth Rate (CAGR) estimated at 4.5%. This CAGR is influenced by several factors, including stringent government regulations on nuclear waste disposal, advancements in technologies for reprocessing and long-term storage, and rising public awareness concerning environmental safety. The historical period (2019-2024) demonstrates a consistent growth trajectory, indicating a stable and reliable market despite inherent challenges related to the highly specialized and complex nature of the industry.
This growth is not uniform across all segments. The increasing adoption of advanced dry storage technologies is driving market expansion, while the development and implementation of geological repositories for high-level waste are contributing to long-term sustainability. Furthermore, regional variations in regulatory frameworks and the density of nuclear power plants will continue to impact market dynamics. North America and Europe currently hold significant market share, but the Asia-Pacific region is expected to witness substantial growth due to increasing nuclear energy adoption in countries like China, India, and South Korea. The industry faces continuous challenges in securing public acceptance and managing the long-term costs associated with waste management, however, innovation and stringent safety protocols are mitigating these risks and driving ongoing market expansion.
Spent Fuel and Nuclear Waste Management Industry Report: 2019-2033
This comprehensive report provides an in-depth analysis of the global Spent Fuel and Nuclear Waste Management industry, offering crucial insights for stakeholders, investors, and industry professionals. Covering the period from 2019 to 2033, with a focus on 2025, this report meticulously examines market dynamics, competitive landscapes, technological advancements, and future growth potential. The report leverages extensive data analysis and expert insights to deliver a clear, concise, and actionable understanding of this critical sector.
Spent Fuel And Nuclear Waste Management Industry Market Structure & Competitive Landscape
The global spent fuel and nuclear waste management market is characterized by a moderately concentrated structure, with a few large multinational players dominating alongside a significant number of smaller, specialized firms. Key players include Perma-Fix Environmental Services Inc, Enercon Services Inc, EnergySolutions Inc, Agence Nationale pour la gestion des déchets radioactifs (ANDRA), Bechtel Group Inc, Fluor Corporation, Westinghouse Electric Company LLC (Toshiba), Veolia Environment SA, Augean PLC, and Studsvik AB. However, the market is also fragmented due to the geographically dispersed nature of nuclear waste and stringent regulatory frameworks.
- Market Concentration: The Herfindahl-Hirschman Index (HHI) is estimated at xx, indicating a moderately concentrated market.
- Innovation Drivers: Technological advancements in waste treatment, storage, and disposal, particularly in vitrification and deep geological repositories, are key drivers.
- Regulatory Impacts: Stringent national and international regulations significantly influence market operations, including licensing, safety standards, and liability frameworks. Variations in these regulations across countries create complexities.
- Product Substitutes: Limited viable substitutes exist for the specialized services offered in this industry; however, improved efficiency and reduced waste generation in nuclear power plants could indirectly impact market demand.
- End-User Segmentation: Key end-users include nuclear power plants, research institutions, medical facilities, and military organizations.
- M&A Trends: The past five years have witnessed xx million in M&A activity within the sector, driven by the consolidation of smaller companies and the pursuit of geographical expansion.
Spent Fuel And Nuclear Waste Management Industry Market Trends & Opportunities
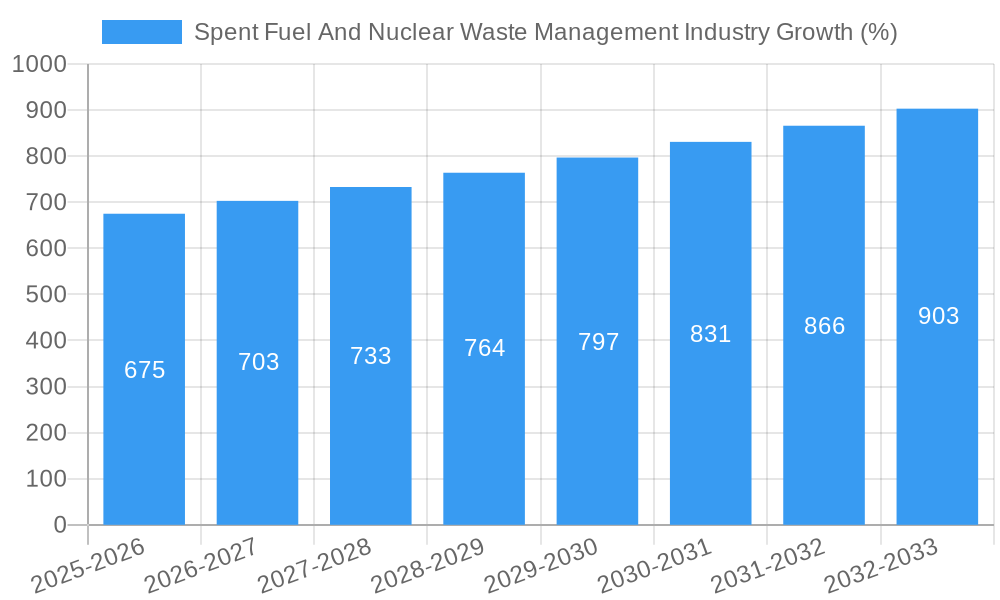
The global spent fuel and nuclear waste management market is projected to experience a Compound Annual Growth Rate (CAGR) of xx% during the forecast period (2025-2033), reaching a market size of xx million by 2033. This growth is fueled by several key factors: the continued operation of existing nuclear power plants, the commissioning of new nuclear facilities in several regions (despite a decline in new plant construction in some regions), and the increasing focus on the safe and sustainable management of legacy nuclear waste. Technological advancements, including improved waste treatment technologies and the development of advanced storage solutions like geological repositories, are creating new market opportunities. Government policies and regulations play a crucial role, with a growing emphasis on long-term waste management strategies driving market expansion. However, variations in these regulations across different countries present both opportunities and challenges. The market penetration rate for advanced waste treatment technologies remains relatively low, indicating significant potential for future growth. Competitive dynamics are shaped by factors such as technological innovation, regulatory compliance, and the ability to secure long-term contracts with nuclear operators.
Dominant Markets & Segments in Spent Fuel And Nuclear Waste Management Industry
The North American and European markets currently dominate the global spent fuel and nuclear waste management industry. However, growth is anticipated in Asia and other regions with significant nuclear power capacity or legacy waste stockpiles.
Leading Segments:
- By Waste Type: High-level waste management accounts for the largest segment due to its complex and costly treatment and disposal requirements.
- By Source: Nuclear fuel cycle activities represent the largest source of spent fuel and nuclear waste, accounting for over xx% of the market.
Key Growth Drivers:
- Increased Nuclear Power Generation: The continued operation of existing nuclear power plants and the construction of new plants, albeit at a slower rate, is a significant driver.
- Stringent Regulatory Frameworks: Stricter regulations concerning waste disposal and safety drive investments in advanced technologies and improved management practices.
- Government Funding and Initiatives: Government support for research, development, and deployment of advanced waste management technologies is a key facilitator of market expansion.
- Growing Public Awareness: Increased public awareness of nuclear waste risks is pushing for improved waste management solutions.
Spent Fuel And Nuclear Waste Management Industry Product Analysis
The industry offers a range of products and services including waste collection, transportation, treatment (e.g., vitrification, encapsulation), interim storage, and permanent disposal solutions. Key innovations focus on improving safety, efficiency, and reducing environmental impact. Technologies such as advanced vitrification processes, remote handling systems, and enhanced geological repository designs are driving market competitiveness. Market fit is largely determined by regulatory compliance, cost-effectiveness, and the ability to manage specific waste types.
Key Drivers, Barriers & Challenges in Spent Fuel And Nuclear Waste Management Industry
Key Drivers:
The industry is propelled by several factors including the expanding nuclear power industry, strict environmental regulations, growing public awareness of nuclear waste risks, and technological advancements in waste management solutions. Government investment in research and development also plays a pivotal role.
Challenges and Restraints:
Key challenges include the high cost associated with waste management, the complexity of regulations that vary significantly by region, the risk of nuclear accidents and their environmental consequences, and the public perception and opposition surrounding nuclear waste disposal sites. Supply chain disruptions can also significantly affect project timelines and costs. These factors can lead to project delays, cost overruns, and limited market access.
Growth Drivers in the Spent Fuel And Nuclear Waste Management Industry Market
Technological advancements, stricter regulations, and government policies supporting nuclear waste management contribute significantly to market growth. The expansion of the nuclear power sector, the need for responsible legacy waste management, and increased public awareness of the environmental risks associated with poor waste management are additional factors.
Challenges Impacting Spent Fuel And Nuclear Waste Management Industry Growth
High capital expenditure, stringent regulatory approvals, and public opposition to nuclear waste disposal facilities create significant barriers. Supply chain vulnerabilities, particularly for specialized materials and equipment, and the long lead times required for large-scale projects further constrain market growth.
Key Players Shaping the Spent Fuel And Nuclear Waste Management Industry Market
- Perma-Fix Environmental Services Inc
- Enercon Services Inc
- EnergySolutions Inc
- Agence Nationale pour la gestion des déchets radioactifs (ANDRA)
- Bechtel Group Inc
- Fluor Corporation
- Westinghouse Electric Company LLC (Toshiba)
- Veolia Environment SA
- Augean PLC
- Studsvik AB
Significant Spent Fuel And Nuclear Waste Management Industry Industry Milestones
- August 2020: The US Department of Energy authorizes the start of radioactive operations at the Salt Waste Processing Facility (SWPF) at the Savannah River Site (SRS), with the capacity to process 31 million gallons of radioactive salt waste.
- August 2021: German utility companies contract with Orano for over EUR 1 billion to repatriate German nuclear waste stored at the Orano la Hague plant.
Future Outlook for Spent Fuel And Nuclear Waste Management Industry Market
The future of the spent fuel and nuclear waste management industry is promising, driven by technological innovations and increased government regulations. Growing demand from existing and new nuclear power plants, coupled with the need to manage legacy waste, will continue to drive market expansion. Strategic partnerships, technological advancements, and a focus on sustainable solutions are crucial for navigating the challenges and capitalizing on the opportunities within this critical sector.
Spent Fuel And Nuclear Waste Management Industry Segmentation
-
1. Type
- 1.1. Low-level Waste
- 1.2. Intermediate-level Waste
- 1.3. High-level Waste
-
2. Source
-
2.1. Nuclear Fuel Cycle
- 2.1.1. Nuclear Power Reactors
- 2.1.2. Radioact
- 2.2. Research, Medical, and Industrial Source
- 2.3. Military and Defense Programs
- 2.4. Other Sources
-
2.1. Nuclear Fuel Cycle
Spent Fuel And Nuclear Waste Management Industry Segmentation By Geography
- 1. North America
- 2. Europe
- 3. Asia Pacific
- 4. South America
- 5. Middle East

Spent Fuel And Nuclear Waste Management Industry REPORT HIGHLIGHTS
| Aspects | Details |
|---|---|
| Study Period | 2019-2033 |
| Base Year | 2024 |
| Estimated Year | 2025 |
| Forecast Period | 2025-2033 |
| Historical Period | 2019-2024 |
| Growth Rate | CAGR of < 1.50% from 2019-2033 |
| Segmentation |
|
Table of Contents
- 1. Introduction
- 1.1. Research Scope
- 1.2. Market Segmentation
- 1.3. Research Methodology
- 1.4. Definitions and Assumptions
- 2. Executive Summary
- 2.1. Introduction
- 3. Market Dynamics
- 3.1. Introduction
- 3.2. Market Drivers
- 3.2.1. 4.; Increasing Infrastructure Development4.; Rising Emphasis Water and Wastewater Management
- 3.3. Market Restrains
- 3.3.1. 4.; Volatility in Raw Material Prices
- 3.4. Market Trends
- 3.4.1. Low-level Waste Expected to Dominate the Market
- 4. Market Factor Analysis
- 4.1. Porters Five Forces
- 4.2. Supply/Value Chain
- 4.3. PESTEL analysis
- 4.4. Market Entropy
- 4.5. Patent/Trademark Analysis
- 5. Global Spent Fuel And Nuclear Waste Management Industry Analysis, Insights and Forecast, 2019-2031
- 5.1. Market Analysis, Insights and Forecast - by Type
- 5.1.1. Low-level Waste
- 5.1.2. Intermediate-level Waste
- 5.1.3. High-level Waste
- 5.2. Market Analysis, Insights and Forecast - by Source
- 5.2.1. Nuclear Fuel Cycle
- 5.2.1.1. Nuclear Power Reactors
- 5.2.1.2. Radioact
- 5.2.2. Research, Medical, and Industrial Source
- 5.2.3. Military and Defense Programs
- 5.2.4. Other Sources
- 5.2.1. Nuclear Fuel Cycle
- 5.3. Market Analysis, Insights and Forecast - by Region
- 5.3.1. North America
- 5.3.2. Europe
- 5.3.3. Asia Pacific
- 5.3.4. South America
- 5.3.5. Middle East
- 5.1. Market Analysis, Insights and Forecast - by Type
- 6. North America Spent Fuel And Nuclear Waste Management Industry Analysis, Insights and Forecast, 2019-2031
- 6.1. Market Analysis, Insights and Forecast - by Type
- 6.1.1. Low-level Waste
- 6.1.2. Intermediate-level Waste
- 6.1.3. High-level Waste
- 6.2. Market Analysis, Insights and Forecast - by Source
- 6.2.1. Nuclear Fuel Cycle
- 6.2.1.1. Nuclear Power Reactors
- 6.2.1.2. Radioact
- 6.2.2. Research, Medical, and Industrial Source
- 6.2.3. Military and Defense Programs
- 6.2.4. Other Sources
- 6.2.1. Nuclear Fuel Cycle
- 6.1. Market Analysis, Insights and Forecast - by Type
- 7. Europe Spent Fuel And Nuclear Waste Management Industry Analysis, Insights and Forecast, 2019-2031
- 7.1. Market Analysis, Insights and Forecast - by Type
- 7.1.1. Low-level Waste
- 7.1.2. Intermediate-level Waste
- 7.1.3. High-level Waste
- 7.2. Market Analysis, Insights and Forecast - by Source
- 7.2.1. Nuclear Fuel Cycle
- 7.2.1.1. Nuclear Power Reactors
- 7.2.1.2. Radioact
- 7.2.2. Research, Medical, and Industrial Source
- 7.2.3. Military and Defense Programs
- 7.2.4. Other Sources
- 7.2.1. Nuclear Fuel Cycle
- 7.1. Market Analysis, Insights and Forecast - by Type
- 8. Asia Pacific Spent Fuel And Nuclear Waste Management Industry Analysis, Insights and Forecast, 2019-2031
- 8.1. Market Analysis, Insights and Forecast - by Type
- 8.1.1. Low-level Waste
- 8.1.2. Intermediate-level Waste
- 8.1.3. High-level Waste
- 8.2. Market Analysis, Insights and Forecast - by Source
- 8.2.1. Nuclear Fuel Cycle
- 8.2.1.1. Nuclear Power Reactors
- 8.2.1.2. Radioact
- 8.2.2. Research, Medical, and Industrial Source
- 8.2.3. Military and Defense Programs
- 8.2.4. Other Sources
- 8.2.1. Nuclear Fuel Cycle
- 8.1. Market Analysis, Insights and Forecast - by Type
- 9. South America Spent Fuel And Nuclear Waste Management Industry Analysis, Insights and Forecast, 2019-2031
- 9.1. Market Analysis, Insights and Forecast - by Type
- 9.1.1. Low-level Waste
- 9.1.2. Intermediate-level Waste
- 9.1.3. High-level Waste
- 9.2. Market Analysis, Insights and Forecast - by Source
- 9.2.1. Nuclear Fuel Cycle
- 9.2.1.1. Nuclear Power Reactors
- 9.2.1.2. Radioact
- 9.2.2. Research, Medical, and Industrial Source
- 9.2.3. Military and Defense Programs
- 9.2.4. Other Sources
- 9.2.1. Nuclear Fuel Cycle
- 9.1. Market Analysis, Insights and Forecast - by Type
- 10. Middle East Spent Fuel And Nuclear Waste Management Industry Analysis, Insights and Forecast, 2019-2031
- 10.1. Market Analysis, Insights and Forecast - by Type
- 10.1.1. Low-level Waste
- 10.1.2. Intermediate-level Waste
- 10.1.3. High-level Waste
- 10.2. Market Analysis, Insights and Forecast - by Source
- 10.2.1. Nuclear Fuel Cycle
- 10.2.1.1. Nuclear Power Reactors
- 10.2.1.2. Radioact
- 10.2.2. Research, Medical, and Industrial Source
- 10.2.3. Military and Defense Programs
- 10.2.4. Other Sources
- 10.2.1. Nuclear Fuel Cycle
- 10.1. Market Analysis, Insights and Forecast - by Type
- 11. North America Spent Fuel And Nuclear Waste Management Industry Analysis, Insights and Forecast, 2019-2031
- 11.1. Market Analysis, Insights and Forecast - By Country/Sub-region
- 11.1.1 United States
- 11.1.2 Canada
- 11.1.3 Mexico
- 12. Europe Spent Fuel And Nuclear Waste Management Industry Analysis, Insights and Forecast, 2019-2031
- 12.1. Market Analysis, Insights and Forecast - By Country/Sub-region
- 12.1.1 Germany
- 12.1.2 United Kingdom
- 12.1.3 France
- 12.1.4 Spain
- 12.1.5 Italy
- 12.1.6 Spain
- 12.1.7 Belgium
- 12.1.8 Netherland
- 12.1.9 Nordics
- 12.1.10 Rest of Europe
- 13. Asia Pacific Spent Fuel And Nuclear Waste Management Industry Analysis, Insights and Forecast, 2019-2031
- 13.1. Market Analysis, Insights and Forecast - By Country/Sub-region
- 13.1.1 China
- 13.1.2 Japan
- 13.1.3 India
- 13.1.4 South Korea
- 13.1.5 Southeast Asia
- 13.1.6 Australia
- 13.1.7 Indonesia
- 13.1.8 Phillipes
- 13.1.9 Singapore
- 13.1.10 Thailandc
- 13.1.11 Rest of Asia Pacific
- 14. South America Spent Fuel And Nuclear Waste Management Industry Analysis, Insights and Forecast, 2019-2031
- 14.1. Market Analysis, Insights and Forecast - By Country/Sub-region
- 14.1.1 Brazil
- 14.1.2 Argentina
- 14.1.3 Peru
- 14.1.4 Chile
- 14.1.5 Colombia
- 14.1.6 Ecuador
- 14.1.7 Venezuela
- 14.1.8 Rest of South America
- 15. North America Spent Fuel And Nuclear Waste Management Industry Analysis, Insights and Forecast, 2019-2031
- 15.1. Market Analysis, Insights and Forecast - By Country/Sub-region
- 15.1.1 United States
- 15.1.2 Canada
- 15.1.3 Mexico
- 16. MEA Spent Fuel And Nuclear Waste Management Industry Analysis, Insights and Forecast, 2019-2031
- 16.1. Market Analysis, Insights and Forecast - By Country/Sub-region
- 16.1.1 United Arab Emirates
- 16.1.2 Saudi Arabia
- 16.1.3 South Africa
- 16.1.4 Rest of Middle East and Africa
- 17. Competitive Analysis
- 17.1. Global Market Share Analysis 2024
- 17.2. Company Profiles
- 17.2.1 Perma-Fix Environmental Services Inc
- 17.2.1.1. Overview
- 17.2.1.2. Products
- 17.2.1.3. SWOT Analysis
- 17.2.1.4. Recent Developments
- 17.2.1.5. Financials (Based on Availability)
- 17.2.2 Enercon Services Inc
- 17.2.2.1. Overview
- 17.2.2.2. Products
- 17.2.2.3. SWOT Analysis
- 17.2.2.4. Recent Developments
- 17.2.2.5. Financials (Based on Availability)
- 17.2.3 EnergySolutions Inc *List Not Exhaustive
- 17.2.3.1. Overview
- 17.2.3.2. Products
- 17.2.3.3. SWOT Analysis
- 17.2.3.4. Recent Developments
- 17.2.3.5. Financials (Based on Availability)
- 17.2.4 Agence Nationale pour la gestion des déchets radioactifs (ANDRA)
- 17.2.4.1. Overview
- 17.2.4.2. Products
- 17.2.4.3. SWOT Analysis
- 17.2.4.4. Recent Developments
- 17.2.4.5. Financials (Based on Availability)
- 17.2.5 Bechtel Group Inc
- 17.2.5.1. Overview
- 17.2.5.2. Products
- 17.2.5.3. SWOT Analysis
- 17.2.5.4. Recent Developments
- 17.2.5.5. Financials (Based on Availability)
- 17.2.6 Fluor Corporation
- 17.2.6.1. Overview
- 17.2.6.2. Products
- 17.2.6.3. SWOT Analysis
- 17.2.6.4. Recent Developments
- 17.2.6.5. Financials (Based on Availability)
- 17.2.7 Westinghouse Electric Company LLC (Toshiba)
- 17.2.7.1. Overview
- 17.2.7.2. Products
- 17.2.7.3. SWOT Analysis
- 17.2.7.4. Recent Developments
- 17.2.7.5. Financials (Based on Availability)
- 17.2.8 Veolia Environment SA
- 17.2.8.1. Overview
- 17.2.8.2. Products
- 17.2.8.3. SWOT Analysis
- 17.2.8.4. Recent Developments
- 17.2.8.5. Financials (Based on Availability)
- 17.2.9 Augean PLC
- 17.2.9.1. Overview
- 17.2.9.2. Products
- 17.2.9.3. SWOT Analysis
- 17.2.9.4. Recent Developments
- 17.2.9.5. Financials (Based on Availability)
- 17.2.10 Studsvik AB
- 17.2.10.1. Overview
- 17.2.10.2. Products
- 17.2.10.3. SWOT Analysis
- 17.2.10.4. Recent Developments
- 17.2.10.5. Financials (Based on Availability)
- 17.2.1 Perma-Fix Environmental Services Inc
List of Figures
- Figure 1: Global Spent Fuel And Nuclear Waste Management Industry Revenue Breakdown (Million, %) by Region 2024 & 2032
- Figure 2: North America Spent Fuel And Nuclear Waste Management Industry Revenue (Million), by Country 2024 & 2032
- Figure 3: North America Spent Fuel And Nuclear Waste Management Industry Revenue Share (%), by Country 2024 & 2032
- Figure 4: Europe Spent Fuel And Nuclear Waste Management Industry Revenue (Million), by Country 2024 & 2032
- Figure 5: Europe Spent Fuel And Nuclear Waste Management Industry Revenue Share (%), by Country 2024 & 2032
- Figure 6: Asia Pacific Spent Fuel And Nuclear Waste Management Industry Revenue (Million), by Country 2024 & 2032
- Figure 7: Asia Pacific Spent Fuel And Nuclear Waste Management Industry Revenue Share (%), by Country 2024 & 2032
- Figure 8: South America Spent Fuel And Nuclear Waste Management Industry Revenue (Million), by Country 2024 & 2032
- Figure 9: South America Spent Fuel And Nuclear Waste Management Industry Revenue Share (%), by Country 2024 & 2032
- Figure 10: North America Spent Fuel And Nuclear Waste Management Industry Revenue (Million), by Country 2024 & 2032
- Figure 11: North America Spent Fuel And Nuclear Waste Management Industry Revenue Share (%), by Country 2024 & 2032
- Figure 12: MEA Spent Fuel And Nuclear Waste Management Industry Revenue (Million), by Country 2024 & 2032
- Figure 13: MEA Spent Fuel And Nuclear Waste Management Industry Revenue Share (%), by Country 2024 & 2032
- Figure 14: North America Spent Fuel And Nuclear Waste Management Industry Revenue (Million), by Type 2024 & 2032
- Figure 15: North America Spent Fuel And Nuclear Waste Management Industry Revenue Share (%), by Type 2024 & 2032
- Figure 16: North America Spent Fuel And Nuclear Waste Management Industry Revenue (Million), by Source 2024 & 2032
- Figure 17: North America Spent Fuel And Nuclear Waste Management Industry Revenue Share (%), by Source 2024 & 2032
- Figure 18: North America Spent Fuel And Nuclear Waste Management Industry Revenue (Million), by Country 2024 & 2032
- Figure 19: North America Spent Fuel And Nuclear Waste Management Industry Revenue Share (%), by Country 2024 & 2032
- Figure 20: Europe Spent Fuel And Nuclear Waste Management Industry Revenue (Million), by Type 2024 & 2032
- Figure 21: Europe Spent Fuel And Nuclear Waste Management Industry Revenue Share (%), by Type 2024 & 2032
- Figure 22: Europe Spent Fuel And Nuclear Waste Management Industry Revenue (Million), by Source 2024 & 2032
- Figure 23: Europe Spent Fuel And Nuclear Waste Management Industry Revenue Share (%), by Source 2024 & 2032
- Figure 24: Europe Spent Fuel And Nuclear Waste Management Industry Revenue (Million), by Country 2024 & 2032
- Figure 25: Europe Spent Fuel And Nuclear Waste Management Industry Revenue Share (%), by Country 2024 & 2032
- Figure 26: Asia Pacific Spent Fuel And Nuclear Waste Management Industry Revenue (Million), by Type 2024 & 2032
- Figure 27: Asia Pacific Spent Fuel And Nuclear Waste Management Industry Revenue Share (%), by Type 2024 & 2032
- Figure 28: Asia Pacific Spent Fuel And Nuclear Waste Management Industry Revenue (Million), by Source 2024 & 2032
- Figure 29: Asia Pacific Spent Fuel And Nuclear Waste Management Industry Revenue Share (%), by Source 2024 & 2032
- Figure 30: Asia Pacific Spent Fuel And Nuclear Waste Management Industry Revenue (Million), by Country 2024 & 2032
- Figure 31: Asia Pacific Spent Fuel And Nuclear Waste Management Industry Revenue Share (%), by Country 2024 & 2032
- Figure 32: South America Spent Fuel And Nuclear Waste Management Industry Revenue (Million), by Type 2024 & 2032
- Figure 33: South America Spent Fuel And Nuclear Waste Management Industry Revenue Share (%), by Type 2024 & 2032
- Figure 34: South America Spent Fuel And Nuclear Waste Management Industry Revenue (Million), by Source 2024 & 2032
- Figure 35: South America Spent Fuel And Nuclear Waste Management Industry Revenue Share (%), by Source 2024 & 2032
- Figure 36: South America Spent Fuel And Nuclear Waste Management Industry Revenue (Million), by Country 2024 & 2032
- Figure 37: South America Spent Fuel And Nuclear Waste Management Industry Revenue Share (%), by Country 2024 & 2032
- Figure 38: Middle East Spent Fuel And Nuclear Waste Management Industry Revenue (Million), by Type 2024 & 2032
- Figure 39: Middle East Spent Fuel And Nuclear Waste Management Industry Revenue Share (%), by Type 2024 & 2032
- Figure 40: Middle East Spent Fuel And Nuclear Waste Management Industry Revenue (Million), by Source 2024 & 2032
- Figure 41: Middle East Spent Fuel And Nuclear Waste Management Industry Revenue Share (%), by Source 2024 & 2032
- Figure 42: Middle East Spent Fuel And Nuclear Waste Management Industry Revenue (Million), by Country 2024 & 2032
- Figure 43: Middle East Spent Fuel And Nuclear Waste Management Industry Revenue Share (%), by Country 2024 & 2032
List of Tables
- Table 1: Global Spent Fuel And Nuclear Waste Management Industry Revenue Million Forecast, by Region 2019 & 2032
- Table 2: Global Spent Fuel And Nuclear Waste Management Industry Revenue Million Forecast, by Type 2019 & 2032
- Table 3: Global Spent Fuel And Nuclear Waste Management Industry Revenue Million Forecast, by Source 2019 & 2032
- Table 4: Global Spent Fuel And Nuclear Waste Management Industry Revenue Million Forecast, by Region 2019 & 2032
- Table 5: Global Spent Fuel And Nuclear Waste Management Industry Revenue Million Forecast, by Country 2019 & 2032
- Table 6: United States Spent Fuel And Nuclear Waste Management Industry Revenue (Million) Forecast, by Application 2019 & 2032
- Table 7: Canada Spent Fuel And Nuclear Waste Management Industry Revenue (Million) Forecast, by Application 2019 & 2032
- Table 8: Mexico Spent Fuel And Nuclear Waste Management Industry Revenue (Million) Forecast, by Application 2019 & 2032
- Table 9: Global Spent Fuel And Nuclear Waste Management Industry Revenue Million Forecast, by Country 2019 & 2032
- Table 10: Germany Spent Fuel And Nuclear Waste Management Industry Revenue (Million) Forecast, by Application 2019 & 2032
- Table 11: United Kingdom Spent Fuel And Nuclear Waste Management Industry Revenue (Million) Forecast, by Application 2019 & 2032
- Table 12: France Spent Fuel And Nuclear Waste Management Industry Revenue (Million) Forecast, by Application 2019 & 2032
- Table 13: Spain Spent Fuel And Nuclear Waste Management Industry Revenue (Million) Forecast, by Application 2019 & 2032
- Table 14: Italy Spent Fuel And Nuclear Waste Management Industry Revenue (Million) Forecast, by Application 2019 & 2032
- Table 15: Spain Spent Fuel And Nuclear Waste Management Industry Revenue (Million) Forecast, by Application 2019 & 2032
- Table 16: Belgium Spent Fuel And Nuclear Waste Management Industry Revenue (Million) Forecast, by Application 2019 & 2032
- Table 17: Netherland Spent Fuel And Nuclear Waste Management Industry Revenue (Million) Forecast, by Application 2019 & 2032
- Table 18: Nordics Spent Fuel And Nuclear Waste Management Industry Revenue (Million) Forecast, by Application 2019 & 2032
- Table 19: Rest of Europe Spent Fuel And Nuclear Waste Management Industry Revenue (Million) Forecast, by Application 2019 & 2032
- Table 20: Global Spent Fuel And Nuclear Waste Management Industry Revenue Million Forecast, by Country 2019 & 2032
- Table 21: China Spent Fuel And Nuclear Waste Management Industry Revenue (Million) Forecast, by Application 2019 & 2032
- Table 22: Japan Spent Fuel And Nuclear Waste Management Industry Revenue (Million) Forecast, by Application 2019 & 2032
- Table 23: India Spent Fuel And Nuclear Waste Management Industry Revenue (Million) Forecast, by Application 2019 & 2032
- Table 24: South Korea Spent Fuel And Nuclear Waste Management Industry Revenue (Million) Forecast, by Application 2019 & 2032
- Table 25: Southeast Asia Spent Fuel And Nuclear Waste Management Industry Revenue (Million) Forecast, by Application 2019 & 2032
- Table 26: Australia Spent Fuel And Nuclear Waste Management Industry Revenue (Million) Forecast, by Application 2019 & 2032
- Table 27: Indonesia Spent Fuel And Nuclear Waste Management Industry Revenue (Million) Forecast, by Application 2019 & 2032
- Table 28: Phillipes Spent Fuel And Nuclear Waste Management Industry Revenue (Million) Forecast, by Application 2019 & 2032
- Table 29: Singapore Spent Fuel And Nuclear Waste Management Industry Revenue (Million) Forecast, by Application 2019 & 2032
- Table 30: Thailandc Spent Fuel And Nuclear Waste Management Industry Revenue (Million) Forecast, by Application 2019 & 2032
- Table 31: Rest of Asia Pacific Spent Fuel And Nuclear Waste Management Industry Revenue (Million) Forecast, by Application 2019 & 2032
- Table 32: Global Spent Fuel And Nuclear Waste Management Industry Revenue Million Forecast, by Country 2019 & 2032
- Table 33: Brazil Spent Fuel And Nuclear Waste Management Industry Revenue (Million) Forecast, by Application 2019 & 2032
- Table 34: Argentina Spent Fuel And Nuclear Waste Management Industry Revenue (Million) Forecast, by Application 2019 & 2032
- Table 35: Peru Spent Fuel And Nuclear Waste Management Industry Revenue (Million) Forecast, by Application 2019 & 2032
- Table 36: Chile Spent Fuel And Nuclear Waste Management Industry Revenue (Million) Forecast, by Application 2019 & 2032
- Table 37: Colombia Spent Fuel And Nuclear Waste Management Industry Revenue (Million) Forecast, by Application 2019 & 2032
- Table 38: Ecuador Spent Fuel And Nuclear Waste Management Industry Revenue (Million) Forecast, by Application 2019 & 2032
- Table 39: Venezuela Spent Fuel And Nuclear Waste Management Industry Revenue (Million) Forecast, by Application 2019 & 2032
- Table 40: Rest of South America Spent Fuel And Nuclear Waste Management Industry Revenue (Million) Forecast, by Application 2019 & 2032
- Table 41: Global Spent Fuel And Nuclear Waste Management Industry Revenue Million Forecast, by Country 2019 & 2032
- Table 42: United States Spent Fuel And Nuclear Waste Management Industry Revenue (Million) Forecast, by Application 2019 & 2032
- Table 43: Canada Spent Fuel And Nuclear Waste Management Industry Revenue (Million) Forecast, by Application 2019 & 2032
- Table 44: Mexico Spent Fuel And Nuclear Waste Management Industry Revenue (Million) Forecast, by Application 2019 & 2032
- Table 45: Global Spent Fuel And Nuclear Waste Management Industry Revenue Million Forecast, by Country 2019 & 2032
- Table 46: United Arab Emirates Spent Fuel And Nuclear Waste Management Industry Revenue (Million) Forecast, by Application 2019 & 2032
- Table 47: Saudi Arabia Spent Fuel And Nuclear Waste Management Industry Revenue (Million) Forecast, by Application 2019 & 2032
- Table 48: South Africa Spent Fuel And Nuclear Waste Management Industry Revenue (Million) Forecast, by Application 2019 & 2032
- Table 49: Rest of Middle East and Africa Spent Fuel And Nuclear Waste Management Industry Revenue (Million) Forecast, by Application 2019 & 2032
- Table 50: Global Spent Fuel And Nuclear Waste Management Industry Revenue Million Forecast, by Type 2019 & 2032
- Table 51: Global Spent Fuel And Nuclear Waste Management Industry Revenue Million Forecast, by Source 2019 & 2032
- Table 52: Global Spent Fuel And Nuclear Waste Management Industry Revenue Million Forecast, by Country 2019 & 2032
- Table 53: Global Spent Fuel And Nuclear Waste Management Industry Revenue Million Forecast, by Type 2019 & 2032
- Table 54: Global Spent Fuel And Nuclear Waste Management Industry Revenue Million Forecast, by Source 2019 & 2032
- Table 55: Global Spent Fuel And Nuclear Waste Management Industry Revenue Million Forecast, by Country 2019 & 2032
- Table 56: Global Spent Fuel And Nuclear Waste Management Industry Revenue Million Forecast, by Type 2019 & 2032
- Table 57: Global Spent Fuel And Nuclear Waste Management Industry Revenue Million Forecast, by Source 2019 & 2032
- Table 58: Global Spent Fuel And Nuclear Waste Management Industry Revenue Million Forecast, by Country 2019 & 2032
- Table 59: Global Spent Fuel And Nuclear Waste Management Industry Revenue Million Forecast, by Type 2019 & 2032
- Table 60: Global Spent Fuel And Nuclear Waste Management Industry Revenue Million Forecast, by Source 2019 & 2032
- Table 61: Global Spent Fuel And Nuclear Waste Management Industry Revenue Million Forecast, by Country 2019 & 2032
- Table 62: Global Spent Fuel And Nuclear Waste Management Industry Revenue Million Forecast, by Type 2019 & 2032
- Table 63: Global Spent Fuel And Nuclear Waste Management Industry Revenue Million Forecast, by Source 2019 & 2032
- Table 64: Global Spent Fuel And Nuclear Waste Management Industry Revenue Million Forecast, by Country 2019 & 2032
Frequently Asked Questions
1. What is the projected Compound Annual Growth Rate (CAGR) of the Spent Fuel And Nuclear Waste Management Industry?
The projected CAGR is approximately < 1.50%.
2. Which companies are prominent players in the Spent Fuel And Nuclear Waste Management Industry?
Key companies in the market include Perma-Fix Environmental Services Inc, Enercon Services Inc, EnergySolutions Inc *List Not Exhaustive, Agence Nationale pour la gestion des déchets radioactifs (ANDRA), Bechtel Group Inc, Fluor Corporation, Westinghouse Electric Company LLC (Toshiba), Veolia Environment SA, Augean PLC, Studsvik AB.
3. What are the main segments of the Spent Fuel And Nuclear Waste Management Industry?
The market segments include Type, Source.
4. Can you provide details about the market size?
The market size is estimated to be USD XX Million as of 2022.
5. What are some drivers contributing to market growth?
4.; Increasing Infrastructure Development4.; Rising Emphasis Water and Wastewater Management.
6. What are the notable trends driving market growth?
Low-level Waste Expected to Dominate the Market.
7. Are there any restraints impacting market growth?
4.; Volatility in Raw Material Prices.
8. Can you provide examples of recent developments in the market?
The US Department of Energy, in August 2020, announced that it authorized the start of radioactive operations at the Salt Waste Processing Facility (SWPF) at its Savannah River Site (SRS). The first-of-a-kind facility is expected to process 31 million gallons of radioactive salt waste currently stored in underground tanks at the South Carolina location. The facility was designed and built and initially expected to be operated by Parsons Corporation. It is further expected to start normal operations later this year after hot commissioning is complete.
9. What pricing options are available for accessing the report?
Pricing options include single-user, multi-user, and enterprise licenses priced at USD 4750, USD 5250, and USD 8750 respectively.
10. Is the market size provided in terms of value or volume?
The market size is provided in terms of value, measured in Million.
11. Are there any specific market keywords associated with the report?
Yes, the market keyword associated with the report is "Spent Fuel And Nuclear Waste Management Industry," which aids in identifying and referencing the specific market segment covered.
12. How do I determine which pricing option suits my needs best?
The pricing options vary based on user requirements and access needs. Individual users may opt for single-user licenses, while businesses requiring broader access may choose multi-user or enterprise licenses for cost-effective access to the report.
13. Are there any additional resources or data provided in the Spent Fuel And Nuclear Waste Management Industry report?
While the report offers comprehensive insights, it's advisable to review the specific contents or supplementary materials provided to ascertain if additional resources or data are available.
14. How can I stay updated on further developments or reports in the Spent Fuel And Nuclear Waste Management Industry?
To stay informed about further developments, trends, and reports in the Spent Fuel And Nuclear Waste Management Industry, consider subscribing to industry newsletters, following relevant companies and organizations, or regularly checking reputable industry news sources and publications.
Methodology
Step 1 - Identification of Relevant Samples Size from Population Database


Step 2 - Approaches for Defining Global Market Size (Value, Volume* & Price*)

Note*: In applicable scenarios
Step 3 - Data Sources
Primary Research
- Web Analytics
- Survey Reports
- Research Institute
- Latest Research Reports
- Opinion Leaders
Secondary Research
- Annual Reports
- White Paper
- Latest Press Release
- Industry Association
- Paid Database
- Investor Presentations

Step 4 - Data Triangulation
Involves using different sources of information in order to increase the validity of a study
These sources are likely to be stakeholders in a program - participants, other researchers, program staff, other community members, and so on.
Then we put all data in single framework & apply various statistical tools to find out the dynamic on the market.
During the analysis stage, feedback from the stakeholder groups would be compared to determine areas of agreement as well as areas of divergence
