

Key Insights
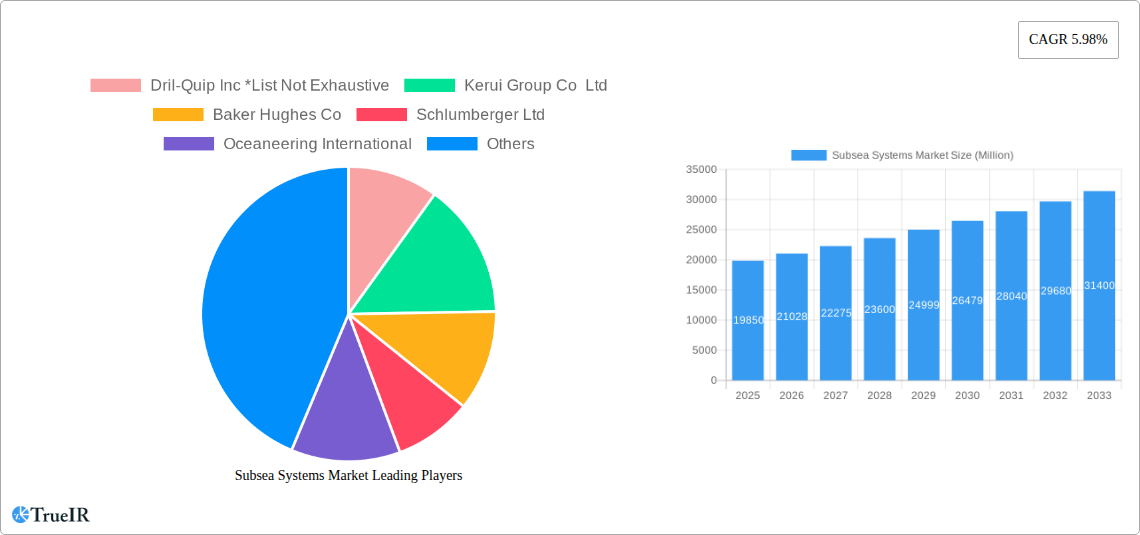
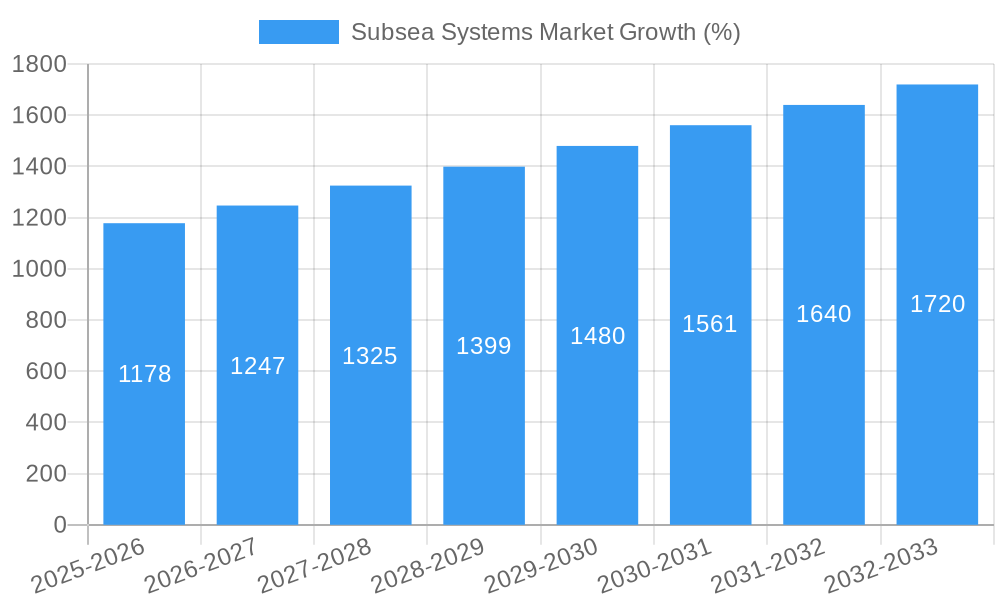
The subsea systems market, valued at $19.85 billion in 2025, is projected to experience robust growth, driven by the increasing demand for offshore oil and gas exploration and production. A compound annual growth rate (CAGR) of 5.98% from 2025 to 2033 indicates a significant expansion, reaching an estimated value exceeding $35 billion by 2033. This growth is fueled by several key factors. Firstly, the ongoing depletion of onshore reserves necessitates a shift towards deeper water exploration, boosting demand for sophisticated subsea production and processing systems. Technological advancements, such as improved subsea robotics and automation, enhance efficiency and reduce operational costs, further stimulating market expansion. The rising adoption of subsea processing technologies reduces the need for extensive surface infrastructure, minimizing environmental impact and enhancing overall profitability. Furthermore, the burgeoning renewable energy sector, particularly offshore wind farms, is creating new opportunities for the subsea systems market, as these projects require advanced subsea cabling and interconnection technologies.
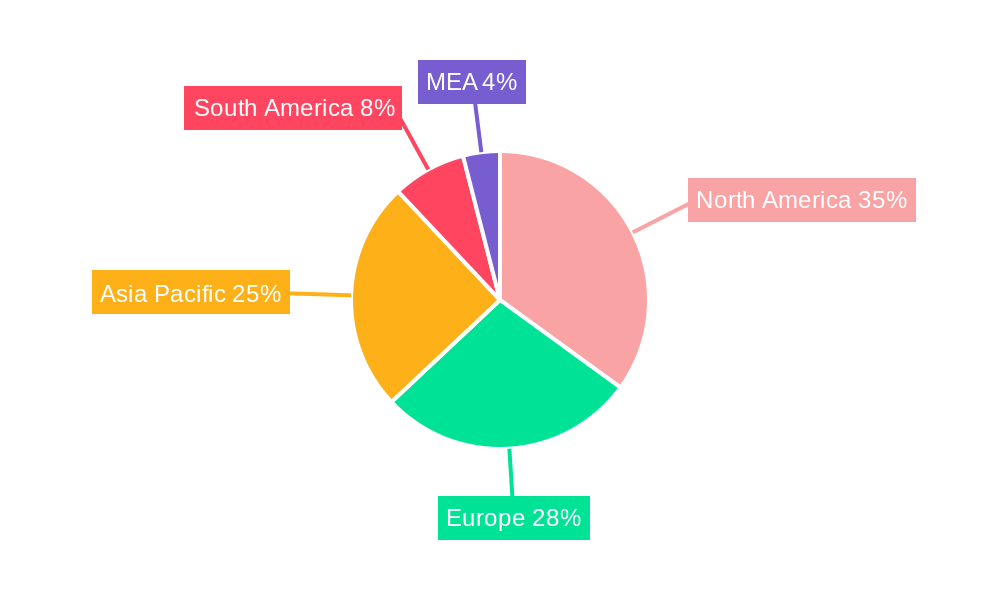
However, the market faces certain challenges. Fluctuations in oil and gas prices significantly impact investment decisions in offshore projects. Stringent environmental regulations and the rising costs associated with deepwater exploration and installation can act as restraints. Nevertheless, the long-term outlook remains positive, underpinned by the consistent need for energy resources and the continuous drive towards technological innovation within the industry. Market segmentation reveals strong demand for subsea umbilical riser and flowlines (SURF), trees, and wellhead systems. Leading players such as Schlumberger, Baker Hughes, and Subsea 7 are leveraging their expertise and technological prowess to capture significant market share, while emerging players are also gaining traction through innovation and competitive pricing. Geographical distribution showcases strong growth across North America, Europe, and the Asia-Pacific region, mirroring the concentration of offshore energy activities in these areas.
Subsea Systems Market: A Comprehensive Report (2019-2033)
This in-depth report provides a comprehensive analysis of the Subsea Systems Market, offering invaluable insights for industry stakeholders, investors, and researchers. With a meticulous study period spanning 2019-2033, including a base year of 2025 and a forecast period of 2025-2033, this report unveils the market's dynamic landscape, growth trajectory, and future potential. The report leverages extensive data analysis, covering key segments, prominent players, and significant industry milestones, delivering actionable intelligence to navigate this rapidly evolving sector. The market is expected to reach xx Million by 2033.
Subsea Systems Market Market Structure & Competitive Landscape
The Subsea Systems market exhibits a moderately consolidated structure, with a few major players commanding significant market share. The Herfindahl-Hirschman Index (HHI) is estimated at xx, indicating a moderately concentrated market. Innovation is a key driver, with companies continually investing in advanced technologies to enhance efficiency, reliability, and operational safety in subsea operations. Stringent regulatory frameworks, particularly concerning environmental protection and operational safety, significantly impact market dynamics. Product substitution is limited, with specialized equipment and services often requiring unique technological capabilities. The market is segmented by end-users including offshore oil and gas companies, and renewable energy players, amongst others. M&A activity has been moderate in recent years, with a total estimated transaction value of approximately xx Million in the period between 2019-2024.
- Market Concentration: Moderately consolidated, with HHI estimated at xx.
- Innovation Drivers: Technological advancements in automation, robotics, and digitalization.
- Regulatory Impacts: Stringent environmental and safety regulations influencing operational costs.
- Product Substitutes: Limited due to the specialized nature of subsea equipment.
- End-User Segmentation: Offshore oil & gas, renewable energy, etc.
- M&A Trends: Moderate activity, with total transaction value estimated at xx Million (2019-2024).
Subsea Systems Market Market Trends & Opportunities
The Subsea Systems market is experiencing robust growth, driven by increasing offshore oil and gas exploration and production activities, coupled with the rising adoption of renewable energy solutions in offshore environments. The market is projected to witness a Compound Annual Growth Rate (CAGR) of xx% during the forecast period (2025-2033). This expansion is fueled by significant technological advancements, such as improved subsea processing systems, leading to enhanced efficiency and reduced operational costs. Consumer preferences are increasingly focused on sustainable and environmentally friendly solutions, creating opportunities for innovative technologies that minimize environmental impact. The competitive dynamics are characterized by both intense rivalry amongst established players and the emergence of innovative startups. Market penetration rates are expected to increase significantly in emerging economies due to investments in offshore energy projects.
Dominant Markets & Segments in Subsea Systems Market
The Subsea Systems market is geographically diverse, with significant presence in regions like North America, Europe, and Asia-Pacific. However, the North Sea region, due to its extensive oil and gas reserves and robust infrastructure, currently stands as the dominant market. Within the market segments:
- Type: Subsea Production Systems currently holds the largest market share, driven by increasing demand for efficient oil and gas extraction. Subsea Processing Systems is poised for significant growth, supported by technological advancements in remote operation and automation.
- Component: Subsea Umbical Riser and Flowlines (SURF) represent a substantial segment, with consistent demand driven by pipeline infrastructure development. Trees, Wellheads, and Manifolds are also critical components showing stable market presence.
Key Growth Drivers:
- Robust Oil & Gas Exploration: Driven by rising energy demand in many parts of the world.
- Renewable Energy Development: Offshore wind farms and other renewable energy projects increase demand for subsea technologies.
- Government Initiatives & Policies: Investments and subsidies promoting offshore energy exploration and development.
- Technological Advancements: Leading to more efficient, reliable, and safer subsea operations.
Subsea Systems Market Product Analysis
The Subsea Systems market showcases continuous innovation in product design and functionality. Advancements focus on enhancing automation, remote operation capabilities, and data analytics integration. These technological improvements offer significant advantages, including reduced operational costs, improved safety, and enhanced efficiency in resource extraction. New products are designed for better environmental compatibility and compliance with stricter industry regulations. The market fit is strong for these advancements, given the growing industry demand for reliable and sustainable subsea solutions.
Key Drivers, Barriers & Challenges in Subsea Systems Market
Key Drivers:
- Growing demand for offshore oil and gas: The ever-increasing global energy demand fuels significant expansion in offshore exploration and production.
- Technological advancements: Innovations in automation, robotics, and digitalization are optimizing subsea operations.
- Government incentives: Favorable policies and subsidies are stimulating investment in offshore energy projects.
Key Challenges:
- High upfront capital investment: Subsea projects necessitate substantial investments in equipment and infrastructure.
- Complex regulatory environment: Navigating stringent environmental and safety regulations presents challenges.
- Supply chain disruptions: Geopolitical instability and logistical complexities can impact the availability of essential components. This may cause cost increases up to xx% in certain segments.
Growth Drivers in the Subsea Systems Market Market
The subsea systems market is propelled by several key drivers. Firstly, the ongoing global demand for energy fuels increased exploration and production activities, driving demand for advanced subsea technologies. Secondly, the increasing adoption of renewable energy sources, particularly offshore wind power, requires sophisticated subsea infrastructure, further boosting the market. Finally, continuous technological innovation, such as improved automation and remote operation capabilities, contribute to higher efficiency and operational safety, making subsea systems increasingly attractive for investors and operators.
Challenges Impacting Subsea Systems Market Growth
Several challenges hinder the growth of the subsea systems market. Regulatory complexities and stringent environmental regulations increase operational costs and project timelines. Supply chain issues, especially the availability of specialized components and skilled labor, constrain project execution. The intense competition among established players and the emergence of new entrants pressure margins and require continuous innovation. These factors collectively impact the market's expansion and necessitate a proactive approach to mitigate risks.
Key Players Shaping the Subsea Systems Market Market
- Dril-Quip Inc
- Kerui Group Co Ltd
- Baker Hughes Co
- Schlumberger Ltd
- Oceaneering International
- Akastor ASA
- Halliburton Co
- Subsea 7 SA
- National-Oilwell Varco Inc
- TechnipFMC PLC
Significant Subsea Systems Market Industry Milestones
- February 2023: Equinor's new commercial oil and gas discovery in the North Sea highlights the ongoing potential for offshore exploration and the demand for advanced subsea systems.
- February 2022: The partnership between Norwegian Innova and Teledyne Energy System demonstrates the exploration of alternative power sources for subsea control systems, showcasing innovation in the sector.
- March 2022: BP PLC's win of two offshore exploration blocks in Indonesia signals growing investment in subsea infrastructure in the Asia-Pacific region.
Future Outlook for Subsea Systems Market Market
The Subsea Systems market is poised for continued growth, driven by increasing energy demand, technological advancements, and government support for offshore energy projects. The rising adoption of renewable energy solutions in offshore environments will also stimulate significant market expansion. Strategic partnerships and collaborations will play a vital role in accelerating innovation and creating new market opportunities. The market's future hinges on adapting to evolving regulatory landscapes and addressing supply chain challenges to ensure sustainable and reliable subsea operations.
Subsea Systems Market Segmentation
-
1. Type
- 1.1. Subsea Production Systems
- 1.2. Subsea Processing Systems
-
2. Component
- 2.1. Subsea Umbical Riser and Flowlines (SURF)
- 2.2. Trees
- 2.3. Wellhead
- 2.4. Manifolds
- 2.5. Other Components
Subsea Systems Market Segmentation By Geography
-
1. North America
- 1.1. Canada
- 1.2. Mexico
- 1.3. United States of America
- 1.4. Rest of the North America
-
2. Europe
- 2.1. Norway
- 2.2. United Kingdom
- 2.3. France
- 2.4. Italy
-
3. Asia Pacific
- 3.1. China
- 3.2. India
- 3.3. Japan
- 3.4. Rest of the Asia Pacific
-
4. South America
- 4.1. Brazil
- 4.2. Argentina
- 4.3. Rest of the South America
-
5. Middle East and Africa
- 5.1. United Arab Emirates
- 5.2. Saudi Arabia
- 5.3. Iran
- 5.4. Iraq
- 5.5. Rest of the Middle East and Africa
Subsea Systems Market REPORT HIGHLIGHTS
| Aspects | Details |
|---|---|
| Study Period | 2019-2033 |
| Base Year | 2024 |
| Estimated Year | 2025 |
| Forecast Period | 2025-2033 |
| Historical Period | 2019-2024 |
| Growth Rate | CAGR of 5.98% from 2019-2033 |
| Segmentation |
|
Table of Contents
- 1. Introduction
- 1.1. Research Scope
- 1.2. Market Segmentation
- 1.3. Research Methodology
- 1.4. Definitions and Assumptions
- 2. Executive Summary
- 2.1. Introduction
- 3. Market Dynamics
- 3.1. Introduction
- 3.2. Market Drivers
- 3.2.1 4.; Improved Viability Of Offshore Oil And Gas Projects4.; Rising Deep Water Oil & Gas Exploration And Production Activities In The Americas
- 3.2.2 Asia-pacific
- 3.2.3 And Middle-east & Africa Region
- 3.3. Market Restrains
- 3.3.1. 4.; Ban On Offshore Exploration And Production Activities In Multiple Regions
- 3.4. Market Trends
- 3.4.1. Subsea Production Segment to Dominate the Market
- 4. Market Factor Analysis
- 4.1. Porters Five Forces
- 4.2. Supply/Value Chain
- 4.3. PESTEL analysis
- 4.4. Market Entropy
- 4.5. Patent/Trademark Analysis
- 5. Global Subsea Systems Market Analysis, Insights and Forecast, 2019-2031
- 5.1. Market Analysis, Insights and Forecast - by Type
- 5.1.1. Subsea Production Systems
- 5.1.2. Subsea Processing Systems
- 5.2. Market Analysis, Insights and Forecast - by Component
- 5.2.1. Subsea Umbical Riser and Flowlines (SURF)
- 5.2.2. Trees
- 5.2.3. Wellhead
- 5.2.4. Manifolds
- 5.2.5. Other Components
- 5.3. Market Analysis, Insights and Forecast - by Region
- 5.3.1. North America
- 5.3.2. Europe
- 5.3.3. Asia Pacific
- 5.3.4. South America
- 5.3.5. Middle East and Africa
- 5.1. Market Analysis, Insights and Forecast - by Type
- 6. North America Subsea Systems Market Analysis, Insights and Forecast, 2019-2031
- 6.1. Market Analysis, Insights and Forecast - by Type
- 6.1.1. Subsea Production Systems
- 6.1.2. Subsea Processing Systems
- 6.2. Market Analysis, Insights and Forecast - by Component
- 6.2.1. Subsea Umbical Riser and Flowlines (SURF)
- 6.2.2. Trees
- 6.2.3. Wellhead
- 6.2.4. Manifolds
- 6.2.5. Other Components
- 6.1. Market Analysis, Insights and Forecast - by Type
- 7. Europe Subsea Systems Market Analysis, Insights and Forecast, 2019-2031
- 7.1. Market Analysis, Insights and Forecast - by Type
- 7.1.1. Subsea Production Systems
- 7.1.2. Subsea Processing Systems
- 7.2. Market Analysis, Insights and Forecast - by Component
- 7.2.1. Subsea Umbical Riser and Flowlines (SURF)
- 7.2.2. Trees
- 7.2.3. Wellhead
- 7.2.4. Manifolds
- 7.2.5. Other Components
- 7.1. Market Analysis, Insights and Forecast - by Type
- 8. Asia Pacific Subsea Systems Market Analysis, Insights and Forecast, 2019-2031
- 8.1. Market Analysis, Insights and Forecast - by Type
- 8.1.1. Subsea Production Systems
- 8.1.2. Subsea Processing Systems
- 8.2. Market Analysis, Insights and Forecast - by Component
- 8.2.1. Subsea Umbical Riser and Flowlines (SURF)
- 8.2.2. Trees
- 8.2.3. Wellhead
- 8.2.4. Manifolds
- 8.2.5. Other Components
- 8.1. Market Analysis, Insights and Forecast - by Type
- 9. South America Subsea Systems Market Analysis, Insights and Forecast, 2019-2031
- 9.1. Market Analysis, Insights and Forecast - by Type
- 9.1.1. Subsea Production Systems
- 9.1.2. Subsea Processing Systems
- 9.2. Market Analysis, Insights and Forecast - by Component
- 9.2.1. Subsea Umbical Riser and Flowlines (SURF)
- 9.2.2. Trees
- 9.2.3. Wellhead
- 9.2.4. Manifolds
- 9.2.5. Other Components
- 9.1. Market Analysis, Insights and Forecast - by Type
- 10. Middle East and Africa Subsea Systems Market Analysis, Insights and Forecast, 2019-2031
- 10.1. Market Analysis, Insights and Forecast - by Type
- 10.1.1. Subsea Production Systems
- 10.1.2. Subsea Processing Systems
- 10.2. Market Analysis, Insights and Forecast - by Component
- 10.2.1. Subsea Umbical Riser and Flowlines (SURF)
- 10.2.2. Trees
- 10.2.3. Wellhead
- 10.2.4. Manifolds
- 10.2.5. Other Components
- 10.1. Market Analysis, Insights and Forecast - by Type
- 11. North America Subsea Systems Market Analysis, Insights and Forecast, 2019-2031
- 11.1. Market Analysis, Insights and Forecast - By Country/Sub-region
- 11.1.1 United States
- 11.1.2 Canada
- 11.1.3 Mexico
- 12. Europe Subsea Systems Market Analysis, Insights and Forecast, 2019-2031
- 12.1. Market Analysis, Insights and Forecast - By Country/Sub-region
- 12.1.1 Germany
- 12.1.2 United Kingdom
- 12.1.3 France
- 12.1.4 Spain
- 12.1.5 Italy
- 12.1.6 Spain
- 12.1.7 Belgium
- 12.1.8 Netherland
- 12.1.9 Nordics
- 12.1.10 Rest of Europe
- 13. Asia Pacific Subsea Systems Market Analysis, Insights and Forecast, 2019-2031
- 13.1. Market Analysis, Insights and Forecast - By Country/Sub-region
- 13.1.1 China
- 13.1.2 Japan
- 13.1.3 India
- 13.1.4 South Korea
- 13.1.5 Southeast Asia
- 13.1.6 Australia
- 13.1.7 Indonesia
- 13.1.8 Phillipes
- 13.1.9 Singapore
- 13.1.10 Thailandc
- 13.1.11 Rest of Asia Pacific
- 14. South America Subsea Systems Market Analysis, Insights and Forecast, 2019-2031
- 14.1. Market Analysis, Insights and Forecast - By Country/Sub-region
- 14.1.1 Brazil
- 14.1.2 Argentina
- 14.1.3 Peru
- 14.1.4 Chile
- 14.1.5 Colombia
- 14.1.6 Ecuador
- 14.1.7 Venezuela
- 14.1.8 Rest of South America
- 15. North America Subsea Systems Market Analysis, Insights and Forecast, 2019-2031
- 15.1. Market Analysis, Insights and Forecast - By Country/Sub-region
- 15.1.1 United States
- 15.1.2 Canada
- 15.1.3 Mexico
- 16. MEA Subsea Systems Market Analysis, Insights and Forecast, 2019-2031
- 16.1. Market Analysis, Insights and Forecast - By Country/Sub-region
- 16.1.1 United Arab Emirates
- 16.1.2 Saudi Arabia
- 16.1.3 South Africa
- 16.1.4 Rest of Middle East and Africa
- 17. Competitive Analysis
- 17.1. Global Market Share Analysis 2024
- 17.2. Company Profiles
- 17.2.1 Dril-Quip Inc *List Not Exhaustive
- 17.2.1.1. Overview
- 17.2.1.2. Products
- 17.2.1.3. SWOT Analysis
- 17.2.1.4. Recent Developments
- 17.2.1.5. Financials (Based on Availability)
- 17.2.2 Kerui Group Co Ltd
- 17.2.2.1. Overview
- 17.2.2.2. Products
- 17.2.2.3. SWOT Analysis
- 17.2.2.4. Recent Developments
- 17.2.2.5. Financials (Based on Availability)
- 17.2.3 Baker Hughes Co
- 17.2.3.1. Overview
- 17.2.3.2. Products
- 17.2.3.3. SWOT Analysis
- 17.2.3.4. Recent Developments
- 17.2.3.5. Financials (Based on Availability)
- 17.2.4 Schlumberger Ltd
- 17.2.4.1. Overview
- 17.2.4.2. Products
- 17.2.4.3. SWOT Analysis
- 17.2.4.4. Recent Developments
- 17.2.4.5. Financials (Based on Availability)
- 17.2.5 Oceaneering International
- 17.2.5.1. Overview
- 17.2.5.2. Products
- 17.2.5.3. SWOT Analysis
- 17.2.5.4. Recent Developments
- 17.2.5.5. Financials (Based on Availability)
- 17.2.6 Akastor ASA
- 17.2.6.1. Overview
- 17.2.6.2. Products
- 17.2.6.3. SWOT Analysis
- 17.2.6.4. Recent Developments
- 17.2.6.5. Financials (Based on Availability)
- 17.2.7 Halliburton Co
- 17.2.7.1. Overview
- 17.2.7.2. Products
- 17.2.7.3. SWOT Analysis
- 17.2.7.4. Recent Developments
- 17.2.7.5. Financials (Based on Availability)
- 17.2.8 Subsea 7 SA
- 17.2.8.1. Overview
- 17.2.8.2. Products
- 17.2.8.3. SWOT Analysis
- 17.2.8.4. Recent Developments
- 17.2.8.5. Financials (Based on Availability)
- 17.2.9 National-Oilwell Varco Inc
- 17.2.9.1. Overview
- 17.2.9.2. Products
- 17.2.9.3. SWOT Analysis
- 17.2.9.4. Recent Developments
- 17.2.9.5. Financials (Based on Availability)
- 17.2.10 TechnipFMC PLC
- 17.2.10.1. Overview
- 17.2.10.2. Products
- 17.2.10.3. SWOT Analysis
- 17.2.10.4. Recent Developments
- 17.2.10.5. Financials (Based on Availability)
- 17.2.1 Dril-Quip Inc *List Not Exhaustive
List of Figures
- Figure 1: Global Subsea Systems Market Revenue Breakdown (Million, %) by Region 2024 & 2032
- Figure 2: North America Subsea Systems Market Revenue (Million), by Country 2024 & 2032
- Figure 3: North America Subsea Systems Market Revenue Share (%), by Country 2024 & 2032
- Figure 4: Europe Subsea Systems Market Revenue (Million), by Country 2024 & 2032
- Figure 5: Europe Subsea Systems Market Revenue Share (%), by Country 2024 & 2032
- Figure 6: Asia Pacific Subsea Systems Market Revenue (Million), by Country 2024 & 2032
- Figure 7: Asia Pacific Subsea Systems Market Revenue Share (%), by Country 2024 & 2032
- Figure 8: South America Subsea Systems Market Revenue (Million), by Country 2024 & 2032
- Figure 9: South America Subsea Systems Market Revenue Share (%), by Country 2024 & 2032
- Figure 10: North America Subsea Systems Market Revenue (Million), by Country 2024 & 2032
- Figure 11: North America Subsea Systems Market Revenue Share (%), by Country 2024 & 2032
- Figure 12: MEA Subsea Systems Market Revenue (Million), by Country 2024 & 2032
- Figure 13: MEA Subsea Systems Market Revenue Share (%), by Country 2024 & 2032
- Figure 14: North America Subsea Systems Market Revenue (Million), by Type 2024 & 2032
- Figure 15: North America Subsea Systems Market Revenue Share (%), by Type 2024 & 2032
- Figure 16: North America Subsea Systems Market Revenue (Million), by Component 2024 & 2032
- Figure 17: North America Subsea Systems Market Revenue Share (%), by Component 2024 & 2032
- Figure 18: North America Subsea Systems Market Revenue (Million), by Country 2024 & 2032
- Figure 19: North America Subsea Systems Market Revenue Share (%), by Country 2024 & 2032
- Figure 20: Europe Subsea Systems Market Revenue (Million), by Type 2024 & 2032
- Figure 21: Europe Subsea Systems Market Revenue Share (%), by Type 2024 & 2032
- Figure 22: Europe Subsea Systems Market Revenue (Million), by Component 2024 & 2032
- Figure 23: Europe Subsea Systems Market Revenue Share (%), by Component 2024 & 2032
- Figure 24: Europe Subsea Systems Market Revenue (Million), by Country 2024 & 2032
- Figure 25: Europe Subsea Systems Market Revenue Share (%), by Country 2024 & 2032
- Figure 26: Asia Pacific Subsea Systems Market Revenue (Million), by Type 2024 & 2032
- Figure 27: Asia Pacific Subsea Systems Market Revenue Share (%), by Type 2024 & 2032
- Figure 28: Asia Pacific Subsea Systems Market Revenue (Million), by Component 2024 & 2032
- Figure 29: Asia Pacific Subsea Systems Market Revenue Share (%), by Component 2024 & 2032
- Figure 30: Asia Pacific Subsea Systems Market Revenue (Million), by Country 2024 & 2032
- Figure 31: Asia Pacific Subsea Systems Market Revenue Share (%), by Country 2024 & 2032
- Figure 32: South America Subsea Systems Market Revenue (Million), by Type 2024 & 2032
- Figure 33: South America Subsea Systems Market Revenue Share (%), by Type 2024 & 2032
- Figure 34: South America Subsea Systems Market Revenue (Million), by Component 2024 & 2032
- Figure 35: South America Subsea Systems Market Revenue Share (%), by Component 2024 & 2032
- Figure 36: South America Subsea Systems Market Revenue (Million), by Country 2024 & 2032
- Figure 37: South America Subsea Systems Market Revenue Share (%), by Country 2024 & 2032
- Figure 38: Middle East and Africa Subsea Systems Market Revenue (Million), by Type 2024 & 2032
- Figure 39: Middle East and Africa Subsea Systems Market Revenue Share (%), by Type 2024 & 2032
- Figure 40: Middle East and Africa Subsea Systems Market Revenue (Million), by Component 2024 & 2032
- Figure 41: Middle East and Africa Subsea Systems Market Revenue Share (%), by Component 2024 & 2032
- Figure 42: Middle East and Africa Subsea Systems Market Revenue (Million), by Country 2024 & 2032
- Figure 43: Middle East and Africa Subsea Systems Market Revenue Share (%), by Country 2024 & 2032
List of Tables
- Table 1: Global Subsea Systems Market Revenue Million Forecast, by Region 2019 & 2032
- Table 2: Global Subsea Systems Market Revenue Million Forecast, by Type 2019 & 2032
- Table 3: Global Subsea Systems Market Revenue Million Forecast, by Component 2019 & 2032
- Table 4: Global Subsea Systems Market Revenue Million Forecast, by Region 2019 & 2032
- Table 5: Global Subsea Systems Market Revenue Million Forecast, by Country 2019 & 2032
- Table 6: United States Subsea Systems Market Revenue (Million) Forecast, by Application 2019 & 2032
- Table 7: Canada Subsea Systems Market Revenue (Million) Forecast, by Application 2019 & 2032
- Table 8: Mexico Subsea Systems Market Revenue (Million) Forecast, by Application 2019 & 2032
- Table 9: Global Subsea Systems Market Revenue Million Forecast, by Country 2019 & 2032
- Table 10: Germany Subsea Systems Market Revenue (Million) Forecast, by Application 2019 & 2032
- Table 11: United Kingdom Subsea Systems Market Revenue (Million) Forecast, by Application 2019 & 2032
- Table 12: France Subsea Systems Market Revenue (Million) Forecast, by Application 2019 & 2032
- Table 13: Spain Subsea Systems Market Revenue (Million) Forecast, by Application 2019 & 2032
- Table 14: Italy Subsea Systems Market Revenue (Million) Forecast, by Application 2019 & 2032
- Table 15: Spain Subsea Systems Market Revenue (Million) Forecast, by Application 2019 & 2032
- Table 16: Belgium Subsea Systems Market Revenue (Million) Forecast, by Application 2019 & 2032
- Table 17: Netherland Subsea Systems Market Revenue (Million) Forecast, by Application 2019 & 2032
- Table 18: Nordics Subsea Systems Market Revenue (Million) Forecast, by Application 2019 & 2032
- Table 19: Rest of Europe Subsea Systems Market Revenue (Million) Forecast, by Application 2019 & 2032
- Table 20: Global Subsea Systems Market Revenue Million Forecast, by Country 2019 & 2032
- Table 21: China Subsea Systems Market Revenue (Million) Forecast, by Application 2019 & 2032
- Table 22: Japan Subsea Systems Market Revenue (Million) Forecast, by Application 2019 & 2032
- Table 23: India Subsea Systems Market Revenue (Million) Forecast, by Application 2019 & 2032
- Table 24: South Korea Subsea Systems Market Revenue (Million) Forecast, by Application 2019 & 2032
- Table 25: Southeast Asia Subsea Systems Market Revenue (Million) Forecast, by Application 2019 & 2032
- Table 26: Australia Subsea Systems Market Revenue (Million) Forecast, by Application 2019 & 2032
- Table 27: Indonesia Subsea Systems Market Revenue (Million) Forecast, by Application 2019 & 2032
- Table 28: Phillipes Subsea Systems Market Revenue (Million) Forecast, by Application 2019 & 2032
- Table 29: Singapore Subsea Systems Market Revenue (Million) Forecast, by Application 2019 & 2032
- Table 30: Thailandc Subsea Systems Market Revenue (Million) Forecast, by Application 2019 & 2032
- Table 31: Rest of Asia Pacific Subsea Systems Market Revenue (Million) Forecast, by Application 2019 & 2032
- Table 32: Global Subsea Systems Market Revenue Million Forecast, by Country 2019 & 2032
- Table 33: Brazil Subsea Systems Market Revenue (Million) Forecast, by Application 2019 & 2032
- Table 34: Argentina Subsea Systems Market Revenue (Million) Forecast, by Application 2019 & 2032
- Table 35: Peru Subsea Systems Market Revenue (Million) Forecast, by Application 2019 & 2032
- Table 36: Chile Subsea Systems Market Revenue (Million) Forecast, by Application 2019 & 2032
- Table 37: Colombia Subsea Systems Market Revenue (Million) Forecast, by Application 2019 & 2032
- Table 38: Ecuador Subsea Systems Market Revenue (Million) Forecast, by Application 2019 & 2032
- Table 39: Venezuela Subsea Systems Market Revenue (Million) Forecast, by Application 2019 & 2032
- Table 40: Rest of South America Subsea Systems Market Revenue (Million) Forecast, by Application 2019 & 2032
- Table 41: Global Subsea Systems Market Revenue Million Forecast, by Country 2019 & 2032
- Table 42: United States Subsea Systems Market Revenue (Million) Forecast, by Application 2019 & 2032
- Table 43: Canada Subsea Systems Market Revenue (Million) Forecast, by Application 2019 & 2032
- Table 44: Mexico Subsea Systems Market Revenue (Million) Forecast, by Application 2019 & 2032
- Table 45: Global Subsea Systems Market Revenue Million Forecast, by Country 2019 & 2032
- Table 46: United Arab Emirates Subsea Systems Market Revenue (Million) Forecast, by Application 2019 & 2032
- Table 47: Saudi Arabia Subsea Systems Market Revenue (Million) Forecast, by Application 2019 & 2032
- Table 48: South Africa Subsea Systems Market Revenue (Million) Forecast, by Application 2019 & 2032
- Table 49: Rest of Middle East and Africa Subsea Systems Market Revenue (Million) Forecast, by Application 2019 & 2032
- Table 50: Global Subsea Systems Market Revenue Million Forecast, by Type 2019 & 2032
- Table 51: Global Subsea Systems Market Revenue Million Forecast, by Component 2019 & 2032
- Table 52: Global Subsea Systems Market Revenue Million Forecast, by Country 2019 & 2032
- Table 53: Canada Subsea Systems Market Revenue (Million) Forecast, by Application 2019 & 2032
- Table 54: Mexico Subsea Systems Market Revenue (Million) Forecast, by Application 2019 & 2032
- Table 55: United States of America Subsea Systems Market Revenue (Million) Forecast, by Application 2019 & 2032
- Table 56: Rest of the North America Subsea Systems Market Revenue (Million) Forecast, by Application 2019 & 2032
- Table 57: Global Subsea Systems Market Revenue Million Forecast, by Type 2019 & 2032
- Table 58: Global Subsea Systems Market Revenue Million Forecast, by Component 2019 & 2032
- Table 59: Global Subsea Systems Market Revenue Million Forecast, by Country 2019 & 2032
- Table 60: Norway Subsea Systems Market Revenue (Million) Forecast, by Application 2019 & 2032
- Table 61: United Kingdom Subsea Systems Market Revenue (Million) Forecast, by Application 2019 & 2032
- Table 62: France Subsea Systems Market Revenue (Million) Forecast, by Application 2019 & 2032
- Table 63: Italy Subsea Systems Market Revenue (Million) Forecast, by Application 2019 & 2032
- Table 64: Global Subsea Systems Market Revenue Million Forecast, by Type 2019 & 2032
- Table 65: Global Subsea Systems Market Revenue Million Forecast, by Component 2019 & 2032
- Table 66: Global Subsea Systems Market Revenue Million Forecast, by Country 2019 & 2032
- Table 67: China Subsea Systems Market Revenue (Million) Forecast, by Application 2019 & 2032
- Table 68: India Subsea Systems Market Revenue (Million) Forecast, by Application 2019 & 2032
- Table 69: Japan Subsea Systems Market Revenue (Million) Forecast, by Application 2019 & 2032
- Table 70: Rest of the Asia Pacific Subsea Systems Market Revenue (Million) Forecast, by Application 2019 & 2032
- Table 71: Global Subsea Systems Market Revenue Million Forecast, by Type 2019 & 2032
- Table 72: Global Subsea Systems Market Revenue Million Forecast, by Component 2019 & 2032
- Table 73: Global Subsea Systems Market Revenue Million Forecast, by Country 2019 & 2032
- Table 74: Brazil Subsea Systems Market Revenue (Million) Forecast, by Application 2019 & 2032
- Table 75: Argentina Subsea Systems Market Revenue (Million) Forecast, by Application 2019 & 2032
- Table 76: Rest of the South America Subsea Systems Market Revenue (Million) Forecast, by Application 2019 & 2032
- Table 77: Global Subsea Systems Market Revenue Million Forecast, by Type 2019 & 2032
- Table 78: Global Subsea Systems Market Revenue Million Forecast, by Component 2019 & 2032
- Table 79: Global Subsea Systems Market Revenue Million Forecast, by Country 2019 & 2032
- Table 80: United Arab Emirates Subsea Systems Market Revenue (Million) Forecast, by Application 2019 & 2032
- Table 81: Saudi Arabia Subsea Systems Market Revenue (Million) Forecast, by Application 2019 & 2032
- Table 82: Iran Subsea Systems Market Revenue (Million) Forecast, by Application 2019 & 2032
- Table 83: Iraq Subsea Systems Market Revenue (Million) Forecast, by Application 2019 & 2032
- Table 84: Rest of the Middle East and Africa Subsea Systems Market Revenue (Million) Forecast, by Application 2019 & 2032
Frequently Asked Questions
1. What is the projected Compound Annual Growth Rate (CAGR) of the Subsea Systems Market?
The projected CAGR is approximately 5.98%.
2. Which companies are prominent players in the Subsea Systems Market?
Key companies in the market include Dril-Quip Inc *List Not Exhaustive, Kerui Group Co Ltd, Baker Hughes Co, Schlumberger Ltd, Oceaneering International, Akastor ASA, Halliburton Co, Subsea 7 SA, National-Oilwell Varco Inc, TechnipFMC PLC.
3. What are the main segments of the Subsea Systems Market?
The market segments include Type, Component.
4. Can you provide details about the market size?
The market size is estimated to be USD 19.85 Million as of 2022.
5. What are some drivers contributing to market growth?
4.; Improved Viability Of Offshore Oil And Gas Projects4.; Rising Deep Water Oil & Gas Exploration And Production Activities In The Americas. Asia-pacific. And Middle-east & Africa Region.
6. What are the notable trends driving market growth?
Subsea Production Segment to Dominate the Market.
7. Are there any restraints impacting market growth?
4.; Ban On Offshore Exploration And Production Activities In Multiple Regions.
8. Can you provide examples of recent developments in the market?
February 2023: Equinor made a new commercial oil and gas discovery in the North Sea off Norway using a Transocean-owned rig. The discovery was made after the conclusion of drilling a wildcat well (31/1-3 S) and an appraisal well (31/1-3 A) in production license 923.
9. What pricing options are available for accessing the report?
Pricing options include single-user, multi-user, and enterprise licenses priced at USD 4750, USD 5250, and USD 8750 respectively.
10. Is the market size provided in terms of value or volume?
The market size is provided in terms of value, measured in Million.
11. Are there any specific market keywords associated with the report?
Yes, the market keyword associated with the report is "Subsea Systems Market," which aids in identifying and referencing the specific market segment covered.
12. How do I determine which pricing option suits my needs best?
The pricing options vary based on user requirements and access needs. Individual users may opt for single-user licenses, while businesses requiring broader access may choose multi-user or enterprise licenses for cost-effective access to the report.
13. Are there any additional resources or data provided in the Subsea Systems Market report?
While the report offers comprehensive insights, it's advisable to review the specific contents or supplementary materials provided to ascertain if additional resources or data are available.
14. How can I stay updated on further developments or reports in the Subsea Systems Market?
To stay informed about further developments, trends, and reports in the Subsea Systems Market, consider subscribing to industry newsletters, following relevant companies and organizations, or regularly checking reputable industry news sources and publications.
Methodology
Step 1 - Identification of Relevant Samples Size from Population Database


Step 2 - Approaches for Defining Global Market Size (Value, Volume* & Price*)

Note*: In applicable scenarios
Step 3 - Data Sources
Primary Research
- Web Analytics
- Survey Reports
- Research Institute
- Latest Research Reports
- Opinion Leaders
Secondary Research
- Annual Reports
- White Paper
- Latest Press Release
- Industry Association
- Paid Database
- Investor Presentations

Step 4 - Data Triangulation
Involves using different sources of information in order to increase the validity of a study
These sources are likely to be stakeholders in a program - participants, other researchers, program staff, other community members, and so on.
Then we put all data in single framework & apply various statistical tools to find out the dynamic on the market.
During the analysis stage, feedback from the stakeholder groups would be compared to determine areas of agreement as well as areas of divergence
