

Key Insights
The transparent electronics market is experiencing rapid growth, driven by increasing demand across diverse sectors. The market's Compound Annual Growth Rate (CAGR) of 25% from 2019 to 2024 indicates substantial expansion, projected to continue through 2033. This robust growth stems from several key factors. Firstly, advancements in materials science are leading to the development of more efficient and cost-effective transparent displays, solar panels, and smart windows. Secondly, the automotive industry's adoption of transparent displays for head-up displays and other in-car applications is a major driver. The building infrastructure sector is also witnessing increased integration of transparent solar panels for energy efficiency and aesthetic appeal. Finally, the burgeoning consumer electronics market consistently seeks innovative solutions, leading to the integration of transparent displays in smartphones, wearable technology, and other devices. While challenges such as high production costs and technological limitations exist, ongoing research and development efforts are continuously addressing these hurdles.
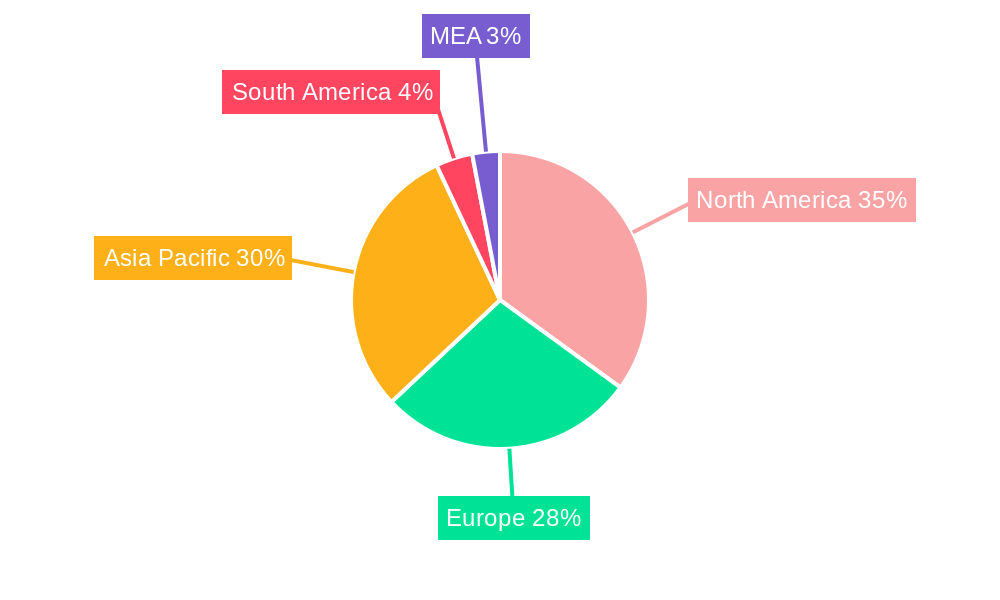
The market segmentation reveals significant opportunities across various end-user industries and product types. Transparent displays currently hold a considerable share, but the segment for transparent solar panels is exhibiting particularly strong growth potential due to the rising emphasis on renewable energy solutions. Geographically, North America and Asia Pacific are expected to lead the market, fueled by robust technological innovation, strong consumer demand, and significant government support for clean energy initiatives. While Europe also holds a significant market share, Asia Pacific is anticipated to demonstrate higher growth rates in the coming years due to its larger and more rapidly developing economies. Major players like BOE Technology Group Co, LG Electronics Inc, and Panasonic Corporation are heavily investing in research and development, further fueling the market's expansion and competition. The market's continued growth trajectory points towards a future where transparent electronics become increasingly ubiquitous in various applications, transforming industries and daily life.
Dynamic Transparent Electronics Industry Market Report: 2019-2033
This comprehensive report provides an in-depth analysis of the Transparent Electronics Industry, projecting a market size exceeding $XX Million by 2033. The study covers the period from 2019 to 2033, with 2025 serving as the base and estimated year. It meticulously examines market structure, competitive dynamics, leading players, technological advancements, and future growth prospects. This report is an essential resource for businesses, investors, and researchers seeking to understand and capitalize on the opportunities within this rapidly evolving sector.
Transparent Electronics Industry Market Structure & Competitive Landscape
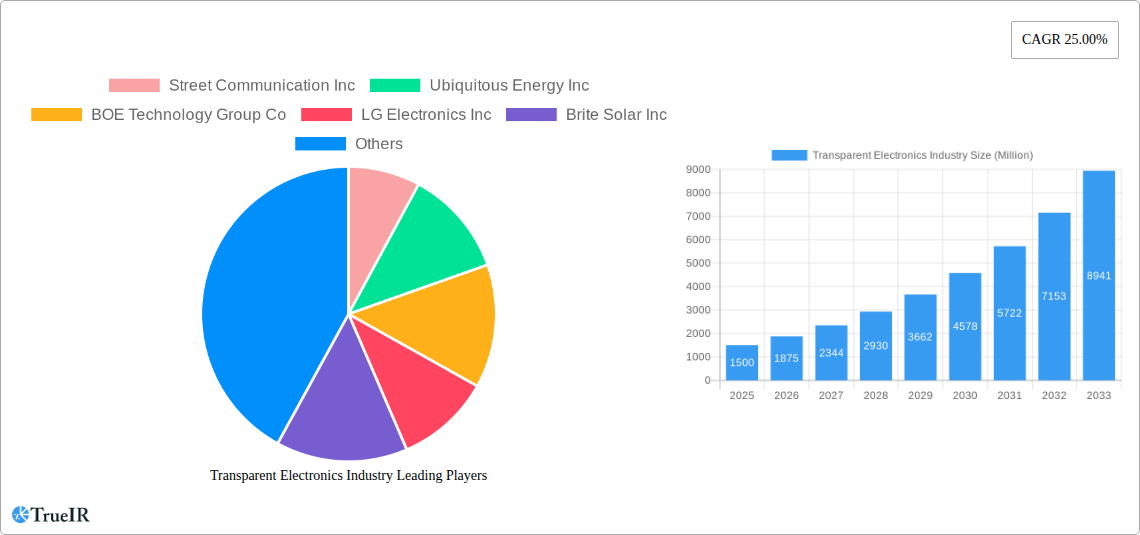
The Transparent Electronics Industry is characterized by a moderately concentrated market structure, with key players like BOE Technology Group Co, LG Electronics Inc, and Panasonic Corporation holding significant market share. However, the presence of several innovative startups, including Street Communication Inc and Ubiquitous Energy Inc, indicates a dynamic competitive landscape. The industry is driven by continuous innovation in materials science and display technology, leading to advancements in transparent displays and solar panels. Regulatory frameworks concerning energy efficiency and sustainable building practices are increasingly influencing market growth. Product substitution, primarily from traditional display technologies, poses a challenge, yet the unique functionalities of transparent electronics are creating new market niches. Mergers and acquisitions (M&A) activity is moderate, with a total volume of approximately XX Million USD recorded between 2019 and 2024, mostly focusing on enhancing technological capabilities and expanding market reach. End-user segmentation is crucial, with significant growth potential across Automotive, Building Infrastructure, and Consumer Electronics sectors.
- Market Concentration: The Herfindahl-Hirschman Index (HHI) is estimated at XX, suggesting a moderately concentrated market.
- Innovation Drivers: Advancements in materials science (e.g., transparent conductors, flexible substrates), display technologies (e.g., OLED, microLED), and energy harvesting technologies.
- Regulatory Impacts: Government incentives for energy-efficient buildings and electric vehicles are significantly boosting demand.
- Product Substitutes: Traditional displays and opaque solar panels pose some competition, but the unique advantages of transparent electronics are driving adoption.
- M&A Trends: Consolidation is expected to increase as larger companies seek to acquire smaller innovative firms.
Transparent Electronics Industry Market Trends & Opportunities
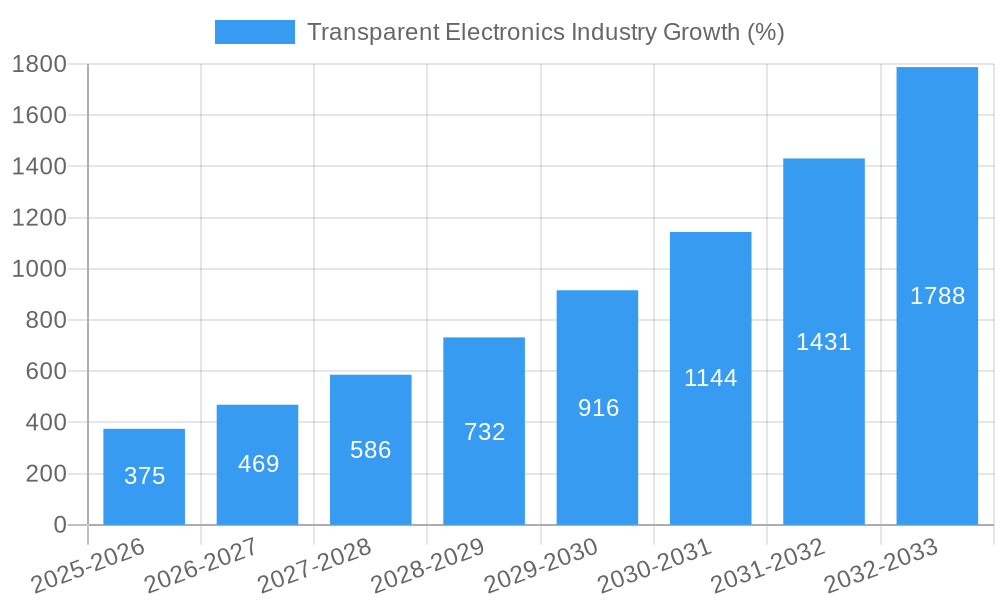
The Transparent Electronics Industry is experiencing robust growth, with a projected Compound Annual Growth Rate (CAGR) of XX% during the forecast period (2025-2033). This growth is primarily driven by the increasing demand for energy-efficient solutions in buildings and vehicles, along with the rising popularity of smart devices and interactive displays. Technological advancements, such as the development of more efficient transparent solar cells and flexible displays, are further fueling market expansion. Consumer preference for aesthetically pleasing and functional products is driving the adoption of transparent electronics in various applications. Competitive dynamics are shaping the market, with companies focusing on product differentiation and cost reduction strategies. Market penetration rates are steadily increasing across various segments, particularly in the automotive and consumer electronics sectors, reaching an estimated XX% by 2033.
Dominant Markets & Segments in Transparent Electronics Industry
The Asia-Pacific region, particularly China and South Korea, is currently the dominant market for transparent electronics, driven by strong technological advancements, manufacturing capabilities, and government support. Within the product segments, Transparent Displays are leading the market, followed by Transparent Solar Panels. The automotive and building infrastructure sectors are the primary end-user industries driving the demand for transparent electronics.
- Key Growth Drivers:
- Automotive: Growing demand for advanced driver-assistance systems (ADAS) and head-up displays (HUDs).
- Building Infrastructure: Increased focus on energy-efficient buildings and smart city initiatives.
- Consumer Electronics: Rising demand for interactive displays, smart windows, and transparent mobile devices.
- Government Policies: Supportive regulations and incentives for renewable energy and energy-efficient technologies.
The dominance of Asia-Pacific is attributed to the concentration of manufacturing hubs and a strong focus on technological innovation within this region.
Transparent Electronics Industry Product Analysis
The Transparent Electronics market showcases a diverse range of products including transparent displays, solar panels, smart windows, and other specialized applications. Technological advancements are focused on improving transparency, efficiency, and durability. Transparent OLED (organic light-emitting diode) displays are gaining popularity due to their superior image quality and flexibility. Similarly, advancements in Perovskite solar cells are enhancing the efficiency of transparent solar panels. The market fit for these products is exceptionally high due to their unique functionality and aesthetic appeal, catering to the growing demands across diverse sectors.
Key Drivers, Barriers & Challenges in Transparent Electronics Industry
Key Drivers: Technological advancements (e.g., improved transparent conductors, higher efficiency solar cells), rising demand for energy-efficient solutions, and government regulations promoting sustainable technologies are major growth drivers.
Challenges: High manufacturing costs, limited availability of raw materials, and the need for further improvements in durability and performance are crucial challenges. Supply chain disruptions and intense competition from established players in related markets are also potential risks. Regulatory hurdles concerning product safety and environmental standards may also slow down market growth. The estimated impact of these challenges on market growth is approximately a reduction of XX% by 2033.
Growth Drivers in the Transparent Electronics Industry Market
Technological innovations, notably advancements in flexible and transparent display technologies, along with increasing demand for energy-efficient and aesthetically appealing products, are key drivers. Government incentives for green building and renewable energy solutions are also propelling market growth.
Challenges Impacting Transparent Electronics Industry Growth
High manufacturing costs, supply chain vulnerabilities, and stringent regulatory compliance requirements remain significant challenges. The development of robust and durable products at competitive price points is crucial for sustained market growth.
Key Players Shaping the Transparent Electronics Industry Market
- Street Communication Inc
- Ubiquitous Energy Inc
- BOE Technology Group Co
- LG Electronics Inc
- Brite Solar Inc
- Panasonic Corporation
- ClearLED Ltd
- Shenzhen Nexnovo Technology Co Ltd
- Shenzhen AuroLED Technology Co Ltd
- Corning Incorporated
Significant Transparent Electronics Industry Industry Milestones
- 2020: Street Communication Inc launches a new transparent display technology.
- 2021: Ubiquitous Energy Inc announces a breakthrough in transparent solar cell efficiency.
- 2022: BOE Technology Group Co begins mass production of transparent OLED displays.
- 2023: LG Electronics Inc integrates transparent displays into its new line of automobiles.
- 2024: A major merger between two key players reshapes the industry landscape. (Specific details not available at this time).
Future Outlook for Transparent Electronics Industry Market
The transparent electronics market is poised for significant growth, driven by continuous technological innovation, increasing demand across various sectors, and supportive government policies. Strategic partnerships and product diversification will be key to success in this dynamic and competitive market. The market is expected to witness substantial expansion across diverse application areas, providing lucrative opportunities for businesses and investors. The unique features and functionality of transparent electronics will continue to drive market penetration, leading to a bright future for this rapidly evolving industry.
Transparent Electronics Industry Segmentation
-
1. Product
- 1.1. Transparent Displays
- 1.2. Transparent Solar Panels
- 1.3. Smart Windows
- 1.4. Other Products
-
2. End-user Industry Application
- 2.1. Automotive
- 2.2. Building Infrastructure
- 2.3. Consumer Electronics
- 2.4. Other End-user Industry
Transparent Electronics Industry Segmentation By Geography
- 1. North America
- 2. Europe
- 3. Asia Pacific
- 4. Rest of the World
Transparent Electronics Industry REPORT HIGHLIGHTS
| Aspects | Details |
|---|---|
| Study Period | 2019-2033 |
| Base Year | 2024 |
| Estimated Year | 2025 |
| Forecast Period | 2025-2033 |
| Historical Period | 2019-2024 |
| Growth Rate | CAGR of 25.00% from 2019-2033 |
| Segmentation |
|
Table of Contents
- 1. Introduction
- 1.1. Research Scope
- 1.2. Market Segmentation
- 1.3. Research Methodology
- 1.4. Definitions and Assumptions
- 2. Executive Summary
- 2.1. Introduction
- 3. Market Dynamics
- 3.1. Introduction
- 3.2. Market Drivers
- 3.2.1. ; Growing Penetration of Touch-Enabled Electronic Devices
- 3.3. Market Restrains
- 3.3.1. Data Security and Privacy
- 3.4. Market Trends
- 3.4.1. Transparent Display Through AMOLED in Smartphone to Witness a Market Growth
- 4. Market Factor Analysis
- 4.1. Porters Five Forces
- 4.2. Supply/Value Chain
- 4.3. PESTEL analysis
- 4.4. Market Entropy
- 4.5. Patent/Trademark Analysis
- 5. Global Transparent Electronics Industry Analysis, Insights and Forecast, 2019-2031
- 5.1. Market Analysis, Insights and Forecast - by Product
- 5.1.1. Transparent Displays
- 5.1.2. Transparent Solar Panels
- 5.1.3. Smart Windows
- 5.1.4. Other Products
- 5.2. Market Analysis, Insights and Forecast - by End-user Industry Application
- 5.2.1. Automotive
- 5.2.2. Building Infrastructure
- 5.2.3. Consumer Electronics
- 5.2.4. Other End-user Industry
- 5.3. Market Analysis, Insights and Forecast - by Region
- 5.3.1. North America
- 5.3.2. Europe
- 5.3.3. Asia Pacific
- 5.3.4. Rest of the World
- 5.1. Market Analysis, Insights and Forecast - by Product
- 6. North America Transparent Electronics Industry Analysis, Insights and Forecast, 2019-2031
- 6.1. Market Analysis, Insights and Forecast - by Product
- 6.1.1. Transparent Displays
- 6.1.2. Transparent Solar Panels
- 6.1.3. Smart Windows
- 6.1.4. Other Products
- 6.2. Market Analysis, Insights and Forecast - by End-user Industry Application
- 6.2.1. Automotive
- 6.2.2. Building Infrastructure
- 6.2.3. Consumer Electronics
- 6.2.4. Other End-user Industry
- 6.1. Market Analysis, Insights and Forecast - by Product
- 7. Europe Transparent Electronics Industry Analysis, Insights and Forecast, 2019-2031
- 7.1. Market Analysis, Insights and Forecast - by Product
- 7.1.1. Transparent Displays
- 7.1.2. Transparent Solar Panels
- 7.1.3. Smart Windows
- 7.1.4. Other Products
- 7.2. Market Analysis, Insights and Forecast - by End-user Industry Application
- 7.2.1. Automotive
- 7.2.2. Building Infrastructure
- 7.2.3. Consumer Electronics
- 7.2.4. Other End-user Industry
- 7.1. Market Analysis, Insights and Forecast - by Product
- 8. Asia Pacific Transparent Electronics Industry Analysis, Insights and Forecast, 2019-2031
- 8.1. Market Analysis, Insights and Forecast - by Product
- 8.1.1. Transparent Displays
- 8.1.2. Transparent Solar Panels
- 8.1.3. Smart Windows
- 8.1.4. Other Products
- 8.2. Market Analysis, Insights and Forecast - by End-user Industry Application
- 8.2.1. Automotive
- 8.2.2. Building Infrastructure
- 8.2.3. Consumer Electronics
- 8.2.4. Other End-user Industry
- 8.1. Market Analysis, Insights and Forecast - by Product
- 9. Rest of the World Transparent Electronics Industry Analysis, Insights and Forecast, 2019-2031
- 9.1. Market Analysis, Insights and Forecast - by Product
- 9.1.1. Transparent Displays
- 9.1.2. Transparent Solar Panels
- 9.1.3. Smart Windows
- 9.1.4. Other Products
- 9.2. Market Analysis, Insights and Forecast - by End-user Industry Application
- 9.2.1. Automotive
- 9.2.2. Building Infrastructure
- 9.2.3. Consumer Electronics
- 9.2.4. Other End-user Industry
- 9.1. Market Analysis, Insights and Forecast - by Product
- 10. North America Transparent Electronics Industry Analysis, Insights and Forecast, 2019-2031
- 10.1. Market Analysis, Insights and Forecast - By Country/Sub-region
- 10.1.1 United States
- 10.1.2 Canada
- 10.1.3 Mexico
- 11. Europe Transparent Electronics Industry Analysis, Insights and Forecast, 2019-2031
- 11.1. Market Analysis, Insights and Forecast - By Country/Sub-region
- 11.1.1 Germany
- 11.1.2 United Kingdom
- 11.1.3 France
- 11.1.4 Spain
- 11.1.5 Italy
- 11.1.6 Spain
- 11.1.7 Belgium
- 11.1.8 Netherland
- 11.1.9 Nordics
- 11.1.10 Rest of Europe
- 12. Asia Pacific Transparent Electronics Industry Analysis, Insights and Forecast, 2019-2031
- 12.1. Market Analysis, Insights and Forecast - By Country/Sub-region
- 12.1.1 China
- 12.1.2 Japan
- 12.1.3 India
- 12.1.4 South Korea
- 12.1.5 Southeast Asia
- 12.1.6 Australia
- 12.1.7 Indonesia
- 12.1.8 Phillipes
- 12.1.9 Singapore
- 12.1.10 Thailandc
- 12.1.11 Rest of Asia Pacific
- 13. South America Transparent Electronics Industry Analysis, Insights and Forecast, 2019-2031
- 13.1. Market Analysis, Insights and Forecast - By Country/Sub-region
- 13.1.1 Brazil
- 13.1.2 Argentina
- 13.1.3 Peru
- 13.1.4 Chile
- 13.1.5 Colombia
- 13.1.6 Ecuador
- 13.1.7 Venezuela
- 13.1.8 Rest of South America
- 14. North America Transparent Electronics Industry Analysis, Insights and Forecast, 2019-2031
- 14.1. Market Analysis, Insights and Forecast - By Country/Sub-region
- 14.1.1 United States
- 14.1.2 Canada
- 14.1.3 Mexico
- 15. MEA Transparent Electronics Industry Analysis, Insights and Forecast, 2019-2031
- 15.1. Market Analysis, Insights and Forecast - By Country/Sub-region
- 15.1.1 United Arab Emirates
- 15.1.2 Saudi Arabia
- 15.1.3 South Africa
- 15.1.4 Rest of Middle East and Africa
- 16. Competitive Analysis
- 16.1. Global Market Share Analysis 2024
- 16.2. Company Profiles
- 16.2.1 Street Communication Inc
- 16.2.1.1. Overview
- 16.2.1.2. Products
- 16.2.1.3. SWOT Analysis
- 16.2.1.4. Recent Developments
- 16.2.1.5. Financials (Based on Availability)
- 16.2.2 Ubiquitous Energy Inc
- 16.2.2.1. Overview
- 16.2.2.2. Products
- 16.2.2.3. SWOT Analysis
- 16.2.2.4. Recent Developments
- 16.2.2.5. Financials (Based on Availability)
- 16.2.3 BOE Technology Group Co
- 16.2.3.1. Overview
- 16.2.3.2. Products
- 16.2.3.3. SWOT Analysis
- 16.2.3.4. Recent Developments
- 16.2.3.5. Financials (Based on Availability)
- 16.2.4 LG Electronics Inc
- 16.2.4.1. Overview
- 16.2.4.2. Products
- 16.2.4.3. SWOT Analysis
- 16.2.4.4. Recent Developments
- 16.2.4.5. Financials (Based on Availability)
- 16.2.5 Brite Solar Inc
- 16.2.5.1. Overview
- 16.2.5.2. Products
- 16.2.5.3. SWOT Analysis
- 16.2.5.4. Recent Developments
- 16.2.5.5. Financials (Based on Availability)
- 16.2.6 Panasonic Corporation
- 16.2.6.1. Overview
- 16.2.6.2. Products
- 16.2.6.3. SWOT Analysis
- 16.2.6.4. Recent Developments
- 16.2.6.5. Financials (Based on Availability)
- 16.2.7 ClearLED Ltd
- 16.2.7.1. Overview
- 16.2.7.2. Products
- 16.2.7.3. SWOT Analysis
- 16.2.7.4. Recent Developments
- 16.2.7.5. Financials (Based on Availability)
- 16.2.8 Shenzhen Nexnovo Technology Co Ltd
- 16.2.8.1. Overview
- 16.2.8.2. Products
- 16.2.8.3. SWOT Analysis
- 16.2.8.4. Recent Developments
- 16.2.8.5. Financials (Based on Availability)
- 16.2.9 Shenzhen AuroLED Technology Co Ltd
- 16.2.9.1. Overview
- 16.2.9.2. Products
- 16.2.9.3. SWOT Analysis
- 16.2.9.4. Recent Developments
- 16.2.9.5. Financials (Based on Availability)
- 16.2.10 Corning Incorporated
- 16.2.10.1. Overview
- 16.2.10.2. Products
- 16.2.10.3. SWOT Analysis
- 16.2.10.4. Recent Developments
- 16.2.10.5. Financials (Based on Availability)
- 16.2.1 Street Communication Inc
List of Figures
- Figure 1: Global Transparent Electronics Industry Revenue Breakdown (Million, %) by Region 2024 & 2032
- Figure 2: North America Transparent Electronics Industry Revenue (Million), by Country 2024 & 2032
- Figure 3: North America Transparent Electronics Industry Revenue Share (%), by Country 2024 & 2032
- Figure 4: Europe Transparent Electronics Industry Revenue (Million), by Country 2024 & 2032
- Figure 5: Europe Transparent Electronics Industry Revenue Share (%), by Country 2024 & 2032
- Figure 6: Asia Pacific Transparent Electronics Industry Revenue (Million), by Country 2024 & 2032
- Figure 7: Asia Pacific Transparent Electronics Industry Revenue Share (%), by Country 2024 & 2032
- Figure 8: South America Transparent Electronics Industry Revenue (Million), by Country 2024 & 2032
- Figure 9: South America Transparent Electronics Industry Revenue Share (%), by Country 2024 & 2032
- Figure 10: North America Transparent Electronics Industry Revenue (Million), by Country 2024 & 2032
- Figure 11: North America Transparent Electronics Industry Revenue Share (%), by Country 2024 & 2032
- Figure 12: MEA Transparent Electronics Industry Revenue (Million), by Country 2024 & 2032
- Figure 13: MEA Transparent Electronics Industry Revenue Share (%), by Country 2024 & 2032
- Figure 14: North America Transparent Electronics Industry Revenue (Million), by Product 2024 & 2032
- Figure 15: North America Transparent Electronics Industry Revenue Share (%), by Product 2024 & 2032
- Figure 16: North America Transparent Electronics Industry Revenue (Million), by End-user Industry Application 2024 & 2032
- Figure 17: North America Transparent Electronics Industry Revenue Share (%), by End-user Industry Application 2024 & 2032
- Figure 18: North America Transparent Electronics Industry Revenue (Million), by Country 2024 & 2032
- Figure 19: North America Transparent Electronics Industry Revenue Share (%), by Country 2024 & 2032
- Figure 20: Europe Transparent Electronics Industry Revenue (Million), by Product 2024 & 2032
- Figure 21: Europe Transparent Electronics Industry Revenue Share (%), by Product 2024 & 2032
- Figure 22: Europe Transparent Electronics Industry Revenue (Million), by End-user Industry Application 2024 & 2032
- Figure 23: Europe Transparent Electronics Industry Revenue Share (%), by End-user Industry Application 2024 & 2032
- Figure 24: Europe Transparent Electronics Industry Revenue (Million), by Country 2024 & 2032
- Figure 25: Europe Transparent Electronics Industry Revenue Share (%), by Country 2024 & 2032
- Figure 26: Asia Pacific Transparent Electronics Industry Revenue (Million), by Product 2024 & 2032
- Figure 27: Asia Pacific Transparent Electronics Industry Revenue Share (%), by Product 2024 & 2032
- Figure 28: Asia Pacific Transparent Electronics Industry Revenue (Million), by End-user Industry Application 2024 & 2032
- Figure 29: Asia Pacific Transparent Electronics Industry Revenue Share (%), by End-user Industry Application 2024 & 2032
- Figure 30: Asia Pacific Transparent Electronics Industry Revenue (Million), by Country 2024 & 2032
- Figure 31: Asia Pacific Transparent Electronics Industry Revenue Share (%), by Country 2024 & 2032
- Figure 32: Rest of the World Transparent Electronics Industry Revenue (Million), by Product 2024 & 2032
- Figure 33: Rest of the World Transparent Electronics Industry Revenue Share (%), by Product 2024 & 2032
- Figure 34: Rest of the World Transparent Electronics Industry Revenue (Million), by End-user Industry Application 2024 & 2032
- Figure 35: Rest of the World Transparent Electronics Industry Revenue Share (%), by End-user Industry Application 2024 & 2032
- Figure 36: Rest of the World Transparent Electronics Industry Revenue (Million), by Country 2024 & 2032
- Figure 37: Rest of the World Transparent Electronics Industry Revenue Share (%), by Country 2024 & 2032
List of Tables
- Table 1: Global Transparent Electronics Industry Revenue Million Forecast, by Region 2019 & 2032
- Table 2: Global Transparent Electronics Industry Revenue Million Forecast, by Product 2019 & 2032
- Table 3: Global Transparent Electronics Industry Revenue Million Forecast, by End-user Industry Application 2019 & 2032
- Table 4: Global Transparent Electronics Industry Revenue Million Forecast, by Region 2019 & 2032
- Table 5: Global Transparent Electronics Industry Revenue Million Forecast, by Country 2019 & 2032
- Table 6: United States Transparent Electronics Industry Revenue (Million) Forecast, by Application 2019 & 2032
- Table 7: Canada Transparent Electronics Industry Revenue (Million) Forecast, by Application 2019 & 2032
- Table 8: Mexico Transparent Electronics Industry Revenue (Million) Forecast, by Application 2019 & 2032
- Table 9: Global Transparent Electronics Industry Revenue Million Forecast, by Country 2019 & 2032
- Table 10: Germany Transparent Electronics Industry Revenue (Million) Forecast, by Application 2019 & 2032
- Table 11: United Kingdom Transparent Electronics Industry Revenue (Million) Forecast, by Application 2019 & 2032
- Table 12: France Transparent Electronics Industry Revenue (Million) Forecast, by Application 2019 & 2032
- Table 13: Spain Transparent Electronics Industry Revenue (Million) Forecast, by Application 2019 & 2032
- Table 14: Italy Transparent Electronics Industry Revenue (Million) Forecast, by Application 2019 & 2032
- Table 15: Spain Transparent Electronics Industry Revenue (Million) Forecast, by Application 2019 & 2032
- Table 16: Belgium Transparent Electronics Industry Revenue (Million) Forecast, by Application 2019 & 2032
- Table 17: Netherland Transparent Electronics Industry Revenue (Million) Forecast, by Application 2019 & 2032
- Table 18: Nordics Transparent Electronics Industry Revenue (Million) Forecast, by Application 2019 & 2032
- Table 19: Rest of Europe Transparent Electronics Industry Revenue (Million) Forecast, by Application 2019 & 2032
- Table 20: Global Transparent Electronics Industry Revenue Million Forecast, by Country 2019 & 2032
- Table 21: China Transparent Electronics Industry Revenue (Million) Forecast, by Application 2019 & 2032
- Table 22: Japan Transparent Electronics Industry Revenue (Million) Forecast, by Application 2019 & 2032
- Table 23: India Transparent Electronics Industry Revenue (Million) Forecast, by Application 2019 & 2032
- Table 24: South Korea Transparent Electronics Industry Revenue (Million) Forecast, by Application 2019 & 2032
- Table 25: Southeast Asia Transparent Electronics Industry Revenue (Million) Forecast, by Application 2019 & 2032
- Table 26: Australia Transparent Electronics Industry Revenue (Million) Forecast, by Application 2019 & 2032
- Table 27: Indonesia Transparent Electronics Industry Revenue (Million) Forecast, by Application 2019 & 2032
- Table 28: Phillipes Transparent Electronics Industry Revenue (Million) Forecast, by Application 2019 & 2032
- Table 29: Singapore Transparent Electronics Industry Revenue (Million) Forecast, by Application 2019 & 2032
- Table 30: Thailandc Transparent Electronics Industry Revenue (Million) Forecast, by Application 2019 & 2032
- Table 31: Rest of Asia Pacific Transparent Electronics Industry Revenue (Million) Forecast, by Application 2019 & 2032
- Table 32: Global Transparent Electronics Industry Revenue Million Forecast, by Country 2019 & 2032
- Table 33: Brazil Transparent Electronics Industry Revenue (Million) Forecast, by Application 2019 & 2032
- Table 34: Argentina Transparent Electronics Industry Revenue (Million) Forecast, by Application 2019 & 2032
- Table 35: Peru Transparent Electronics Industry Revenue (Million) Forecast, by Application 2019 & 2032
- Table 36: Chile Transparent Electronics Industry Revenue (Million) Forecast, by Application 2019 & 2032
- Table 37: Colombia Transparent Electronics Industry Revenue (Million) Forecast, by Application 2019 & 2032
- Table 38: Ecuador Transparent Electronics Industry Revenue (Million) Forecast, by Application 2019 & 2032
- Table 39: Venezuela Transparent Electronics Industry Revenue (Million) Forecast, by Application 2019 & 2032
- Table 40: Rest of South America Transparent Electronics Industry Revenue (Million) Forecast, by Application 2019 & 2032
- Table 41: Global Transparent Electronics Industry Revenue Million Forecast, by Country 2019 & 2032
- Table 42: United States Transparent Electronics Industry Revenue (Million) Forecast, by Application 2019 & 2032
- Table 43: Canada Transparent Electronics Industry Revenue (Million) Forecast, by Application 2019 & 2032
- Table 44: Mexico Transparent Electronics Industry Revenue (Million) Forecast, by Application 2019 & 2032
- Table 45: Global Transparent Electronics Industry Revenue Million Forecast, by Country 2019 & 2032
- Table 46: United Arab Emirates Transparent Electronics Industry Revenue (Million) Forecast, by Application 2019 & 2032
- Table 47: Saudi Arabia Transparent Electronics Industry Revenue (Million) Forecast, by Application 2019 & 2032
- Table 48: South Africa Transparent Electronics Industry Revenue (Million) Forecast, by Application 2019 & 2032
- Table 49: Rest of Middle East and Africa Transparent Electronics Industry Revenue (Million) Forecast, by Application 2019 & 2032
- Table 50: Global Transparent Electronics Industry Revenue Million Forecast, by Product 2019 & 2032
- Table 51: Global Transparent Electronics Industry Revenue Million Forecast, by End-user Industry Application 2019 & 2032
- Table 52: Global Transparent Electronics Industry Revenue Million Forecast, by Country 2019 & 2032
- Table 53: Global Transparent Electronics Industry Revenue Million Forecast, by Product 2019 & 2032
- Table 54: Global Transparent Electronics Industry Revenue Million Forecast, by End-user Industry Application 2019 & 2032
- Table 55: Global Transparent Electronics Industry Revenue Million Forecast, by Country 2019 & 2032
- Table 56: Global Transparent Electronics Industry Revenue Million Forecast, by Product 2019 & 2032
- Table 57: Global Transparent Electronics Industry Revenue Million Forecast, by End-user Industry Application 2019 & 2032
- Table 58: Global Transparent Electronics Industry Revenue Million Forecast, by Country 2019 & 2032
- Table 59: Global Transparent Electronics Industry Revenue Million Forecast, by Product 2019 & 2032
- Table 60: Global Transparent Electronics Industry Revenue Million Forecast, by End-user Industry Application 2019 & 2032
- Table 61: Global Transparent Electronics Industry Revenue Million Forecast, by Country 2019 & 2032
Frequently Asked Questions
1. What is the projected Compound Annual Growth Rate (CAGR) of the Transparent Electronics Industry?
The projected CAGR is approximately 25.00%.
2. Which companies are prominent players in the Transparent Electronics Industry?
Key companies in the market include Street Communication Inc, Ubiquitous Energy Inc, BOE Technology Group Co, LG Electronics Inc, Brite Solar Inc, Panasonic Corporation, ClearLED Ltd, Shenzhen Nexnovo Technology Co Ltd, Shenzhen AuroLED Technology Co Ltd, Corning Incorporated.
3. What are the main segments of the Transparent Electronics Industry?
The market segments include Product, End-user Industry Application.
4. Can you provide details about the market size?
The market size is estimated to be USD XX Million as of 2022.
5. What are some drivers contributing to market growth?
; Growing Penetration of Touch-Enabled Electronic Devices.
6. What are the notable trends driving market growth?
Transparent Display Through AMOLED in Smartphone to Witness a Market Growth.
7. Are there any restraints impacting market growth?
Data Security and Privacy.
8. Can you provide examples of recent developments in the market?
N/A
9. What pricing options are available for accessing the report?
Pricing options include single-user, multi-user, and enterprise licenses priced at USD 4750, USD 5250, and USD 8750 respectively.
10. Is the market size provided in terms of value or volume?
The market size is provided in terms of value, measured in Million.
11. Are there any specific market keywords associated with the report?
Yes, the market keyword associated with the report is "Transparent Electronics Industry," which aids in identifying and referencing the specific market segment covered.
12. How do I determine which pricing option suits my needs best?
The pricing options vary based on user requirements and access needs. Individual users may opt for single-user licenses, while businesses requiring broader access may choose multi-user or enterprise licenses for cost-effective access to the report.
13. Are there any additional resources or data provided in the Transparent Electronics Industry report?
While the report offers comprehensive insights, it's advisable to review the specific contents or supplementary materials provided to ascertain if additional resources or data are available.
14. How can I stay updated on further developments or reports in the Transparent Electronics Industry?
To stay informed about further developments, trends, and reports in the Transparent Electronics Industry, consider subscribing to industry newsletters, following relevant companies and organizations, or regularly checking reputable industry news sources and publications.
Methodology
Step 1 - Identification of Relevant Samples Size from Population Database


Step 2 - Approaches for Defining Global Market Size (Value, Volume* & Price*)

Note*: In applicable scenarios
Step 3 - Data Sources
Primary Research
- Web Analytics
- Survey Reports
- Research Institute
- Latest Research Reports
- Opinion Leaders
Secondary Research
- Annual Reports
- White Paper
- Latest Press Release
- Industry Association
- Paid Database
- Investor Presentations

Step 4 - Data Triangulation
Involves using different sources of information in order to increase the validity of a study
These sources are likely to be stakeholders in a program - participants, other researchers, program staff, other community members, and so on.
Then we put all data in single framework & apply various statistical tools to find out the dynamic on the market.
During the analysis stage, feedback from the stakeholder groups would be compared to determine areas of agreement as well as areas of divergence
