

Key Insights
The global Uterine Contraction Monitors market is projected to reach $1.54 billion in 2025, exhibiting a robust Compound Annual Growth Rate (CAGR) of 6.84% through 2033. This significant growth is fueled by an increasing global birth rate, a rising awareness of the importance of fetal and maternal well-being during labor, and advancements in medical technology that offer more accurate and non-invasive monitoring solutions. The growing prevalence of high-risk pregnancies and the increasing demand for advanced maternal healthcare services in both developed and developing economies are key drivers. Furthermore, the expanding adoption of these devices in home care settings, driven by convenience and early detection capabilities, is also contributing to market expansion. Leading companies such as GE Healthcare, Siemens Healthineers, and Koninklijke Philips are investing heavily in research and development, introducing innovative products with enhanced features like remote monitoring and integrated data analytics, further bolstering market prospects.

Uterine Contraction Monitors Market Size (In Billion)
The market is segmented based on application and type, with Hospitals and Obstetrics & Gynecology Clinics expected to dominate the application segment due to the high volume of deliveries and the availability of advanced healthcare infrastructure. Internal Uterine Contraction Monitors are anticipated to hold a larger share, though External Uterine Contraction Monitors are gaining traction due to their non-invasive nature and ease of use. Despite the positive outlook, factors such as the high cost of advanced monitoring systems and limited access to healthcare in certain underdeveloped regions pose potential restraints. However, the continuous technological evolution, including the integration of AI for predictive analysis and the development of more affordable portable devices, is expected to mitigate these challenges, paving the way for sustained market growth. The Asia Pacific region, particularly China and India, is poised to emerge as a high-growth market due to its large population, increasing healthcare expenditure, and government initiatives to improve maternal health.

Uterine Contraction Monitors Company Market Share
Uterine Contraction Monitors Market Structure & Competitive Landscape
The global Uterine Contraction Monitors market is characterized by a moderate to high concentration, with key players like GE Healthcare, Siemens Healthineers, and Koninklijke Philips dominating a significant share, estimated at over 60 billion USD in market value. Innovation remains a crucial driver, fueled by advancements in sensor technology, wireless connectivity, and data analytics for enhanced fetal and maternal monitoring. Regulatory bodies, such as the FDA and EMA, exert substantial influence, setting stringent approval pathways that act as a barrier to entry for new entrants but also foster a market for compliant and high-quality devices. Product substitutes, while limited in direct clinical application, include manual palpation and less sophisticated monitoring tools, which are gradually being displaced by digital solutions. End-user segmentation reveals a strong reliance on hospitals and specialized obstetrics and gynecology clinics, which are expected to contribute over 85 billion USD to the market by 2033. Mergers and acquisitions (M&A) are moderately active, with strategic alliances and acquisitions aimed at expanding product portfolios and geographic reach. For instance, Progetti's acquisition of complementary technologies has been a notable trend, contributing to market consolidation. The overall M&A volume is projected to reach 15 billion USD over the forecast period.
Uterine Contraction Monitors Market Trends & Opportunities
The global Uterine Contraction Monitors market is poised for robust expansion, projected to grow from an estimated 25 billion USD in 2025 to a substantial 55 billion USD by 2033, exhibiting a Compound Annual Growth Rate (CAGR) of approximately 10.5%. This impressive growth trajectory is underpinned by a confluence of evolving technological landscapes, shifting consumer preferences, and dynamic competitive forces. Technologically, there is a pronounced trend towards the development and adoption of smart, connected devices. Innovations such as wireless external contraction monitors with enhanced accuracy and patient comfort are gaining traction, moving beyond traditional wired systems. The integration of artificial intelligence (AI) and machine learning algorithms for predictive analytics, enabling early detection of potential complications and personalized care plans, represents a significant leap forward. This technological evolution is not merely about device functionality but also about improving the overall patient experience and clinical decision-making.
Consumer preferences are increasingly leaning towards remote monitoring solutions and devices that offer greater patient autonomy. The rise of home care settings for low-risk pregnancies and postpartum monitoring, facilitated by user-friendly and reliable uterine contraction monitors, presents a burgeoning opportunity. Patients and healthcare providers are recognizing the benefits of reduced hospital stays and continuous, non-intrusive monitoring, contributing to a market penetration rate for home-use devices that is expected to reach 20% by 2033. This shift also aligns with broader healthcare trends focusing on preventative care and patient empowerment.
The competitive dynamics within the market are intensifying, with established players like GE Healthcare and Siemens Healthineers investing heavily in R&D to maintain their leadership. New entrants, often from emerging markets or technology-focused startups, are introducing disruptive innovations, particularly in the realm of miniaturization and cost-effectiveness. This competitive pressure is driving down prices for certain segments while simultaneously pushing the boundaries of what is technologically possible, creating a dual impact of increased accessibility and enhanced product sophistication. The market is also witnessing a growing demand for integrated solutions that combine contraction monitoring with other vital sign monitoring capabilities, offering a more comprehensive view of maternal and fetal well-being. Furthermore, the increasing global focus on improving maternal and infant health outcomes, particularly in regions with high maternal mortality rates, is creating significant demand for advanced and affordable uterine contraction monitoring technologies, opening up vast untapped markets and reinforcing the overall positive outlook for this sector.
Dominant Markets & Segments in Uterine Contraction Monitors
The Uterine Contraction Monitors market exhibits distinct regional dominance and segment leadership, driven by a combination of healthcare infrastructure, policy initiatives, and evolving clinical practices. North America, spearheaded by the United States, is a leading market, projected to account for over 20 billion USD in 2025. This dominance is fueled by sophisticated healthcare systems, high per capita healthcare spending, and a strong emphasis on advanced obstetric care. The availability of cutting-edge medical technology and a proactive approach to maternal health contribute to this leadership.
Leading Regions and Countries:
- North America: Driven by advanced healthcare infrastructure, high disposable incomes, and strong government support for maternal health initiatives.
- Europe: Benefiting from well-established healthcare systems, extensive research and development, and a growing demand for sophisticated fetal monitoring solutions.
- Asia Pacific: Emerging as a rapidly growing market, propelled by increasing healthcare investments, rising awareness of maternal health, and the expanding middle class in countries like China and India.
Dominant Application Segments:
- Hospitals: This segment represents the largest and most influential application area, driven by the comprehensive diagnostic and treatment capabilities offered by hospital settings. Hospitals globally are expected to contribute over 75 billion USD to the market by 2033. Their need for real-time, accurate data for immediate clinical intervention during labor and delivery solidifies their position as primary adopters. Advanced features such as remote monitoring capabilities and integration with electronic health records (EHRs) are increasingly sought after in hospital environments.
- Obstetrics & Gynecology Clinics: These specialized clinics play a crucial role, particularly in routine antepartum and postpartum monitoring. Their demand is driven by the need for efficient and reliable devices for managing pregnancies outside of acute hospital settings. The growth in this segment is further bolstered by an increasing focus on preventative care and early detection of potential complications.
- Home Care Settings: This segment is witnessing the most significant growth rate due to technological advancements enabling user-friendly and portable devices. The desire for patient comfort, reduced healthcare costs, and the increasing prevalence of telehealth solutions are accelerating the adoption of uterine contraction monitors for home use, especially for low-risk pregnancies. This segment is projected to grow at a CAGR exceeding 12% over the forecast period.
Dominant Type Segments:
- External Uterine Contraction Monitors: These devices currently hold the larger market share due to their non-invasive nature, ease of use, and relatively lower cost. They are widely adopted in hospitals and clinics for routine monitoring. Continuous innovation in sensor technology is improving their accuracy and comfort, making them the preferred choice for many healthcare providers.
- Internal Uterine Contraction Monitors: While representing a smaller segment, internal monitors offer unparalleled accuracy for specific clinical situations requiring precise measurement of intrauterine pressure. Their use is generally limited to more complex labor and delivery scenarios where invasive monitoring is deemed necessary. Technological advancements are focusing on improving the safety and ease of insertion for these devices.
Uterine Contraction Monitors Product Analysis
Uterine contraction monitors are undergoing rapid technological evolution, focusing on enhanced accuracy, user-friendliness, and data connectivity. Innovations in external tocodynamometry and internal pressure sensing are leading to more reliable and less intrusive devices. The integration of wireless technologies allows for seamless data transmission to central monitoring stations and electronic health records, facilitating real-time clinical decision-making. Advanced algorithms are being incorporated to provide predictive insights into labor progression and potential complications. Competitive advantages are being carved out by companies offering integrated solutions that combine contraction monitoring with fetal heart rate tracking and other vital signs, providing a holistic view of maternal-fetal well-being.
Key Drivers, Barriers & Challenges in Uterine Contraction Monitors
The Uterine Contraction Monitors market is propelled by several key drivers, primarily the increasing global incidence of childbirth and the growing emphasis on advanced maternal and fetal health monitoring. Technological advancements, leading to more accurate, non-invasive, and user-friendly devices, are significantly boosting adoption rates. Government initiatives aimed at reducing maternal and infant mortality, coupled with rising healthcare expenditure in emerging economies, further fuel market growth. The increasing demand for home healthcare solutions and the convenience of remote monitoring are also significant growth catalysts.
However, the market faces certain barriers and challenges. Stringent regulatory approvals for medical devices, requiring extensive clinical trials and adherence to complex standards, can hinder market entry and prolong product launch timelines, costing up to 5 billion USD in R&D. The high cost of advanced monitoring systems can be a restraint, especially in resource-limited settings, impacting market penetration in developing regions. Supply chain disruptions, as seen in recent global events, can affect the availability of critical components and increase manufacturing costs, potentially impacting pricing. Furthermore, the need for specialized training for healthcare professionals to effectively utilize and interpret data from these advanced devices presents an ongoing challenge.
Growth Drivers in the Uterine Contraction Monitors Market
The growth drivers in the Uterine Contraction Monitors market are multifaceted, encompassing technological, economic, and policy-driven factors. Technologically, innovations in sensor accuracy, miniaturization, and wireless connectivity are making devices more precise, portable, and convenient for both healthcare providers and patients. Economically, increasing healthcare investments globally, particularly in obstetrics and gynecology, and rising disposable incomes in developing regions are expanding the market's reach. Policy-driven initiatives, such as government programs aimed at improving maternal and infant health outcomes and reducing mortality rates, are creating a strong demand for advanced monitoring solutions. The growing trend towards telehealth and remote patient monitoring further stimulates the market by enabling continuous oversight outside traditional clinical settings, contributing to an estimated 15% year-on-year growth in remote monitoring solutions.
Challenges Impacting Uterine Contraction Monitors Growth
Challenges impacting Uterine Contraction Monitors growth include the rigorous and time-consuming regulatory approval processes, which can delay market entry and add significant costs, estimated at an average of 3 billion USD per major regulatory filing. Supply chain vulnerabilities, including the availability of essential electronic components and manufacturing capacities, pose a persistent risk, potentially leading to production delays and increased costs, impacting an estimated 10% of global production. Competitive pressures from both established giants and agile new entrants drive innovation but also exert downward pressure on profit margins, particularly in commoditized segments. Furthermore, the need for ongoing training and education for healthcare professionals to effectively utilize increasingly sophisticated devices presents an operational challenge, requiring continuous investment in human capital development.
Key Players Shaping the Uterine Contraction Monitors Market
- Cardinal
- Progetti
- EDAN Diagnostics
- Bionet
- Promed Group
- Koninklijke Philips
- GE Healthcare
- Siemens Healthineers
Significant Uterine Contraction Monitors Industry Milestones
- 2019: Introduction of AI-powered predictive analytics for labor progression by GE Healthcare, enhancing clinical decision-making.
- 2020: Launch of a new generation of wireless external uterine contraction monitors by Progetti, focusing on enhanced patient comfort and data accuracy.
- 2021: EDAN Diagnostics receives FDA clearance for its advanced fetal and maternal monitoring system, expanding its U.S. market presence.
- 2022: Bionet introduces a portable, all-in-one fetal and maternal monitor designed for home care settings.
- 2023: Koninklijke Philips announces strategic partnerships to integrate its monitoring solutions with leading EHR systems, improving data interoperability.
- 2024: Siemens Healthineers unveils a new generation of ultrasound technology with enhanced real-time imaging for fetal monitoring.
Future Outlook for Uterine Contraction Monitors Market
The future outlook for the Uterine Contraction Monitors market is exceptionally bright, driven by sustained technological innovation and an unwavering global focus on improving maternal and infant health outcomes. The anticipated growth is fueled by the increasing adoption of AI and machine learning for predictive diagnostics, offering earlier detection of potential risks and personalized care plans. The expansion of telehealth and remote patient monitoring solutions will democratize access to advanced care, particularly in underserved regions. Strategic opportunities lie in the development of more integrated, multi-parameter monitoring devices that offer a comprehensive view of maternal-fetal well-being, and in catering to the growing demand for user-friendly, cost-effective solutions for home care settings. The market is poised to witness continued investment in R&D, strategic collaborations, and geographical expansion, ensuring robust growth and significant contributions to global healthcare in the coming decade.
Uterine Contraction Monitors Segmentation
-
1. Application
- 1.1. Hospitals
- 1.2. Obstetrics & Gynecology Clinics
- 1.3. Home Care Settings
-
2. Type
- 2.1. Internal Uterine Contraction Monitors
- 2.2. External Uterine Contraction Monitors
Uterine Contraction Monitors Segmentation By Geography
-
1. North America
- 1.1. United States
- 1.2. Canada
- 1.3. Mexico
-
2. South America
- 2.1. Brazil
- 2.2. Argentina
- 2.3. Rest of South America
-
3. Europe
- 3.1. United Kingdom
- 3.2. Germany
- 3.3. France
- 3.4. Italy
- 3.5. Spain
- 3.6. Russia
- 3.7. Benelux
- 3.8. Nordics
- 3.9. Rest of Europe
-
4. Middle East & Africa
- 4.1. Turkey
- 4.2. Israel
- 4.3. GCC
- 4.4. North Africa
- 4.5. South Africa
- 4.6. Rest of Middle East & Africa
-
5. Asia Pacific
- 5.1. China
- 5.2. India
- 5.3. Japan
- 5.4. South Korea
- 5.5. ASEAN
- 5.6. Oceania
- 5.7. Rest of Asia Pacific
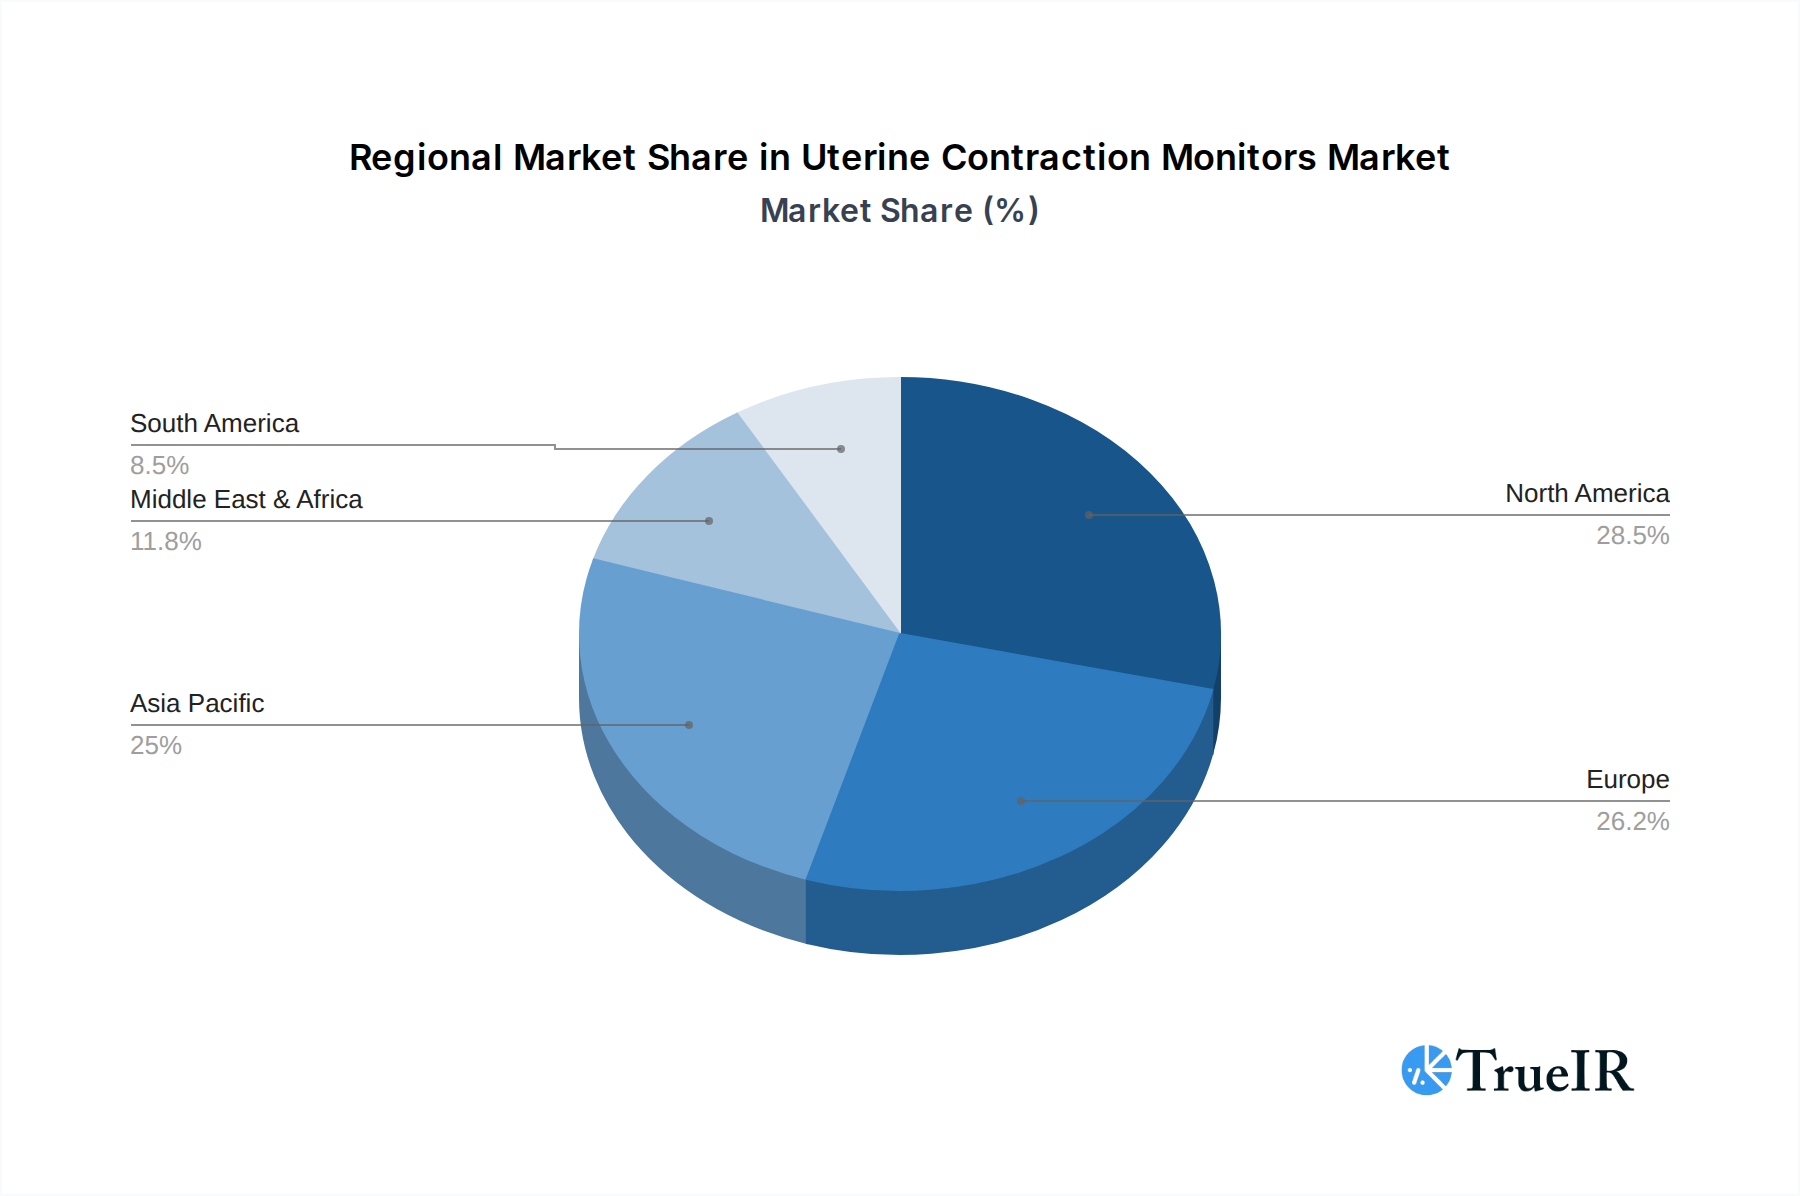
Uterine Contraction Monitors Regional Market Share
Geographic Coverage of Uterine Contraction Monitors
Uterine Contraction Monitors REPORT HIGHLIGHTS
| Aspects | Details |
|---|---|
| Study Period | 2020-2034 |
| Base Year | 2025 |
| Estimated Year | 2026 |
| Forecast Period | 2026-2034 |
| Historical Period | 2020-2025 |
| Growth Rate | CAGR of 6.84% from 2020-2034 |
| Segmentation |
|
Table of Contents
- 1. Introduction
- 1.1. Research Scope
- 1.2. Market Segmentation
- 1.3. Research Methodology
- 1.4. Definitions and Assumptions
- 2. Executive Summary
- 2.1. Introduction
- 3. Market Dynamics
- 3.1. Introduction
- 3.2. Market Drivers
- 3.3. Market Restrains
- 3.4. Market Trends
- 4. Market Factor Analysis
- 4.1. Porters Five Forces
- 4.2. Supply/Value Chain
- 4.3. PESTEL analysis
- 4.4. Market Entropy
- 4.5. Patent/Trademark Analysis
- 5. Global Uterine Contraction Monitors Analysis, Insights and Forecast, 2020-2032
- 5.1. Market Analysis, Insights and Forecast - by Application
- 5.1.1. Hospitals
- 5.1.2. Obstetrics & Gynecology Clinics
- 5.1.3. Home Care Settings
- 5.2. Market Analysis, Insights and Forecast - by Type
- 5.2.1. Internal Uterine Contraction Monitors
- 5.2.2. External Uterine Contraction Monitors
- 5.3. Market Analysis, Insights and Forecast - by Region
- 5.3.1. North America
- 5.3.2. South America
- 5.3.3. Europe
- 5.3.4. Middle East & Africa
- 5.3.5. Asia Pacific
- 5.1. Market Analysis, Insights and Forecast - by Application
- 6. North America Uterine Contraction Monitors Analysis, Insights and Forecast, 2020-2032
- 6.1. Market Analysis, Insights and Forecast - by Application
- 6.1.1. Hospitals
- 6.1.2. Obstetrics & Gynecology Clinics
- 6.1.3. Home Care Settings
- 6.2. Market Analysis, Insights and Forecast - by Type
- 6.2.1. Internal Uterine Contraction Monitors
- 6.2.2. External Uterine Contraction Monitors
- 6.1. Market Analysis, Insights and Forecast - by Application
- 7. South America Uterine Contraction Monitors Analysis, Insights and Forecast, 2020-2032
- 7.1. Market Analysis, Insights and Forecast - by Application
- 7.1.1. Hospitals
- 7.1.2. Obstetrics & Gynecology Clinics
- 7.1.3. Home Care Settings
- 7.2. Market Analysis, Insights and Forecast - by Type
- 7.2.1. Internal Uterine Contraction Monitors
- 7.2.2. External Uterine Contraction Monitors
- 7.1. Market Analysis, Insights and Forecast - by Application
- 8. Europe Uterine Contraction Monitors Analysis, Insights and Forecast, 2020-2032
- 8.1. Market Analysis, Insights and Forecast - by Application
- 8.1.1. Hospitals
- 8.1.2. Obstetrics & Gynecology Clinics
- 8.1.3. Home Care Settings
- 8.2. Market Analysis, Insights and Forecast - by Type
- 8.2.1. Internal Uterine Contraction Monitors
- 8.2.2. External Uterine Contraction Monitors
- 8.1. Market Analysis, Insights and Forecast - by Application
- 9. Middle East & Africa Uterine Contraction Monitors Analysis, Insights and Forecast, 2020-2032
- 9.1. Market Analysis, Insights and Forecast - by Application
- 9.1.1. Hospitals
- 9.1.2. Obstetrics & Gynecology Clinics
- 9.1.3. Home Care Settings
- 9.2. Market Analysis, Insights and Forecast - by Type
- 9.2.1. Internal Uterine Contraction Monitors
- 9.2.2. External Uterine Contraction Monitors
- 9.1. Market Analysis, Insights and Forecast - by Application
- 10. Asia Pacific Uterine Contraction Monitors Analysis, Insights and Forecast, 2020-2032
- 10.1. Market Analysis, Insights and Forecast - by Application
- 10.1.1. Hospitals
- 10.1.2. Obstetrics & Gynecology Clinics
- 10.1.3. Home Care Settings
- 10.2. Market Analysis, Insights and Forecast - by Type
- 10.2.1. Internal Uterine Contraction Monitors
- 10.2.2. External Uterine Contraction Monitors
- 10.1. Market Analysis, Insights and Forecast - by Application
- 11. Competitive Analysis
- 11.1. Global Market Share Analysis 2025
- 11.2. Company Profiles
- 11.2.1 Cardinal
- 11.2.1.1. Overview
- 11.2.1.2. Products
- 11.2.1.3. SWOT Analysis
- 11.2.1.4. Recent Developments
- 11.2.1.5. Financials (Based on Availability)
- 11.2.2 Progetti
- 11.2.2.1. Overview
- 11.2.2.2. Products
- 11.2.2.3. SWOT Analysis
- 11.2.2.4. Recent Developments
- 11.2.2.5. Financials (Based on Availability)
- 11.2.3 EDAN Diagnostics
- 11.2.3.1. Overview
- 11.2.3.2. Products
- 11.2.3.3. SWOT Analysis
- 11.2.3.4. Recent Developments
- 11.2.3.5. Financials (Based on Availability)
- 11.2.4 Bionet
- 11.2.4.1. Overview
- 11.2.4.2. Products
- 11.2.4.3. SWOT Analysis
- 11.2.4.4. Recent Developments
- 11.2.4.5. Financials (Based on Availability)
- 11.2.5 Promed Group
- 11.2.5.1. Overview
- 11.2.5.2. Products
- 11.2.5.3. SWOT Analysis
- 11.2.5.4. Recent Developments
- 11.2.5.5. Financials (Based on Availability)
- 11.2.6 Koninklijke Philips
- 11.2.6.1. Overview
- 11.2.6.2. Products
- 11.2.6.3. SWOT Analysis
- 11.2.6.4. Recent Developments
- 11.2.6.5. Financials (Based on Availability)
- 11.2.7 GE Healthcare
- 11.2.7.1. Overview
- 11.2.7.2. Products
- 11.2.7.3. SWOT Analysis
- 11.2.7.4. Recent Developments
- 11.2.7.5. Financials (Based on Availability)
- 11.2.8 Siemens Healthineers
- 11.2.8.1. Overview
- 11.2.8.2. Products
- 11.2.8.3. SWOT Analysis
- 11.2.8.4. Recent Developments
- 11.2.8.5. Financials (Based on Availability)
- 11.2.1 Cardinal
List of Figures
- Figure 1: Global Uterine Contraction Monitors Revenue Breakdown (undefined, %) by Region 2025 & 2033
- Figure 2: Global Uterine Contraction Monitors Volume Breakdown (K, %) by Region 2025 & 2033
- Figure 3: North America Uterine Contraction Monitors Revenue (undefined), by Application 2025 & 2033
- Figure 4: North America Uterine Contraction Monitors Volume (K), by Application 2025 & 2033
- Figure 5: North America Uterine Contraction Monitors Revenue Share (%), by Application 2025 & 2033
- Figure 6: North America Uterine Contraction Monitors Volume Share (%), by Application 2025 & 2033
- Figure 7: North America Uterine Contraction Monitors Revenue (undefined), by Type 2025 & 2033
- Figure 8: North America Uterine Contraction Monitors Volume (K), by Type 2025 & 2033
- Figure 9: North America Uterine Contraction Monitors Revenue Share (%), by Type 2025 & 2033
- Figure 10: North America Uterine Contraction Monitors Volume Share (%), by Type 2025 & 2033
- Figure 11: North America Uterine Contraction Monitors Revenue (undefined), by Country 2025 & 2033
- Figure 12: North America Uterine Contraction Monitors Volume (K), by Country 2025 & 2033
- Figure 13: North America Uterine Contraction Monitors Revenue Share (%), by Country 2025 & 2033
- Figure 14: North America Uterine Contraction Monitors Volume Share (%), by Country 2025 & 2033
- Figure 15: South America Uterine Contraction Monitors Revenue (undefined), by Application 2025 & 2033
- Figure 16: South America Uterine Contraction Monitors Volume (K), by Application 2025 & 2033
- Figure 17: South America Uterine Contraction Monitors Revenue Share (%), by Application 2025 & 2033
- Figure 18: South America Uterine Contraction Monitors Volume Share (%), by Application 2025 & 2033
- Figure 19: South America Uterine Contraction Monitors Revenue (undefined), by Type 2025 & 2033
- Figure 20: South America Uterine Contraction Monitors Volume (K), by Type 2025 & 2033
- Figure 21: South America Uterine Contraction Monitors Revenue Share (%), by Type 2025 & 2033
- Figure 22: South America Uterine Contraction Monitors Volume Share (%), by Type 2025 & 2033
- Figure 23: South America Uterine Contraction Monitors Revenue (undefined), by Country 2025 & 2033
- Figure 24: South America Uterine Contraction Monitors Volume (K), by Country 2025 & 2033
- Figure 25: South America Uterine Contraction Monitors Revenue Share (%), by Country 2025 & 2033
- Figure 26: South America Uterine Contraction Monitors Volume Share (%), by Country 2025 & 2033
- Figure 27: Europe Uterine Contraction Monitors Revenue (undefined), by Application 2025 & 2033
- Figure 28: Europe Uterine Contraction Monitors Volume (K), by Application 2025 & 2033
- Figure 29: Europe Uterine Contraction Monitors Revenue Share (%), by Application 2025 & 2033
- Figure 30: Europe Uterine Contraction Monitors Volume Share (%), by Application 2025 & 2033
- Figure 31: Europe Uterine Contraction Monitors Revenue (undefined), by Type 2025 & 2033
- Figure 32: Europe Uterine Contraction Monitors Volume (K), by Type 2025 & 2033
- Figure 33: Europe Uterine Contraction Monitors Revenue Share (%), by Type 2025 & 2033
- Figure 34: Europe Uterine Contraction Monitors Volume Share (%), by Type 2025 & 2033
- Figure 35: Europe Uterine Contraction Monitors Revenue (undefined), by Country 2025 & 2033
- Figure 36: Europe Uterine Contraction Monitors Volume (K), by Country 2025 & 2033
- Figure 37: Europe Uterine Contraction Monitors Revenue Share (%), by Country 2025 & 2033
- Figure 38: Europe Uterine Contraction Monitors Volume Share (%), by Country 2025 & 2033
- Figure 39: Middle East & Africa Uterine Contraction Monitors Revenue (undefined), by Application 2025 & 2033
- Figure 40: Middle East & Africa Uterine Contraction Monitors Volume (K), by Application 2025 & 2033
- Figure 41: Middle East & Africa Uterine Contraction Monitors Revenue Share (%), by Application 2025 & 2033
- Figure 42: Middle East & Africa Uterine Contraction Monitors Volume Share (%), by Application 2025 & 2033
- Figure 43: Middle East & Africa Uterine Contraction Monitors Revenue (undefined), by Type 2025 & 2033
- Figure 44: Middle East & Africa Uterine Contraction Monitors Volume (K), by Type 2025 & 2033
- Figure 45: Middle East & Africa Uterine Contraction Monitors Revenue Share (%), by Type 2025 & 2033
- Figure 46: Middle East & Africa Uterine Contraction Monitors Volume Share (%), by Type 2025 & 2033
- Figure 47: Middle East & Africa Uterine Contraction Monitors Revenue (undefined), by Country 2025 & 2033
- Figure 48: Middle East & Africa Uterine Contraction Monitors Volume (K), by Country 2025 & 2033
- Figure 49: Middle East & Africa Uterine Contraction Monitors Revenue Share (%), by Country 2025 & 2033
- Figure 50: Middle East & Africa Uterine Contraction Monitors Volume Share (%), by Country 2025 & 2033
- Figure 51: Asia Pacific Uterine Contraction Monitors Revenue (undefined), by Application 2025 & 2033
- Figure 52: Asia Pacific Uterine Contraction Monitors Volume (K), by Application 2025 & 2033
- Figure 53: Asia Pacific Uterine Contraction Monitors Revenue Share (%), by Application 2025 & 2033
- Figure 54: Asia Pacific Uterine Contraction Monitors Volume Share (%), by Application 2025 & 2033
- Figure 55: Asia Pacific Uterine Contraction Monitors Revenue (undefined), by Type 2025 & 2033
- Figure 56: Asia Pacific Uterine Contraction Monitors Volume (K), by Type 2025 & 2033
- Figure 57: Asia Pacific Uterine Contraction Monitors Revenue Share (%), by Type 2025 & 2033
- Figure 58: Asia Pacific Uterine Contraction Monitors Volume Share (%), by Type 2025 & 2033
- Figure 59: Asia Pacific Uterine Contraction Monitors Revenue (undefined), by Country 2025 & 2033
- Figure 60: Asia Pacific Uterine Contraction Monitors Volume (K), by Country 2025 & 2033
- Figure 61: Asia Pacific Uterine Contraction Monitors Revenue Share (%), by Country 2025 & 2033
- Figure 62: Asia Pacific Uterine Contraction Monitors Volume Share (%), by Country 2025 & 2033
List of Tables
- Table 1: Global Uterine Contraction Monitors Revenue undefined Forecast, by Application 2020 & 2033
- Table 2: Global Uterine Contraction Monitors Volume K Forecast, by Application 2020 & 2033
- Table 3: Global Uterine Contraction Monitors Revenue undefined Forecast, by Type 2020 & 2033
- Table 4: Global Uterine Contraction Monitors Volume K Forecast, by Type 2020 & 2033
- Table 5: Global Uterine Contraction Monitors Revenue undefined Forecast, by Region 2020 & 2033
- Table 6: Global Uterine Contraction Monitors Volume K Forecast, by Region 2020 & 2033
- Table 7: Global Uterine Contraction Monitors Revenue undefined Forecast, by Application 2020 & 2033
- Table 8: Global Uterine Contraction Monitors Volume K Forecast, by Application 2020 & 2033
- Table 9: Global Uterine Contraction Monitors Revenue undefined Forecast, by Type 2020 & 2033
- Table 10: Global Uterine Contraction Monitors Volume K Forecast, by Type 2020 & 2033
- Table 11: Global Uterine Contraction Monitors Revenue undefined Forecast, by Country 2020 & 2033
- Table 12: Global Uterine Contraction Monitors Volume K Forecast, by Country 2020 & 2033
- Table 13: United States Uterine Contraction Monitors Revenue (undefined) Forecast, by Application 2020 & 2033
- Table 14: United States Uterine Contraction Monitors Volume (K) Forecast, by Application 2020 & 2033
- Table 15: Canada Uterine Contraction Monitors Revenue (undefined) Forecast, by Application 2020 & 2033
- Table 16: Canada Uterine Contraction Monitors Volume (K) Forecast, by Application 2020 & 2033
- Table 17: Mexico Uterine Contraction Monitors Revenue (undefined) Forecast, by Application 2020 & 2033
- Table 18: Mexico Uterine Contraction Monitors Volume (K) Forecast, by Application 2020 & 2033
- Table 19: Global Uterine Contraction Monitors Revenue undefined Forecast, by Application 2020 & 2033
- Table 20: Global Uterine Contraction Monitors Volume K Forecast, by Application 2020 & 2033
- Table 21: Global Uterine Contraction Monitors Revenue undefined Forecast, by Type 2020 & 2033
- Table 22: Global Uterine Contraction Monitors Volume K Forecast, by Type 2020 & 2033
- Table 23: Global Uterine Contraction Monitors Revenue undefined Forecast, by Country 2020 & 2033
- Table 24: Global Uterine Contraction Monitors Volume K Forecast, by Country 2020 & 2033
- Table 25: Brazil Uterine Contraction Monitors Revenue (undefined) Forecast, by Application 2020 & 2033
- Table 26: Brazil Uterine Contraction Monitors Volume (K) Forecast, by Application 2020 & 2033
- Table 27: Argentina Uterine Contraction Monitors Revenue (undefined) Forecast, by Application 2020 & 2033
- Table 28: Argentina Uterine Contraction Monitors Volume (K) Forecast, by Application 2020 & 2033
- Table 29: Rest of South America Uterine Contraction Monitors Revenue (undefined) Forecast, by Application 2020 & 2033
- Table 30: Rest of South America Uterine Contraction Monitors Volume (K) Forecast, by Application 2020 & 2033
- Table 31: Global Uterine Contraction Monitors Revenue undefined Forecast, by Application 2020 & 2033
- Table 32: Global Uterine Contraction Monitors Volume K Forecast, by Application 2020 & 2033
- Table 33: Global Uterine Contraction Monitors Revenue undefined Forecast, by Type 2020 & 2033
- Table 34: Global Uterine Contraction Monitors Volume K Forecast, by Type 2020 & 2033
- Table 35: Global Uterine Contraction Monitors Revenue undefined Forecast, by Country 2020 & 2033
- Table 36: Global Uterine Contraction Monitors Volume K Forecast, by Country 2020 & 2033
- Table 37: United Kingdom Uterine Contraction Monitors Revenue (undefined) Forecast, by Application 2020 & 2033
- Table 38: United Kingdom Uterine Contraction Monitors Volume (K) Forecast, by Application 2020 & 2033
- Table 39: Germany Uterine Contraction Monitors Revenue (undefined) Forecast, by Application 2020 & 2033
- Table 40: Germany Uterine Contraction Monitors Volume (K) Forecast, by Application 2020 & 2033
- Table 41: France Uterine Contraction Monitors Revenue (undefined) Forecast, by Application 2020 & 2033
- Table 42: France Uterine Contraction Monitors Volume (K) Forecast, by Application 2020 & 2033
- Table 43: Italy Uterine Contraction Monitors Revenue (undefined) Forecast, by Application 2020 & 2033
- Table 44: Italy Uterine Contraction Monitors Volume (K) Forecast, by Application 2020 & 2033
- Table 45: Spain Uterine Contraction Monitors Revenue (undefined) Forecast, by Application 2020 & 2033
- Table 46: Spain Uterine Contraction Monitors Volume (K) Forecast, by Application 2020 & 2033
- Table 47: Russia Uterine Contraction Monitors Revenue (undefined) Forecast, by Application 2020 & 2033
- Table 48: Russia Uterine Contraction Monitors Volume (K) Forecast, by Application 2020 & 2033
- Table 49: Benelux Uterine Contraction Monitors Revenue (undefined) Forecast, by Application 2020 & 2033
- Table 50: Benelux Uterine Contraction Monitors Volume (K) Forecast, by Application 2020 & 2033
- Table 51: Nordics Uterine Contraction Monitors Revenue (undefined) Forecast, by Application 2020 & 2033
- Table 52: Nordics Uterine Contraction Monitors Volume (K) Forecast, by Application 2020 & 2033
- Table 53: Rest of Europe Uterine Contraction Monitors Revenue (undefined) Forecast, by Application 2020 & 2033
- Table 54: Rest of Europe Uterine Contraction Monitors Volume (K) Forecast, by Application 2020 & 2033
- Table 55: Global Uterine Contraction Monitors Revenue undefined Forecast, by Application 2020 & 2033
- Table 56: Global Uterine Contraction Monitors Volume K Forecast, by Application 2020 & 2033
- Table 57: Global Uterine Contraction Monitors Revenue undefined Forecast, by Type 2020 & 2033
- Table 58: Global Uterine Contraction Monitors Volume K Forecast, by Type 2020 & 2033
- Table 59: Global Uterine Contraction Monitors Revenue undefined Forecast, by Country 2020 & 2033
- Table 60: Global Uterine Contraction Monitors Volume K Forecast, by Country 2020 & 2033
- Table 61: Turkey Uterine Contraction Monitors Revenue (undefined) Forecast, by Application 2020 & 2033
- Table 62: Turkey Uterine Contraction Monitors Volume (K) Forecast, by Application 2020 & 2033
- Table 63: Israel Uterine Contraction Monitors Revenue (undefined) Forecast, by Application 2020 & 2033
- Table 64: Israel Uterine Contraction Monitors Volume (K) Forecast, by Application 2020 & 2033
- Table 65: GCC Uterine Contraction Monitors Revenue (undefined) Forecast, by Application 2020 & 2033
- Table 66: GCC Uterine Contraction Monitors Volume (K) Forecast, by Application 2020 & 2033
- Table 67: North Africa Uterine Contraction Monitors Revenue (undefined) Forecast, by Application 2020 & 2033
- Table 68: North Africa Uterine Contraction Monitors Volume (K) Forecast, by Application 2020 & 2033
- Table 69: South Africa Uterine Contraction Monitors Revenue (undefined) Forecast, by Application 2020 & 2033
- Table 70: South Africa Uterine Contraction Monitors Volume (K) Forecast, by Application 2020 & 2033
- Table 71: Rest of Middle East & Africa Uterine Contraction Monitors Revenue (undefined) Forecast, by Application 2020 & 2033
- Table 72: Rest of Middle East & Africa Uterine Contraction Monitors Volume (K) Forecast, by Application 2020 & 2033
- Table 73: Global Uterine Contraction Monitors Revenue undefined Forecast, by Application 2020 & 2033
- Table 74: Global Uterine Contraction Monitors Volume K Forecast, by Application 2020 & 2033
- Table 75: Global Uterine Contraction Monitors Revenue undefined Forecast, by Type 2020 & 2033
- Table 76: Global Uterine Contraction Monitors Volume K Forecast, by Type 2020 & 2033
- Table 77: Global Uterine Contraction Monitors Revenue undefined Forecast, by Country 2020 & 2033
- Table 78: Global Uterine Contraction Monitors Volume K Forecast, by Country 2020 & 2033
- Table 79: China Uterine Contraction Monitors Revenue (undefined) Forecast, by Application 2020 & 2033
- Table 80: China Uterine Contraction Monitors Volume (K) Forecast, by Application 2020 & 2033
- Table 81: India Uterine Contraction Monitors Revenue (undefined) Forecast, by Application 2020 & 2033
- Table 82: India Uterine Contraction Monitors Volume (K) Forecast, by Application 2020 & 2033
- Table 83: Japan Uterine Contraction Monitors Revenue (undefined) Forecast, by Application 2020 & 2033
- Table 84: Japan Uterine Contraction Monitors Volume (K) Forecast, by Application 2020 & 2033
- Table 85: South Korea Uterine Contraction Monitors Revenue (undefined) Forecast, by Application 2020 & 2033
- Table 86: South Korea Uterine Contraction Monitors Volume (K) Forecast, by Application 2020 & 2033
- Table 87: ASEAN Uterine Contraction Monitors Revenue (undefined) Forecast, by Application 2020 & 2033
- Table 88: ASEAN Uterine Contraction Monitors Volume (K) Forecast, by Application 2020 & 2033
- Table 89: Oceania Uterine Contraction Monitors Revenue (undefined) Forecast, by Application 2020 & 2033
- Table 90: Oceania Uterine Contraction Monitors Volume (K) Forecast, by Application 2020 & 2033
- Table 91: Rest of Asia Pacific Uterine Contraction Monitors Revenue (undefined) Forecast, by Application 2020 & 2033
- Table 92: Rest of Asia Pacific Uterine Contraction Monitors Volume (K) Forecast, by Application 2020 & 2033
Frequently Asked Questions
1. What is the projected Compound Annual Growth Rate (CAGR) of the Uterine Contraction Monitors?
The projected CAGR is approximately 6.84%.
2. Which companies are prominent players in the Uterine Contraction Monitors?
Key companies in the market include Cardinal, Progetti, EDAN Diagnostics, Bionet, Promed Group, Koninklijke Philips, GE Healthcare, Siemens Healthineers.
3. What are the main segments of the Uterine Contraction Monitors?
The market segments include Application, Type.
4. Can you provide details about the market size?
The market size is estimated to be USD XXX N/A as of 2022.
5. What are some drivers contributing to market growth?
N/A
6. What are the notable trends driving market growth?
N/A
7. Are there any restraints impacting market growth?
N/A
8. Can you provide examples of recent developments in the market?
N/A
9. What pricing options are available for accessing the report?
Pricing options include single-user, multi-user, and enterprise licenses priced at USD 3950.00, USD 5925.00, and USD 7900.00 respectively.
10. Is the market size provided in terms of value or volume?
The market size is provided in terms of value, measured in N/A and volume, measured in K.
11. Are there any specific market keywords associated with the report?
Yes, the market keyword associated with the report is "Uterine Contraction Monitors," which aids in identifying and referencing the specific market segment covered.
12. How do I determine which pricing option suits my needs best?
The pricing options vary based on user requirements and access needs. Individual users may opt for single-user licenses, while businesses requiring broader access may choose multi-user or enterprise licenses for cost-effective access to the report.
13. Are there any additional resources or data provided in the Uterine Contraction Monitors report?
While the report offers comprehensive insights, it's advisable to review the specific contents or supplementary materials provided to ascertain if additional resources or data are available.
14. How can I stay updated on further developments or reports in the Uterine Contraction Monitors?
To stay informed about further developments, trends, and reports in the Uterine Contraction Monitors, consider subscribing to industry newsletters, following relevant companies and organizations, or regularly checking reputable industry news sources and publications.
Methodology
Step 1 - Identification of Relevant Samples Size from Population Database


Step 2 - Approaches for Defining Global Market Size (Value, Volume* & Price*)

Note*: In applicable scenarios
Step 3 - Data Sources
Primary Research
- Web Analytics
- Survey Reports
- Research Institute
- Latest Research Reports
- Opinion Leaders
Secondary Research
- Annual Reports
- White Paper
- Latest Press Release
- Industry Association
- Paid Database
- Investor Presentations

Step 4 - Data Triangulation
Involves using different sources of information in order to increase the validity of a study
These sources are likely to be stakeholders in a program - participants, other researchers, program staff, other community members, and so on.
Then we put all data in single framework & apply various statistical tools to find out the dynamic on the market.
During the analysis stage, feedback from the stakeholder groups would be compared to determine areas of agreement as well as areas of divergence