

Key Insights
The global Visual Inspection Service market is poised for significant expansion, projected to reach an estimated $15.8 billion in 2025. This robust growth trajectory is fueled by an impressive CAGR of 12%, indicating sustained demand across diverse industrial sectors. A primary driver for this upward trend is the increasing emphasis on quality assurance and regulatory compliance. Industries are increasingly investing in sophisticated visual inspection techniques to detect defects, ensure product integrity, and prevent costly failures. The rising complexity of manufactured goods, coupled with stringent quality standards in sectors like pharmaceuticals and electronics, necessitates advanced visual inspection solutions. Furthermore, the growing adoption of automation and AI-powered visual inspection systems is enhancing efficiency, accuracy, and cost-effectiveness, making these services indispensable for businesses seeking to maintain a competitive edge.
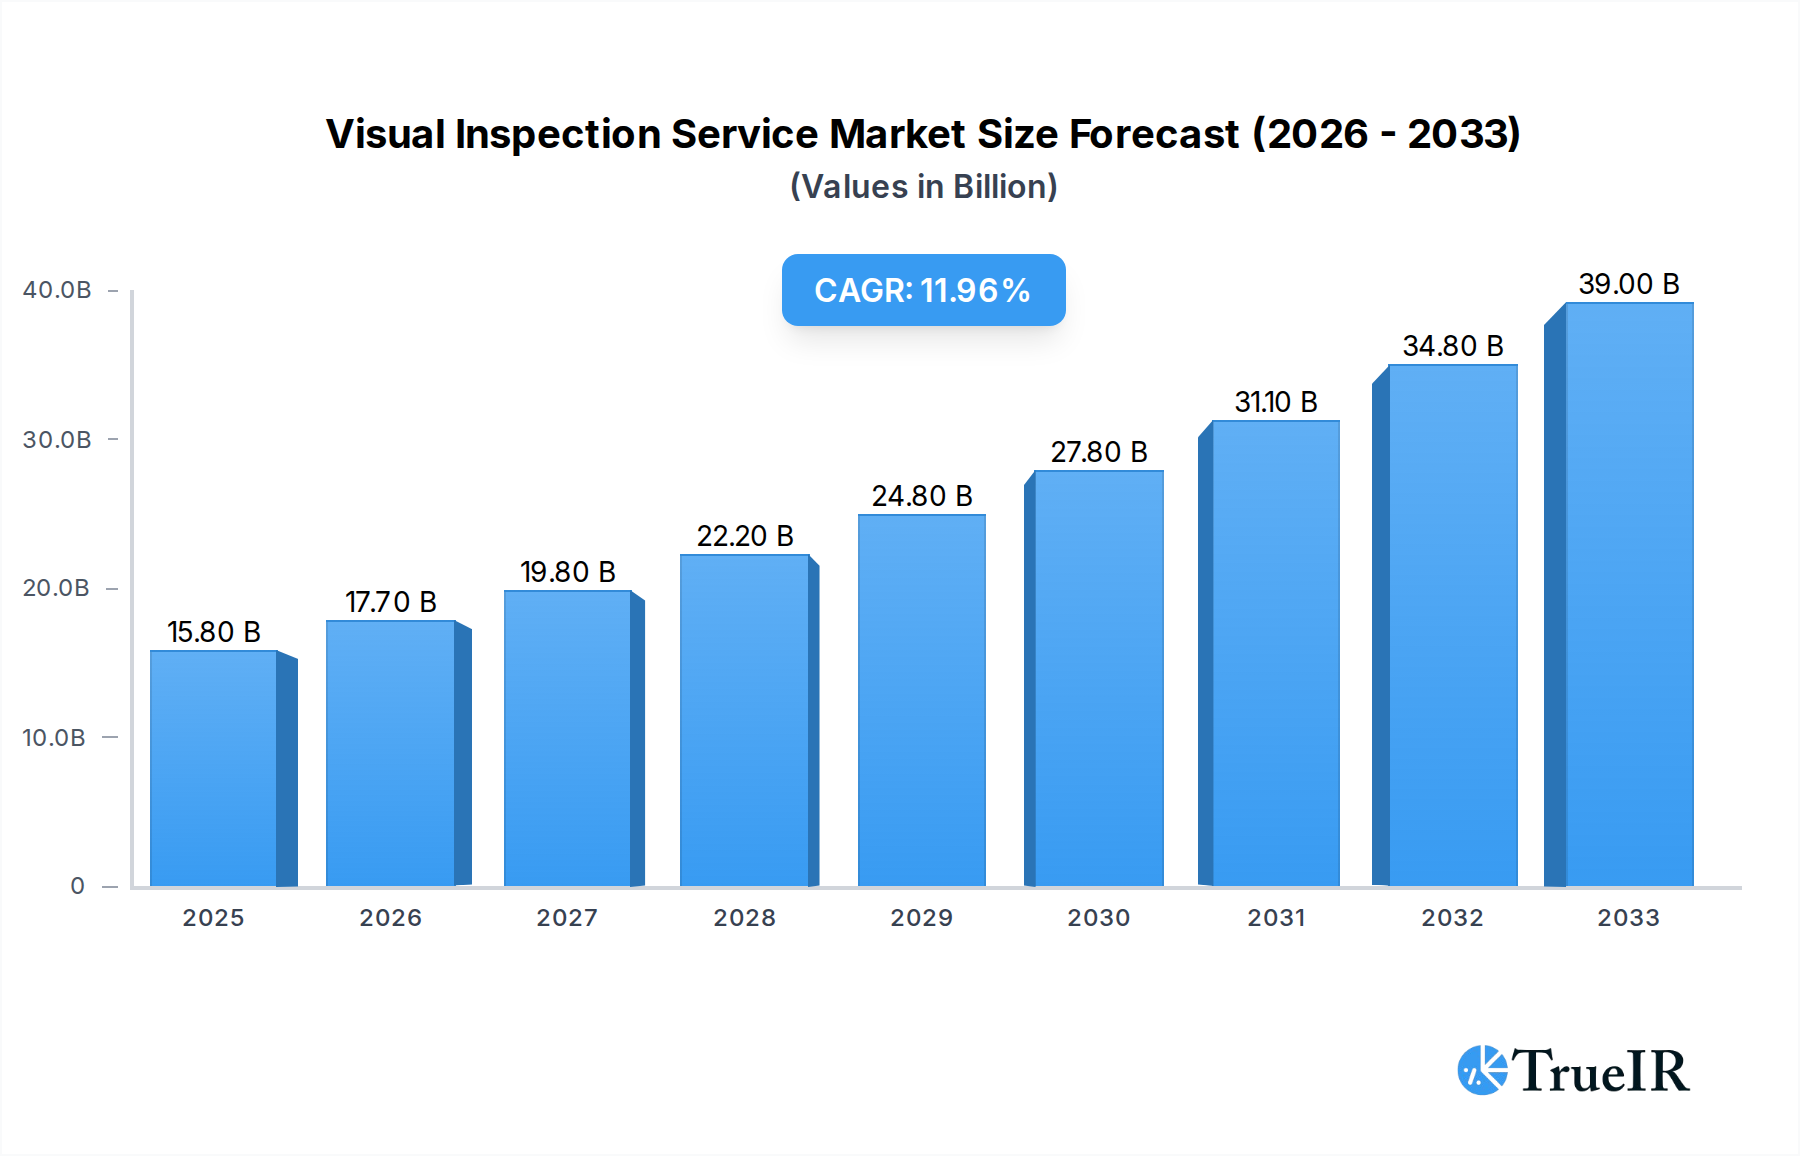
Visual Inspection Service Market Size (In Billion)
The market segmentation reveals a strong reliance on Onsite Visual Inspection, though Remote Visual Inspection is gaining considerable traction due to advancements in drone technology, robotics, and augmented reality. These remote capabilities are particularly beneficial for inspecting hazardous environments, hard-to-reach areas, and large-scale infrastructure, thereby reducing downtime and operational risks. Key application areas such as manufacturing, pharmaceuticals, and food and beverage are primary contributors to market revenue, driven by their inherent need for meticulous quality control. The automotive and electronics sectors are also significant adopters, reflecting the intricate components and high performance expected from their products. Geographically, the Asia Pacific region is expected to exhibit the fastest growth, propelled by rapid industrialization and a burgeoning manufacturing base, while North America and Europe remain dominant markets due to their established industrial infrastructure and high adoption rates of advanced technologies.

Visual Inspection Service Company Market Share
Visual Inspection Service Market Structure & Competitive Landscape
The Visual Inspection Service market exhibits a moderately fragmented structure, with a mix of large, established global players and numerous smaller, regional service providers. Key industry participants like TWI Global, MISTRAS, Element Materials Technology, SGS, and Applus+ command significant market share, driven by their extensive service portfolios, global reach, and strong client relationships across diverse industries. Innovation remains a critical differentiator, with companies investing heavily in advanced inspection technologies such as AI-powered analytics, robotic inspections, and enhanced imaging solutions to improve efficiency, accuracy, and data-driven insights. Regulatory compliance, particularly in sectors like Pharmaceutical and Food and Beverage, acts as a substantial barrier to entry and influences service provider capabilities, demanding adherence to stringent quality and safety standards. Product substitutes, while limited in direct replacement for nuanced visual assessment, can include automated systems and simpler manual checks, especially for high-volume, low-complexity tasks. The Manufacturing, Automotive, and Construction segments represent the largest end-user bases, driving demand for both onsite and remote visual inspection services. Mergers and acquisitions (M&A) are an ongoing trend, with larger entities acquiring specialized firms to expand their technological capabilities, geographical presence, and service offerings. For instance, recent M&A activities indicate a trend towards consolidation, with approximately 50 billion in M&A value observed over the historical period. The concentration ratio among the top five players is estimated to be around 60%, reflecting the dominance of major service providers.
Visual Inspection Service Market Trends & Opportunities
The global Visual Inspection Service market is poised for substantial expansion, projected to reach an impressive 120 billion by the end of the forecast period in 2033. This growth is underpinned by a robust Compound Annual Growth Rate (CAGR) of 8.5% during the study period of 2019–2033, with the base and estimated year of 2025 already reflecting a market size of 80 billion. Technological advancements are at the forefront of this market's evolution. The integration of Artificial Intelligence (AI) and Machine Learning (ML) is revolutionizing visual inspection by enabling automated defect detection, predictive maintenance, and enhanced data analysis, moving beyond simple visual confirmation to actionable insights. High-resolution cameras, drones, and robotic systems are expanding the reach and capabilities of Remote Visual Inspection (RVI), allowing for safer and more efficient inspections in hazardous or difficult-to-access environments. This shift towards RVI is a significant trend, driven by the need for reduced downtime, improved safety, and cost efficiencies. Consumer preferences are increasingly aligning with quality assurance and safety compliance, particularly in highly regulated industries such as Pharmaceutical and Food and Beverage. Stringent government regulations worldwide, mandating rigorous quality control and asset integrity management, further fuel the demand for specialized visual inspection services. The Manufacturing sector, a cornerstone of industrial activity, continues to be a primary driver, with the increasing complexity of manufactured goods necessitating sophisticated inspection protocols to ensure product quality and prevent costly recalls. The Automotive industry is witnessing a surge in demand for advanced visual inspections to ensure the integrity of vehicle components, from the assembly line to final quality checks, especially with the rise of electric and autonomous vehicles requiring even higher levels of precision. The Construction sector benefits from visual inspection services for structural integrity assessments, progress monitoring, and safety compliance, especially with large-scale infrastructure projects underway globally. The Electronics industry relies heavily on microscopic visual inspections to detect defects in circuit boards and components, a critical aspect of ensuring device functionality and longevity. The competitive landscape is characterized by continuous innovation, strategic partnerships, and a growing emphasis on providing comprehensive, integrated inspection solutions that encompass not just visual checks but also data analytics and reporting. Market penetration rates are steadily increasing across all major segments as industries recognize the indispensable role of visual inspection in maintaining operational efficiency, product quality, and safety standards. The ongoing digital transformation across industries is creating significant opportunities for service providers that can leverage data and advanced technologies to offer more value-added services.
Dominant Markets & Segments in Visual Inspection Service
The Manufacturing segment stands as the most dominant force within the Visual Inspection Service market, driven by the sheer volume and complexity of industrial production globally. Its market dominance is further amplified by the inherent need for stringent quality control throughout the manufacturing lifecycle, from raw material assessment to finished product verification. This segment alone accounts for an estimated 40% of the total market revenue.
Key Growth Drivers in Manufacturing:
- Increasing Demand for High-Quality Products: Global consumer expectations for superior product quality and reliability necessitate rigorous visual inspections at every stage.
- Automation and Advanced Manufacturing: The rise of Industry 4.0 and automated production lines requires sophisticated visual inspection systems to monitor and ensure the quality of increasingly complex products.
- Supply Chain Integrity: Ensuring the quality and consistency of components from various suppliers is crucial for manufacturers, leading to sustained demand for inspection services.
- Product Recall Prevention: Minimizing the risk and cost associated with product recalls due to defects is a major incentive for manufacturers to invest in comprehensive visual inspection.
The Automotive and Pharmaceutical segments also represent significant contributors to market growth, with distinct drivers. The automotive industry's reliance on intricate components and the increasing complexity of vehicle technologies, including the burgeoning electric vehicle market, demand meticulous visual inspections for safety and performance. Similarly, the pharmaceutical sector's highly regulated nature, with an unwavering focus on patient safety, mandates stringent adherence to quality standards, driving substantial demand for detailed visual inspections of drug manufacturing processes and products.
In terms of service types, Onsite Visual Inspection remains a critical component, particularly for complex assemblies, critical infrastructure assessments, and immediate problem-solving scenarios. This type of inspection is essential for initial setup, validation, and troubleshooting. However, Remote Visual Inspection (RVI) is experiencing rapid growth, fueled by advancements in drone technology, robotics, and high-definition imaging. RVI offers unparalleled advantages in terms of safety, accessibility to hazardous or confined spaces, and cost-effectiveness for routine inspections. This segment is projected to witness a CAGR of 9.2% during the forecast period.
Key Growth Drivers for RVI:
- Enhanced Safety in Hazardous Environments: RVI eliminates the need for human presence in dangerous locations like high-temperature zones, pressurized vessels, or areas with toxic materials.
- Cost and Time Efficiency: Reduced travel, setup time, and labor requirements contribute to significant cost savings and faster inspection cycles.
- Improved Accessibility: Drones and specialized robotic probes can reach areas previously inaccessible to human inspectors, such as inside pipelines, complex machinery, or at great heights.
- Data Richness and Documentation: Modern RVI systems capture high-resolution images and videos, providing detailed documentation for analysis, record-keeping, and regulatory compliance.
Geographically, North America and Europe currently dominate the market, driven by mature industrial bases, stringent regulatory frameworks, and significant investments in advanced technologies. However, the Asia-Pacific region is emerging as a high-growth market, propelled by rapid industrialization, expanding manufacturing capabilities, and increasing government initiatives focused on quality and safety standards. The market size in North America is estimated to be 30 billion in 2025, with Europe following closely at 25 billion. The Asia-Pacific market is projected to experience a CAGR of 10.5% during the forecast period, reaching an estimated 20 billion by 2033.
Visual Inspection Service Product Analysis
The visual inspection service market is characterized by continuous product innovation, focusing on enhancing accuracy, efficiency, and data-driven insights. Advances in high-resolution imaging, including microscopic and macroscopic capabilities, allow for the detection of increasingly minute defects. The integration of Artificial Intelligence (AI) and Machine Learning (ML) algorithms is a significant competitive advantage, enabling automated defect identification, classification, and predictive analysis. Robotic and drone-based inspection systems offer enhanced safety and accessibility, particularly for remote or hazardous environments, revolutionizing Remote Visual Inspection (RVI). These technological advancements not only improve the precision of inspections but also provide valuable data for asset management and predictive maintenance, creating a distinct market fit for industries prioritizing operational uptime and quality assurance.
Key Drivers, Barriers & Challenges in Visual Inspection Service
Key Drivers:
- Technological Advancements: The rapid evolution of AI, machine learning, robotics, and high-resolution imaging is enhancing inspection accuracy and efficiency.
- Stringent Regulatory Requirements: Growing mandates for quality, safety, and asset integrity across industries like pharmaceuticals, food and beverage, and oil and gas are driving demand.
- Focus on Operational Efficiency and Cost Reduction: Industries are increasingly adopting visual inspection services to prevent costly downtime, minimize product recalls, and optimize maintenance schedules.
- Growing Complexity of Products and Infrastructure: The intricate nature of modern manufactured goods and complex industrial infrastructure necessitates sophisticated inspection techniques.
Key Barriers & Challenges:
- High Initial Investment: Implementing advanced visual inspection technologies, such as AI-powered systems and specialized robotic equipment, can require substantial capital outlay.
- Skilled Workforce Shortage: A lack of adequately trained personnel capable of operating advanced inspection equipment and interpreting complex data can hinder market growth.
- Data Security and Privacy Concerns: The increasing reliance on digital data generated by visual inspections raises concerns regarding data security, intellectual property protection, and privacy.
- Standardization and Interoperability Issues: A lack of universally adopted standards for data formats and communication protocols can create challenges in integrating different inspection systems and sharing data across platforms.
- Competitive Pressures and Pricing: The presence of numerous service providers, including in-house inspection teams, intensifies competition and can lead to price pressures, impacting profitability.
Growth Drivers in the Visual Inspection Service Market
The Visual Inspection Service market is propelled by several key growth drivers. Technological innovation, particularly in AI-powered defect detection, advanced robotics, and high-resolution imaging, is significantly enhancing inspection capabilities and driving adoption across industries. Stringent regulatory landscapes mandating quality and safety standards in sectors like Pharmaceuticals, Food and Beverage, and Automotive are creating a consistent demand for comprehensive inspection services. Furthermore, the global focus on operational efficiency and asset integrity management is compelling industries to invest in services that prevent costly downtime and minimize product recalls. The increasing complexity of manufactured goods and infrastructure also necessitates more sophisticated visual inspection techniques.
Challenges Impacting Visual Inspection Service Growth
Despite robust growth drivers, the Visual Inspection Service market faces several challenges. The high cost of advanced technology adoption, including AI integration and specialized robotic systems, can be a significant barrier for smaller enterprises. A persistent shortage of skilled personnel capable of operating sophisticated equipment and interpreting complex inspection data poses another constraint. Data security and privacy concerns related to the vast amounts of sensitive information generated by inspections are also a growing apprehension. Furthermore, regulatory complexities and varying standards across different regions can create hurdles for global service providers. Intense competitive pressures and the need for continuous service differentiation also challenge market players.
Key Players Shaping the Visual Inspection Service Market
- TWI Global
- MISTRAS
- Element Materials Technology
- NDT Group
- Applied Inspection
- Inspectahire
- TROTEC
- Trust NDT Consultants
- Applus+
- InCon
- Highland Visual Inspection Services
- CTI
- SGS
- VTS
- Waygate Technologies
- TÜV Rheinland
- Turcert
- Acuren
- Format NDT
- INDEi
- S.T & W Inspections
- Industrial Inspection & Analysis
- Allianz Insurance
- Kiber
- Inspection Specialists
Significant Visual Inspection Service Industry Milestones
- 2019: Increased adoption of AI in automated visual inspection systems for manufacturing, leading to faster and more accurate defect detection.
- 2020: Significant surge in demand for Remote Visual Inspection (RVI) services due to global pandemic restrictions, highlighting the value of non-intrusive inspection methods.
- 2021: Major players invest heavily in drone technology and robotic solutions for inspections in challenging environments, expanding service capabilities.
- 2022: Emergence of integrated data analytics platforms that combine visual inspection data with other operational metrics for enhanced asset management.
- 2023: Growing emphasis on cybersecurity for visual inspection data, with companies implementing robust measures to protect sensitive information.
- 2024: Expansion of AI capabilities to include predictive maintenance based on visual inspection data, enabling proactive interventions and reducing unplanned downtime.
Future Outlook for Visual Inspection Service Market
The future outlook for the Visual Inspection Service market is exceptionally bright, driven by accelerating technological integration and an ever-increasing emphasis on quality and safety. Strategic opportunities lie in the continued development and adoption of AI and machine learning for predictive analytics, enabling proactive maintenance and optimized asset lifespan. The expansion of RVI solutions, leveraging advanced robotics and drone technology, will unlock new inspection frontiers in inaccessible and hazardous environments, further enhancing safety and efficiency. As industries globally strive for greater operational resilience and regulatory compliance, the demand for sophisticated, data-driven visual inspection services will continue to climb, presenting substantial growth potential for innovative and adaptable market players.
Visual Inspection Service Segmentation
-
1. Application
- 1.1. Manufacturing
- 1.2. Pharmaceutical
- 1.3. Food and Beverage
- 1.4. Electronics
- 1.5. Automotive
- 1.6. Construction
- 1.7. Others
-
2. Types
- 2.1. Onsite Visual Inspection
- 2.2. Remote Visual Inspection
Visual Inspection Service Segmentation By Geography
-
1. North America
- 1.1. United States
- 1.2. Canada
- 1.3. Mexico
-
2. South America
- 2.1. Brazil
- 2.2. Argentina
- 2.3. Rest of South America
-
3. Europe
- 3.1. United Kingdom
- 3.2. Germany
- 3.3. France
- 3.4. Italy
- 3.5. Spain
- 3.6. Russia
- 3.7. Benelux
- 3.8. Nordics
- 3.9. Rest of Europe
-
4. Middle East & Africa
- 4.1. Turkey
- 4.2. Israel
- 4.3. GCC
- 4.4. North Africa
- 4.5. South Africa
- 4.6. Rest of Middle East & Africa
-
5. Asia Pacific
- 5.1. China
- 5.2. India
- 5.3. Japan
- 5.4. South Korea
- 5.5. ASEAN
- 5.6. Oceania
- 5.7. Rest of Asia Pacific
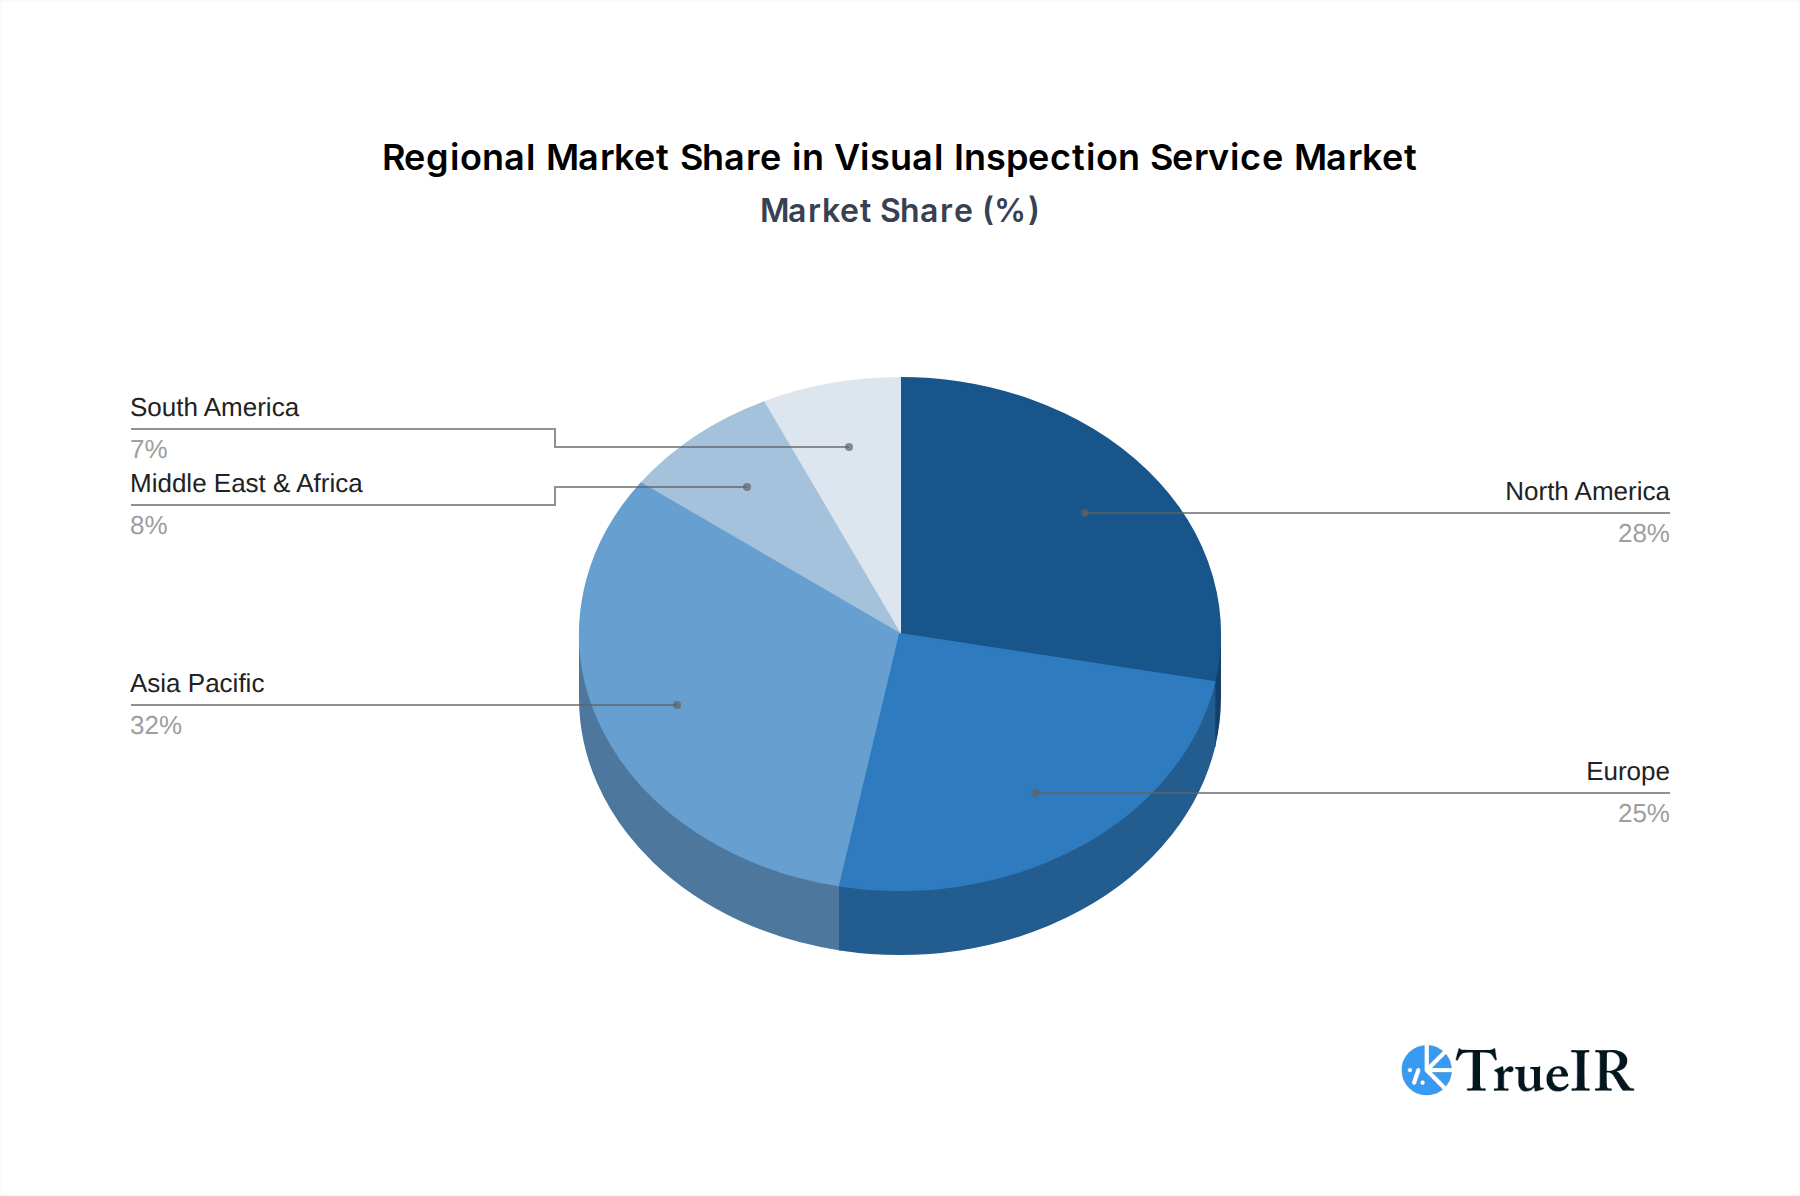
Visual Inspection Service Regional Market Share
Geographic Coverage of Visual Inspection Service
Visual Inspection Service REPORT HIGHLIGHTS
| Aspects | Details |
|---|---|
| Study Period | 2020-2034 |
| Base Year | 2025 |
| Estimated Year | 2026 |
| Forecast Period | 2026-2034 |
| Historical Period | 2020-2025 |
| Growth Rate | CAGR of 12% from 2020-2034 |
| Segmentation |
|
Table of Contents
- 1. Introduction
- 1.1. Research Scope
- 1.2. Market Segmentation
- 1.3. Research Methodology
- 1.4. Definitions and Assumptions
- 2. Executive Summary
- 2.1. Introduction
- 3. Market Dynamics
- 3.1. Introduction
- 3.2. Market Drivers
- 3.3. Market Restrains
- 3.4. Market Trends
- 4. Market Factor Analysis
- 4.1. Porters Five Forces
- 4.2. Supply/Value Chain
- 4.3. PESTEL analysis
- 4.4. Market Entropy
- 4.5. Patent/Trademark Analysis
- 5. Global Visual Inspection Service Analysis, Insights and Forecast, 2020-2032
- 5.1. Market Analysis, Insights and Forecast - by Application
- 5.1.1. Manufacturing
- 5.1.2. Pharmaceutical
- 5.1.3. Food and Beverage
- 5.1.4. Electronics
- 5.1.5. Automotive
- 5.1.6. Construction
- 5.1.7. Others
- 5.2. Market Analysis, Insights and Forecast - by Types
- 5.2.1. Onsite Visual Inspection
- 5.2.2. Remote Visual Inspection
- 5.3. Market Analysis, Insights and Forecast - by Region
- 5.3.1. North America
- 5.3.2. South America
- 5.3.3. Europe
- 5.3.4. Middle East & Africa
- 5.3.5. Asia Pacific
- 5.1. Market Analysis, Insights and Forecast - by Application
- 6. North America Visual Inspection Service Analysis, Insights and Forecast, 2020-2032
- 6.1. Market Analysis, Insights and Forecast - by Application
- 6.1.1. Manufacturing
- 6.1.2. Pharmaceutical
- 6.1.3. Food and Beverage
- 6.1.4. Electronics
- 6.1.5. Automotive
- 6.1.6. Construction
- 6.1.7. Others
- 6.2. Market Analysis, Insights and Forecast - by Types
- 6.2.1. Onsite Visual Inspection
- 6.2.2. Remote Visual Inspection
- 6.1. Market Analysis, Insights and Forecast - by Application
- 7. South America Visual Inspection Service Analysis, Insights and Forecast, 2020-2032
- 7.1. Market Analysis, Insights and Forecast - by Application
- 7.1.1. Manufacturing
- 7.1.2. Pharmaceutical
- 7.1.3. Food and Beverage
- 7.1.4. Electronics
- 7.1.5. Automotive
- 7.1.6. Construction
- 7.1.7. Others
- 7.2. Market Analysis, Insights and Forecast - by Types
- 7.2.1. Onsite Visual Inspection
- 7.2.2. Remote Visual Inspection
- 7.1. Market Analysis, Insights and Forecast - by Application
- 8. Europe Visual Inspection Service Analysis, Insights and Forecast, 2020-2032
- 8.1. Market Analysis, Insights and Forecast - by Application
- 8.1.1. Manufacturing
- 8.1.2. Pharmaceutical
- 8.1.3. Food and Beverage
- 8.1.4. Electronics
- 8.1.5. Automotive
- 8.1.6. Construction
- 8.1.7. Others
- 8.2. Market Analysis, Insights and Forecast - by Types
- 8.2.1. Onsite Visual Inspection
- 8.2.2. Remote Visual Inspection
- 8.1. Market Analysis, Insights and Forecast - by Application
- 9. Middle East & Africa Visual Inspection Service Analysis, Insights and Forecast, 2020-2032
- 9.1. Market Analysis, Insights and Forecast - by Application
- 9.1.1. Manufacturing
- 9.1.2. Pharmaceutical
- 9.1.3. Food and Beverage
- 9.1.4. Electronics
- 9.1.5. Automotive
- 9.1.6. Construction
- 9.1.7. Others
- 9.2. Market Analysis, Insights and Forecast - by Types
- 9.2.1. Onsite Visual Inspection
- 9.2.2. Remote Visual Inspection
- 9.1. Market Analysis, Insights and Forecast - by Application
- 10. Asia Pacific Visual Inspection Service Analysis, Insights and Forecast, 2020-2032
- 10.1. Market Analysis, Insights and Forecast - by Application
- 10.1.1. Manufacturing
- 10.1.2. Pharmaceutical
- 10.1.3. Food and Beverage
- 10.1.4. Electronics
- 10.1.5. Automotive
- 10.1.6. Construction
- 10.1.7. Others
- 10.2. Market Analysis, Insights and Forecast - by Types
- 10.2.1. Onsite Visual Inspection
- 10.2.2. Remote Visual Inspection
- 10.1. Market Analysis, Insights and Forecast - by Application
- 11. Competitive Analysis
- 11.1. Global Market Share Analysis 2025
- 11.2. Company Profiles
- 11.2.1 TWI Global
- 11.2.1.1. Overview
- 11.2.1.2. Products
- 11.2.1.3. SWOT Analysis
- 11.2.1.4. Recent Developments
- 11.2.1.5. Financials (Based on Availability)
- 11.2.2 MISTRAS
- 11.2.2.1. Overview
- 11.2.2.2. Products
- 11.2.2.3. SWOT Analysis
- 11.2.2.4. Recent Developments
- 11.2.2.5. Financials (Based on Availability)
- 11.2.3 Element Materials Technology
- 11.2.3.1. Overview
- 11.2.3.2. Products
- 11.2.3.3. SWOT Analysis
- 11.2.3.4. Recent Developments
- 11.2.3.5. Financials (Based on Availability)
- 11.2.4 NDT Group
- 11.2.4.1. Overview
- 11.2.4.2. Products
- 11.2.4.3. SWOT Analysis
- 11.2.4.4. Recent Developments
- 11.2.4.5. Financials (Based on Availability)
- 11.2.5 Applied Inspection
- 11.2.5.1. Overview
- 11.2.5.2. Products
- 11.2.5.3. SWOT Analysis
- 11.2.5.4. Recent Developments
- 11.2.5.5. Financials (Based on Availability)
- 11.2.6 Inspectahire
- 11.2.6.1. Overview
- 11.2.6.2. Products
- 11.2.6.3. SWOT Analysis
- 11.2.6.4. Recent Developments
- 11.2.6.5. Financials (Based on Availability)
- 11.2.7 TROTEC
- 11.2.7.1. Overview
- 11.2.7.2. Products
- 11.2.7.3. SWOT Analysis
- 11.2.7.4. Recent Developments
- 11.2.7.5. Financials (Based on Availability)
- 11.2.8 Trust NDT Consultants
- 11.2.8.1. Overview
- 11.2.8.2. Products
- 11.2.8.3. SWOT Analysis
- 11.2.8.4. Recent Developments
- 11.2.8.5. Financials (Based on Availability)
- 11.2.9 Applus+
- 11.2.9.1. Overview
- 11.2.9.2. Products
- 11.2.9.3. SWOT Analysis
- 11.2.9.4. Recent Developments
- 11.2.9.5. Financials (Based on Availability)
- 11.2.10 InCon
- 11.2.10.1. Overview
- 11.2.10.2. Products
- 11.2.10.3. SWOT Analysis
- 11.2.10.4. Recent Developments
- 11.2.10.5. Financials (Based on Availability)
- 11.2.11 Highland Visual Inspection Services
- 11.2.11.1. Overview
- 11.2.11.2. Products
- 11.2.11.3. SWOT Analysis
- 11.2.11.4. Recent Developments
- 11.2.11.5. Financials (Based on Availability)
- 11.2.12 CTI
- 11.2.12.1. Overview
- 11.2.12.2. Products
- 11.2.12.3. SWOT Analysis
- 11.2.12.4. Recent Developments
- 11.2.12.5. Financials (Based on Availability)
- 11.2.13 SGS
- 11.2.13.1. Overview
- 11.2.13.2. Products
- 11.2.13.3. SWOT Analysis
- 11.2.13.4. Recent Developments
- 11.2.13.5. Financials (Based on Availability)
- 11.2.14 VTS
- 11.2.14.1. Overview
- 11.2.14.2. Products
- 11.2.14.3. SWOT Analysis
- 11.2.14.4. Recent Developments
- 11.2.14.5. Financials (Based on Availability)
- 11.2.15 Waygate Technologies
- 11.2.15.1. Overview
- 11.2.15.2. Products
- 11.2.15.3. SWOT Analysis
- 11.2.15.4. Recent Developments
- 11.2.15.5. Financials (Based on Availability)
- 11.2.16 TÜV Rheinland
- 11.2.16.1. Overview
- 11.2.16.2. Products
- 11.2.16.3. SWOT Analysis
- 11.2.16.4. Recent Developments
- 11.2.16.5. Financials (Based on Availability)
- 11.2.17 Turcert
- 11.2.17.1. Overview
- 11.2.17.2. Products
- 11.2.17.3. SWOT Analysis
- 11.2.17.4. Recent Developments
- 11.2.17.5. Financials (Based on Availability)
- 11.2.18 Acuren
- 11.2.18.1. Overview
- 11.2.18.2. Products
- 11.2.18.3. SWOT Analysis
- 11.2.18.4. Recent Developments
- 11.2.18.5. Financials (Based on Availability)
- 11.2.19 Format NDT
- 11.2.19.1. Overview
- 11.2.19.2. Products
- 11.2.19.3. SWOT Analysis
- 11.2.19.4. Recent Developments
- 11.2.19.5. Financials (Based on Availability)
- 11.2.20 INDEi
- 11.2.20.1. Overview
- 11.2.20.2. Products
- 11.2.20.3. SWOT Analysis
- 11.2.20.4. Recent Developments
- 11.2.20.5. Financials (Based on Availability)
- 11.2.21 S.T & W Inspections
- 11.2.21.1. Overview
- 11.2.21.2. Products
- 11.2.21.3. SWOT Analysis
- 11.2.21.4. Recent Developments
- 11.2.21.5. Financials (Based on Availability)
- 11.2.22 Industrial Inspection & Analysis
- 11.2.22.1. Overview
- 11.2.22.2. Products
- 11.2.22.3. SWOT Analysis
- 11.2.22.4. Recent Developments
- 11.2.22.5. Financials (Based on Availability)
- 11.2.23 Allianz Insurance
- 11.2.23.1. Overview
- 11.2.23.2. Products
- 11.2.23.3. SWOT Analysis
- 11.2.23.4. Recent Developments
- 11.2.23.5. Financials (Based on Availability)
- 11.2.24 Kiber
- 11.2.24.1. Overview
- 11.2.24.2. Products
- 11.2.24.3. SWOT Analysis
- 11.2.24.4. Recent Developments
- 11.2.24.5. Financials (Based on Availability)
- 11.2.25 Inspection Specialists
- 11.2.25.1. Overview
- 11.2.25.2. Products
- 11.2.25.3. SWOT Analysis
- 11.2.25.4. Recent Developments
- 11.2.25.5. Financials (Based on Availability)
- 11.2.1 TWI Global
List of Figures
- Figure 1: Global Visual Inspection Service Revenue Breakdown (undefined, %) by Region 2025 & 2033
- Figure 2: North America Visual Inspection Service Revenue (undefined), by Application 2025 & 2033
- Figure 3: North America Visual Inspection Service Revenue Share (%), by Application 2025 & 2033
- Figure 4: North America Visual Inspection Service Revenue (undefined), by Types 2025 & 2033
- Figure 5: North America Visual Inspection Service Revenue Share (%), by Types 2025 & 2033
- Figure 6: North America Visual Inspection Service Revenue (undefined), by Country 2025 & 2033
- Figure 7: North America Visual Inspection Service Revenue Share (%), by Country 2025 & 2033
- Figure 8: South America Visual Inspection Service Revenue (undefined), by Application 2025 & 2033
- Figure 9: South America Visual Inspection Service Revenue Share (%), by Application 2025 & 2033
- Figure 10: South America Visual Inspection Service Revenue (undefined), by Types 2025 & 2033
- Figure 11: South America Visual Inspection Service Revenue Share (%), by Types 2025 & 2033
- Figure 12: South America Visual Inspection Service Revenue (undefined), by Country 2025 & 2033
- Figure 13: South America Visual Inspection Service Revenue Share (%), by Country 2025 & 2033
- Figure 14: Europe Visual Inspection Service Revenue (undefined), by Application 2025 & 2033
- Figure 15: Europe Visual Inspection Service Revenue Share (%), by Application 2025 & 2033
- Figure 16: Europe Visual Inspection Service Revenue (undefined), by Types 2025 & 2033
- Figure 17: Europe Visual Inspection Service Revenue Share (%), by Types 2025 & 2033
- Figure 18: Europe Visual Inspection Service Revenue (undefined), by Country 2025 & 2033
- Figure 19: Europe Visual Inspection Service Revenue Share (%), by Country 2025 & 2033
- Figure 20: Middle East & Africa Visual Inspection Service Revenue (undefined), by Application 2025 & 2033
- Figure 21: Middle East & Africa Visual Inspection Service Revenue Share (%), by Application 2025 & 2033
- Figure 22: Middle East & Africa Visual Inspection Service Revenue (undefined), by Types 2025 & 2033
- Figure 23: Middle East & Africa Visual Inspection Service Revenue Share (%), by Types 2025 & 2033
- Figure 24: Middle East & Africa Visual Inspection Service Revenue (undefined), by Country 2025 & 2033
- Figure 25: Middle East & Africa Visual Inspection Service Revenue Share (%), by Country 2025 & 2033
- Figure 26: Asia Pacific Visual Inspection Service Revenue (undefined), by Application 2025 & 2033
- Figure 27: Asia Pacific Visual Inspection Service Revenue Share (%), by Application 2025 & 2033
- Figure 28: Asia Pacific Visual Inspection Service Revenue (undefined), by Types 2025 & 2033
- Figure 29: Asia Pacific Visual Inspection Service Revenue Share (%), by Types 2025 & 2033
- Figure 30: Asia Pacific Visual Inspection Service Revenue (undefined), by Country 2025 & 2033
- Figure 31: Asia Pacific Visual Inspection Service Revenue Share (%), by Country 2025 & 2033
List of Tables
- Table 1: Global Visual Inspection Service Revenue undefined Forecast, by Application 2020 & 2033
- Table 2: Global Visual Inspection Service Revenue undefined Forecast, by Types 2020 & 2033
- Table 3: Global Visual Inspection Service Revenue undefined Forecast, by Region 2020 & 2033
- Table 4: Global Visual Inspection Service Revenue undefined Forecast, by Application 2020 & 2033
- Table 5: Global Visual Inspection Service Revenue undefined Forecast, by Types 2020 & 2033
- Table 6: Global Visual Inspection Service Revenue undefined Forecast, by Country 2020 & 2033
- Table 7: United States Visual Inspection Service Revenue (undefined) Forecast, by Application 2020 & 2033
- Table 8: Canada Visual Inspection Service Revenue (undefined) Forecast, by Application 2020 & 2033
- Table 9: Mexico Visual Inspection Service Revenue (undefined) Forecast, by Application 2020 & 2033
- Table 10: Global Visual Inspection Service Revenue undefined Forecast, by Application 2020 & 2033
- Table 11: Global Visual Inspection Service Revenue undefined Forecast, by Types 2020 & 2033
- Table 12: Global Visual Inspection Service Revenue undefined Forecast, by Country 2020 & 2033
- Table 13: Brazil Visual Inspection Service Revenue (undefined) Forecast, by Application 2020 & 2033
- Table 14: Argentina Visual Inspection Service Revenue (undefined) Forecast, by Application 2020 & 2033
- Table 15: Rest of South America Visual Inspection Service Revenue (undefined) Forecast, by Application 2020 & 2033
- Table 16: Global Visual Inspection Service Revenue undefined Forecast, by Application 2020 & 2033
- Table 17: Global Visual Inspection Service Revenue undefined Forecast, by Types 2020 & 2033
- Table 18: Global Visual Inspection Service Revenue undefined Forecast, by Country 2020 & 2033
- Table 19: United Kingdom Visual Inspection Service Revenue (undefined) Forecast, by Application 2020 & 2033
- Table 20: Germany Visual Inspection Service Revenue (undefined) Forecast, by Application 2020 & 2033
- Table 21: France Visual Inspection Service Revenue (undefined) Forecast, by Application 2020 & 2033
- Table 22: Italy Visual Inspection Service Revenue (undefined) Forecast, by Application 2020 & 2033
- Table 23: Spain Visual Inspection Service Revenue (undefined) Forecast, by Application 2020 & 2033
- Table 24: Russia Visual Inspection Service Revenue (undefined) Forecast, by Application 2020 & 2033
- Table 25: Benelux Visual Inspection Service Revenue (undefined) Forecast, by Application 2020 & 2033
- Table 26: Nordics Visual Inspection Service Revenue (undefined) Forecast, by Application 2020 & 2033
- Table 27: Rest of Europe Visual Inspection Service Revenue (undefined) Forecast, by Application 2020 & 2033
- Table 28: Global Visual Inspection Service Revenue undefined Forecast, by Application 2020 & 2033
- Table 29: Global Visual Inspection Service Revenue undefined Forecast, by Types 2020 & 2033
- Table 30: Global Visual Inspection Service Revenue undefined Forecast, by Country 2020 & 2033
- Table 31: Turkey Visual Inspection Service Revenue (undefined) Forecast, by Application 2020 & 2033
- Table 32: Israel Visual Inspection Service Revenue (undefined) Forecast, by Application 2020 & 2033
- Table 33: GCC Visual Inspection Service Revenue (undefined) Forecast, by Application 2020 & 2033
- Table 34: North Africa Visual Inspection Service Revenue (undefined) Forecast, by Application 2020 & 2033
- Table 35: South Africa Visual Inspection Service Revenue (undefined) Forecast, by Application 2020 & 2033
- Table 36: Rest of Middle East & Africa Visual Inspection Service Revenue (undefined) Forecast, by Application 2020 & 2033
- Table 37: Global Visual Inspection Service Revenue undefined Forecast, by Application 2020 & 2033
- Table 38: Global Visual Inspection Service Revenue undefined Forecast, by Types 2020 & 2033
- Table 39: Global Visual Inspection Service Revenue undefined Forecast, by Country 2020 & 2033
- Table 40: China Visual Inspection Service Revenue (undefined) Forecast, by Application 2020 & 2033
- Table 41: India Visual Inspection Service Revenue (undefined) Forecast, by Application 2020 & 2033
- Table 42: Japan Visual Inspection Service Revenue (undefined) Forecast, by Application 2020 & 2033
- Table 43: South Korea Visual Inspection Service Revenue (undefined) Forecast, by Application 2020 & 2033
- Table 44: ASEAN Visual Inspection Service Revenue (undefined) Forecast, by Application 2020 & 2033
- Table 45: Oceania Visual Inspection Service Revenue (undefined) Forecast, by Application 2020 & 2033
- Table 46: Rest of Asia Pacific Visual Inspection Service Revenue (undefined) Forecast, by Application 2020 & 2033
Frequently Asked Questions
1. What is the projected Compound Annual Growth Rate (CAGR) of the Visual Inspection Service?
The projected CAGR is approximately 12%.
2. Which companies are prominent players in the Visual Inspection Service?
Key companies in the market include TWI Global, MISTRAS, Element Materials Technology, NDT Group, Applied Inspection, Inspectahire, TROTEC, Trust NDT Consultants, Applus+, InCon, Highland Visual Inspection Services, CTI, SGS, VTS, Waygate Technologies, TÜV Rheinland, Turcert, Acuren, Format NDT, INDEi, S.T & W Inspections, Industrial Inspection & Analysis, Allianz Insurance, Kiber, Inspection Specialists.
3. What are the main segments of the Visual Inspection Service?
The market segments include Application, Types.
4. Can you provide details about the market size?
The market size is estimated to be USD XXX N/A as of 2022.
5. What are some drivers contributing to market growth?
N/A
6. What are the notable trends driving market growth?
N/A
7. Are there any restraints impacting market growth?
N/A
8. Can you provide examples of recent developments in the market?
N/A
9. What pricing options are available for accessing the report?
Pricing options include single-user, multi-user, and enterprise licenses priced at USD 4900.00, USD 7350.00, and USD 9800.00 respectively.
10. Is the market size provided in terms of value or volume?
The market size is provided in terms of value, measured in N/A.
11. Are there any specific market keywords associated with the report?
Yes, the market keyword associated with the report is "Visual Inspection Service," which aids in identifying and referencing the specific market segment covered.
12. How do I determine which pricing option suits my needs best?
The pricing options vary based on user requirements and access needs. Individual users may opt for single-user licenses, while businesses requiring broader access may choose multi-user or enterprise licenses for cost-effective access to the report.
13. Are there any additional resources or data provided in the Visual Inspection Service report?
While the report offers comprehensive insights, it's advisable to review the specific contents or supplementary materials provided to ascertain if additional resources or data are available.
14. How can I stay updated on further developments or reports in the Visual Inspection Service?
To stay informed about further developments, trends, and reports in the Visual Inspection Service, consider subscribing to industry newsletters, following relevant companies and organizations, or regularly checking reputable industry news sources and publications.
Methodology
Step 1 - Identification of Relevant Samples Size from Population Database


Step 2 - Approaches for Defining Global Market Size (Value, Volume* & Price*)

Note*: In applicable scenarios
Step 3 - Data Sources
Primary Research
- Web Analytics
- Survey Reports
- Research Institute
- Latest Research Reports
- Opinion Leaders
Secondary Research
- Annual Reports
- White Paper
- Latest Press Release
- Industry Association
- Paid Database
- Investor Presentations

Step 4 - Data Triangulation
Involves using different sources of information in order to increase the validity of a study
These sources are likely to be stakeholders in a program - participants, other researchers, program staff, other community members, and so on.
Then we put all data in single framework & apply various statistical tools to find out the dynamic on the market.
During the analysis stage, feedback from the stakeholder groups would be compared to determine areas of agreement as well as areas of divergence