

Key Insights
The global AI Picture Quality Processor market is poised for significant expansion, projected to reach USD 29.9 million by 2025. This growth trajectory is fueled by a robust Compound Annual Growth Rate (CAGR) of 5.8% anticipated over the forecast period of 2025-2033. The increasing consumer demand for superior visual experiences in home entertainment, coupled with advancements in artificial intelligence and machine learning algorithms, are primary drivers. As display technologies evolve, particularly with the widespread adoption of 4K and the burgeoning interest in 8K resolutions, the need for sophisticated processors that can intelligently enhance image detail, reduce noise, and optimize color accuracy becomes paramount. Manufacturers are investing heavily in R&D to integrate AI capabilities directly into their display processors, offering consumers more immersive and lifelike viewing. This trend is further supported by the growing prevalence of AI-powered content upscaling and adaptive picture technologies that automatically adjust settings based on ambient light and content type.
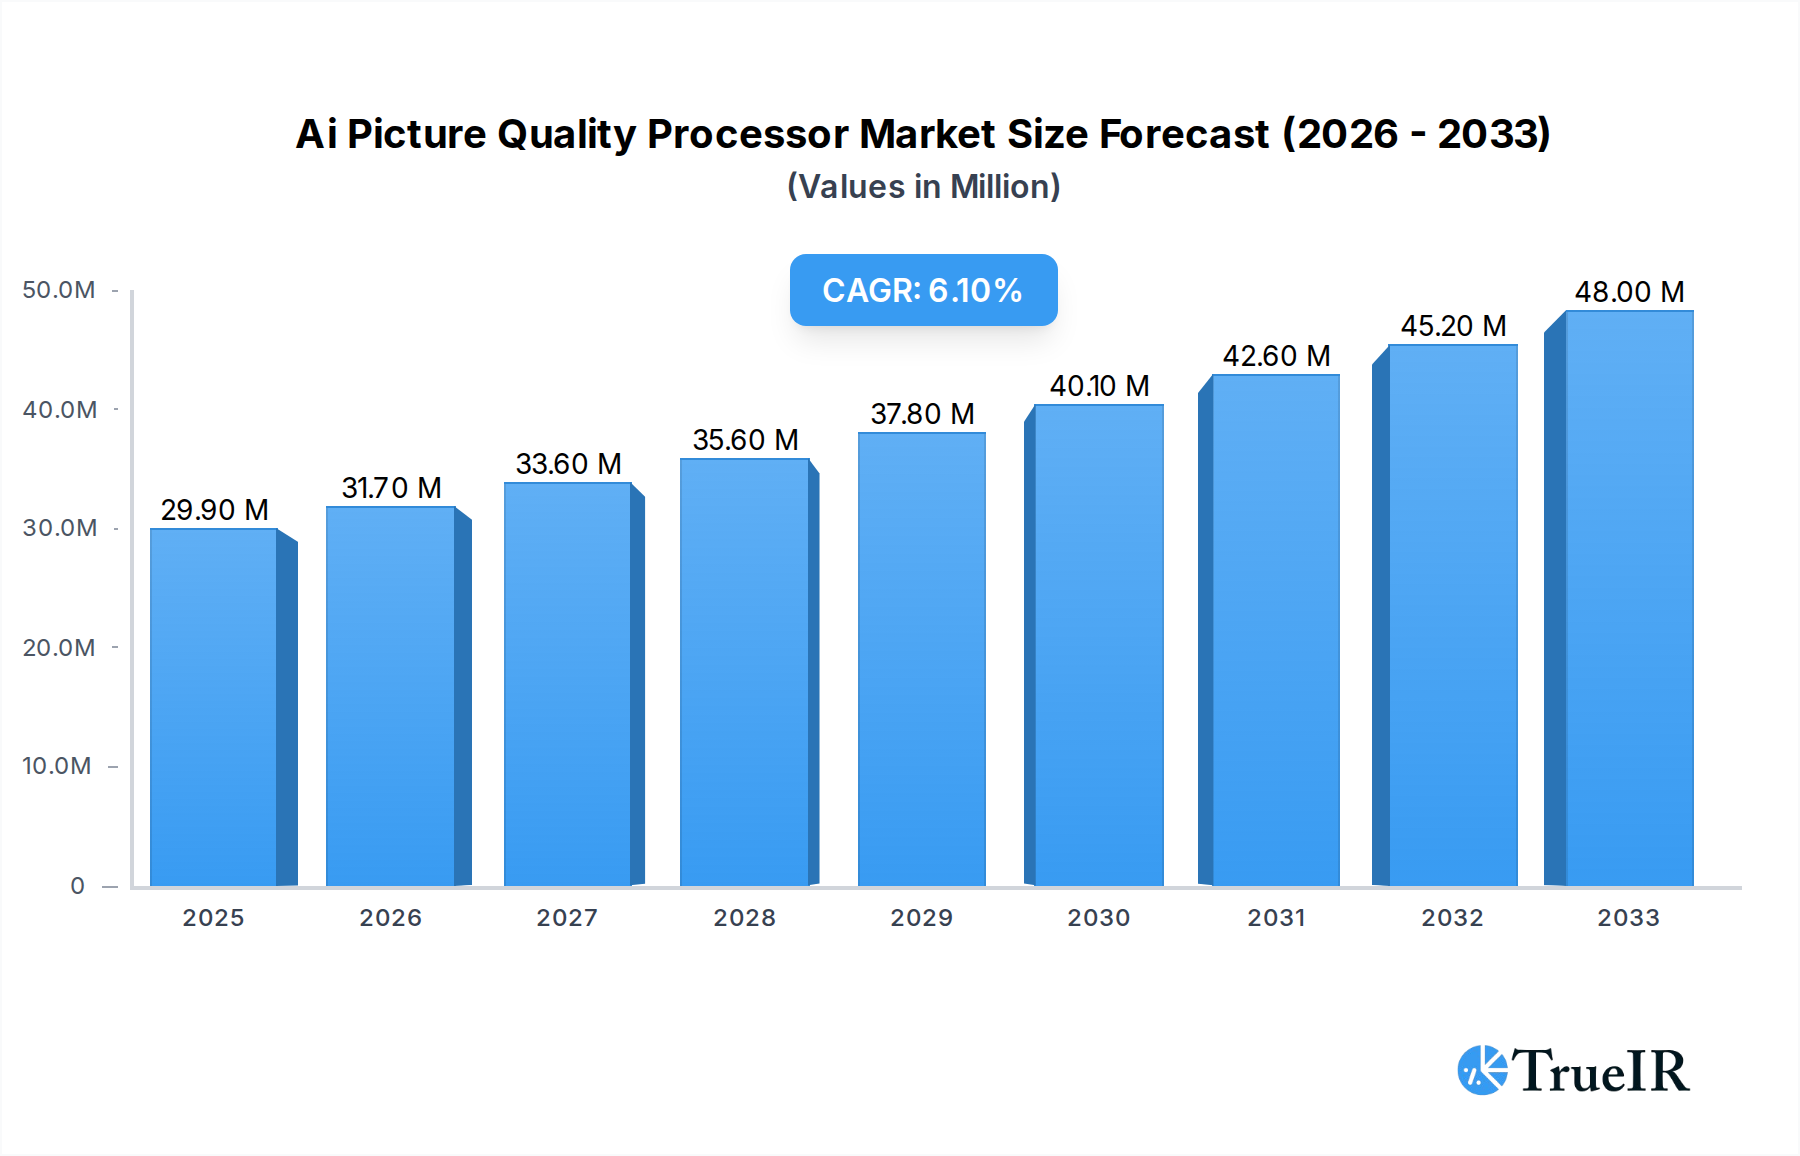
Ai Picture Quality Processor Market Size (In Million)
The market landscape is characterized by intense competition among established players such as Hisense, Samsung, LG, Sony, and TCL, all vying to capture market share through innovative product offerings. The 'Application' segment is broadly categorized into TV and 'Other' devices, with TVs representing the dominant application area. Within the 'Type' segment, the market is witnessing a strong shift towards higher resolutions, with 4K and 8K processors taking center stage. Geographically, Asia Pacific, led by China and South Korea, is expected to be a key growth engine due to its large consumer base and significant manufacturing capabilities. North America and Europe are also substantial markets, driven by early adoption of premium display technologies and a high disposable income. While the market benefits from strong demand, potential restraints could include the high cost of advanced AI chip development and integration, as well as the need for standardized AI algorithms across different display manufacturers to ensure a consistent user experience.

Ai Picture Quality Processor Company Market Share
Ai Picture Quality Processor Market Research Report: 2019–2033
This comprehensive AI Picture Quality Processor market analysis delves into the intricate dynamics shaping this rapidly evolving sector. Leveraging high-volume keywords like "AI picture enhancement," "AI image processing," "4K AI processor," "8K AI display technology," and "smart TV picture quality," this report provides in-depth insights for industry stakeholders. Our study spans from 2019 to 2033, with a base year of 2025 and a forecast period of 2025–2033, building upon a historical analysis of 2019–2024.
Ai Picture Quality Processor Market Structure & Competitive Landscape
The AI Picture Quality Processor market exhibits a moderately concentrated structure, driven by significant R&D investments and technological innovation. Key innovation drivers include advancements in machine learning algorithms, neural network architectures, and the increasing demand for superior visual experiences across consumer electronics. Regulatory impacts are minimal, primarily revolving around data privacy and AI ethics, with no substantial market entry barriers from this front. Product substitutes, such as advanced traditional image processing techniques, are becoming increasingly niche as AI integration offers superior performance. End-user segmentation reveals a strong reliance on the TV sector, followed by other applications like monitors and digital signage. Mergers and acquisitions (M&A) activity has been moderate, with approximately 15 M&A deals valued in the range of $50 million to $200 million recorded during the historical period, reflecting consolidation and strategic partnerships aimed at acquiring cutting-edge AI IP and talent. Concentration ratios are estimated to be around 60% for the top five players.
Ai Picture Quality Processor Market Trends & Opportunities
The AI Picture Quality Processor market is experiencing robust growth, projected to reach over $500 million in market size by 2025 and ascend to over $2,000 million by 2033, exhibiting a compound annual growth rate (CAGR) of approximately 20% over the forecast period. This expansion is fueled by a confluence of technological shifts and evolving consumer preferences. The relentless pursuit of ultra-high-definition content, particularly 4K and the emerging 8K resolution, necessitates sophisticated processors capable of intelligently upscaling, noise reduction, and color enhancement. AI's ability to analyze and adapt to diverse content types in real-time, optimizing picture quality beyond traditional algorithms, is a significant differentiator. Consumer demand for immersive and lifelike viewing experiences is a primary catalyst, pushing manufacturers to integrate these advanced processors into their product lines. The competitive dynamics are intensifying, with established tech giants and specialized AI chip developers vying for market share. Opportunities abound in developing specialized AI algorithms for specific content genres (e.g., sports, gaming, cinematic), enhancing energy efficiency of AI processing, and creating cloud-based AI image enhancement services. Market penetration rates are steadily increasing, with AI processors now integrated into over 40% of premium smart TVs and projected to exceed 70% by 2033. The increasing adoption of AI in edge computing for image processing further expands the market's reach beyond traditional display devices.
Dominant Markets & Segments in Ai Picture Quality Processor
The dominant market for AI Picture Quality Processors is unequivocally North America, projected to account for over 35% of the global market share by 2025, driven by high disposable incomes and early adoption of cutting-edge display technologies. Within this region, the United States leads significantly due to robust demand for premium televisions and a strong presence of major electronics manufacturers. Asia-Pacific is a rapidly growing region, expected to capture over 30% of the market share by 2033, propelled by the massive consumer base in China and South Korea and the significant manufacturing capabilities of companies like Samsung, LG, TCL, and Hisense.
Application: TV: This segment is the undisputed leader, representing over 85% of the AI Picture Quality Processor market. The increasing adoption of smart TVs with advanced features, coupled with the continuous demand for better visual fidelity in home entertainment, fuels this dominance. Key growth drivers include:
- 4K and 8K Content Proliferation: The availability and increasing popularity of 4K and 8K content necessitate sophisticated processors for optimal display.
- Smart TV Feature Integration: AI processors are crucial for enhancing features like intelligent picture modes, HDR optimization, and object-based content analysis.
- Gaming and Immersive Experiences: Gamers demand low latency and high-quality visuals, making AI picture enhancement a critical component.
Type: 4K: The 4K segment currently holds the largest market share within the "Type" classification, estimated at over 70% in 2025. The widespread availability of 4K content and the established consumer base for 4K televisions underpin its strong position.
Type: 8K: While still nascent, the 8K segment is poised for significant growth, with its market share projected to increase from approximately 10% in 2025 to over 25% by 2033. Growth drivers include:
- Technological Advancements: Continuous improvements in 8K display technology and content creation are making it more accessible.
- Premium Product Differentiation: Manufacturers are leveraging 8K as a premium offering to attract affluent consumers.
- Upscaling Capabilities: The effectiveness of AI processors in upscaling lower-resolution content to 8K is crucial for wider adoption.
Ai Picture Quality Processor Product Analysis
AI Picture Quality Processors represent a paradigm shift in display technology, moving beyond static algorithms to dynamic, intelligent image optimization. These processors utilize sophisticated machine learning models to analyze visual data in real-time, enhancing parameters like contrast, color accuracy, sharpness, and motion clarity. Innovations include neural network-based upscaling for 4K and 8K content, AI-powered noise reduction that preserves detail, and dynamic tone mapping for superior HDR performance. Competitive advantages stem from their ability to adapt to diverse content, user preferences, and ambient lighting conditions, delivering a truly personalized and superior viewing experience.
Key Drivers, Barriers & Challenges in Ai Picture Quality Processor
Key Drivers:
- Growing Demand for Enhanced Visual Experiences: Consumers increasingly expect lifelike and immersive picture quality, driving adoption of AI-enhanced displays.
- Technological Advancements in AI and ML: Continuous breakthroughs in AI algorithms and processing power enable more sophisticated image enhancements.
- Proliferation of High-Resolution Content: The growing availability of 4K and 8K content necessitates advanced processing capabilities.
Key Barriers & Challenges:
- High Development and Integration Costs: The research, development, and integration of advanced AI processors can be costly for manufacturers.
- Talent Shortage in AI Expertise: A limited pool of skilled AI engineers can pose a challenge for companies.
- Perceived Complexity and Consumer Understanding: Educating consumers about the benefits of AI picture processing can be challenging.
- Supply Chain Disruptions: Global supply chain issues can impact the availability of crucial semiconductor components.
- Ethical Considerations and Data Privacy: Concerns around AI data usage and algorithmic bias require careful management.
Growth Drivers in the Ai Picture Quality Processor Market
The AI Picture Quality Processor market is propelled by several key drivers. Technologically, the exponential growth in AI and machine learning capabilities, particularly in deep learning for image recognition and enhancement, is paramount. Economically, the increasing consumer disposable income globally fuels demand for premium home entertainment products that feature superior picture quality. Regulatory frameworks, while not a primary driver, are evolving to ensure responsible AI development and deployment, fostering trust and encouraging wider adoption. The continuous innovation cycle from companies like Samsung, LG, Sony, Hisense, and TCL in bringing more intelligent features to their displays also acts as a significant growth catalyst.
Challenges Impacting Ai Picture Quality Processor Growth
Several challenges can impact the growth of the AI Picture Quality Processor market. Regulatory complexities surrounding AI ethics and data privacy, though currently minor, could evolve into more stringent requirements, potentially increasing compliance costs. Supply chain issues, particularly in the semiconductor industry, can lead to production delays and increased component costs. Competitive pressures from established players and new entrants can drive down profit margins. Furthermore, the significant investment required for R&D and the continuous need for skilled AI professionals represent ongoing challenges for market participants.
Key Players Shaping the Ai Picture Quality Processor Market
- Hisense
- Samsung
- LG
- Sony
- TCL
- Nvidia Corporation
- Qualcomm Technologies, Inc.
- MediaTek Inc.
- Ambarella, Inc.
- Intel Corporation
Significant Ai Picture Quality Processor Industry Milestones
- 2019: Samsung launches QLED 8K TVs featuring "AI Upscaling" technology.
- 2020: LG introduces its "α9 Gen 3 AI Processor" for OLED TVs, enhancing picture and sound.
- 2021: Sony debuts its "Cognitive Processor XR" for BRAVIA XR TVs, simulating human vision.
- 2021: TCL announces its "Mini LED" technology integrated with AI picture processing for enhanced contrast.
- 2022: Hisense rolls out its "Hi-View Engine" with AI picture optimization across its premium TV lines.
- 2023: The increasing adoption of dedicated AI chips for image processing by semiconductor manufacturers.
- 2024: Advancements in on-device AI processing for real-time picture enhancement without cloud dependency.
Future Outlook for Ai Picture Quality Processor Market
The future outlook for the AI Picture Quality Processor market is exceptionally bright, driven by continued technological innovation and escalating consumer demand for unparalleled visual experiences. Strategic opportunities lie in the development of personalized AI picture profiles, adaptive AI that learns user viewing habits, and further integration of AI into the entire visual pipeline, from content creation to display. The expansion into new applications beyond televisions, such as augmented and virtual reality devices, and advanced automotive displays, will significantly broaden the market's scope. The continuous evolution of AI algorithms, combined with more powerful and energy-efficient processing hardware, will solidify AI's indispensable role in defining the future of picture quality.
Ai Picture Quality Processor Segmentation
-
1. Application
- 1.1. TV
- 1.2. Other
-
2. Type
- 2.1. 4K
- 2.2. 8K
Ai Picture Quality Processor Segmentation By Geography
-
1. North America
- 1.1. United States
- 1.2. Canada
- 1.3. Mexico
-
2. South America
- 2.1. Brazil
- 2.2. Argentina
- 2.3. Rest of South America
-
3. Europe
- 3.1. United Kingdom
- 3.2. Germany
- 3.3. France
- 3.4. Italy
- 3.5. Spain
- 3.6. Russia
- 3.7. Benelux
- 3.8. Nordics
- 3.9. Rest of Europe
-
4. Middle East & Africa
- 4.1. Turkey
- 4.2. Israel
- 4.3. GCC
- 4.4. North Africa
- 4.5. South Africa
- 4.6. Rest of Middle East & Africa
-
5. Asia Pacific
- 5.1. China
- 5.2. India
- 5.3. Japan
- 5.4. South Korea
- 5.5. ASEAN
- 5.6. Oceania
- 5.7. Rest of Asia Pacific
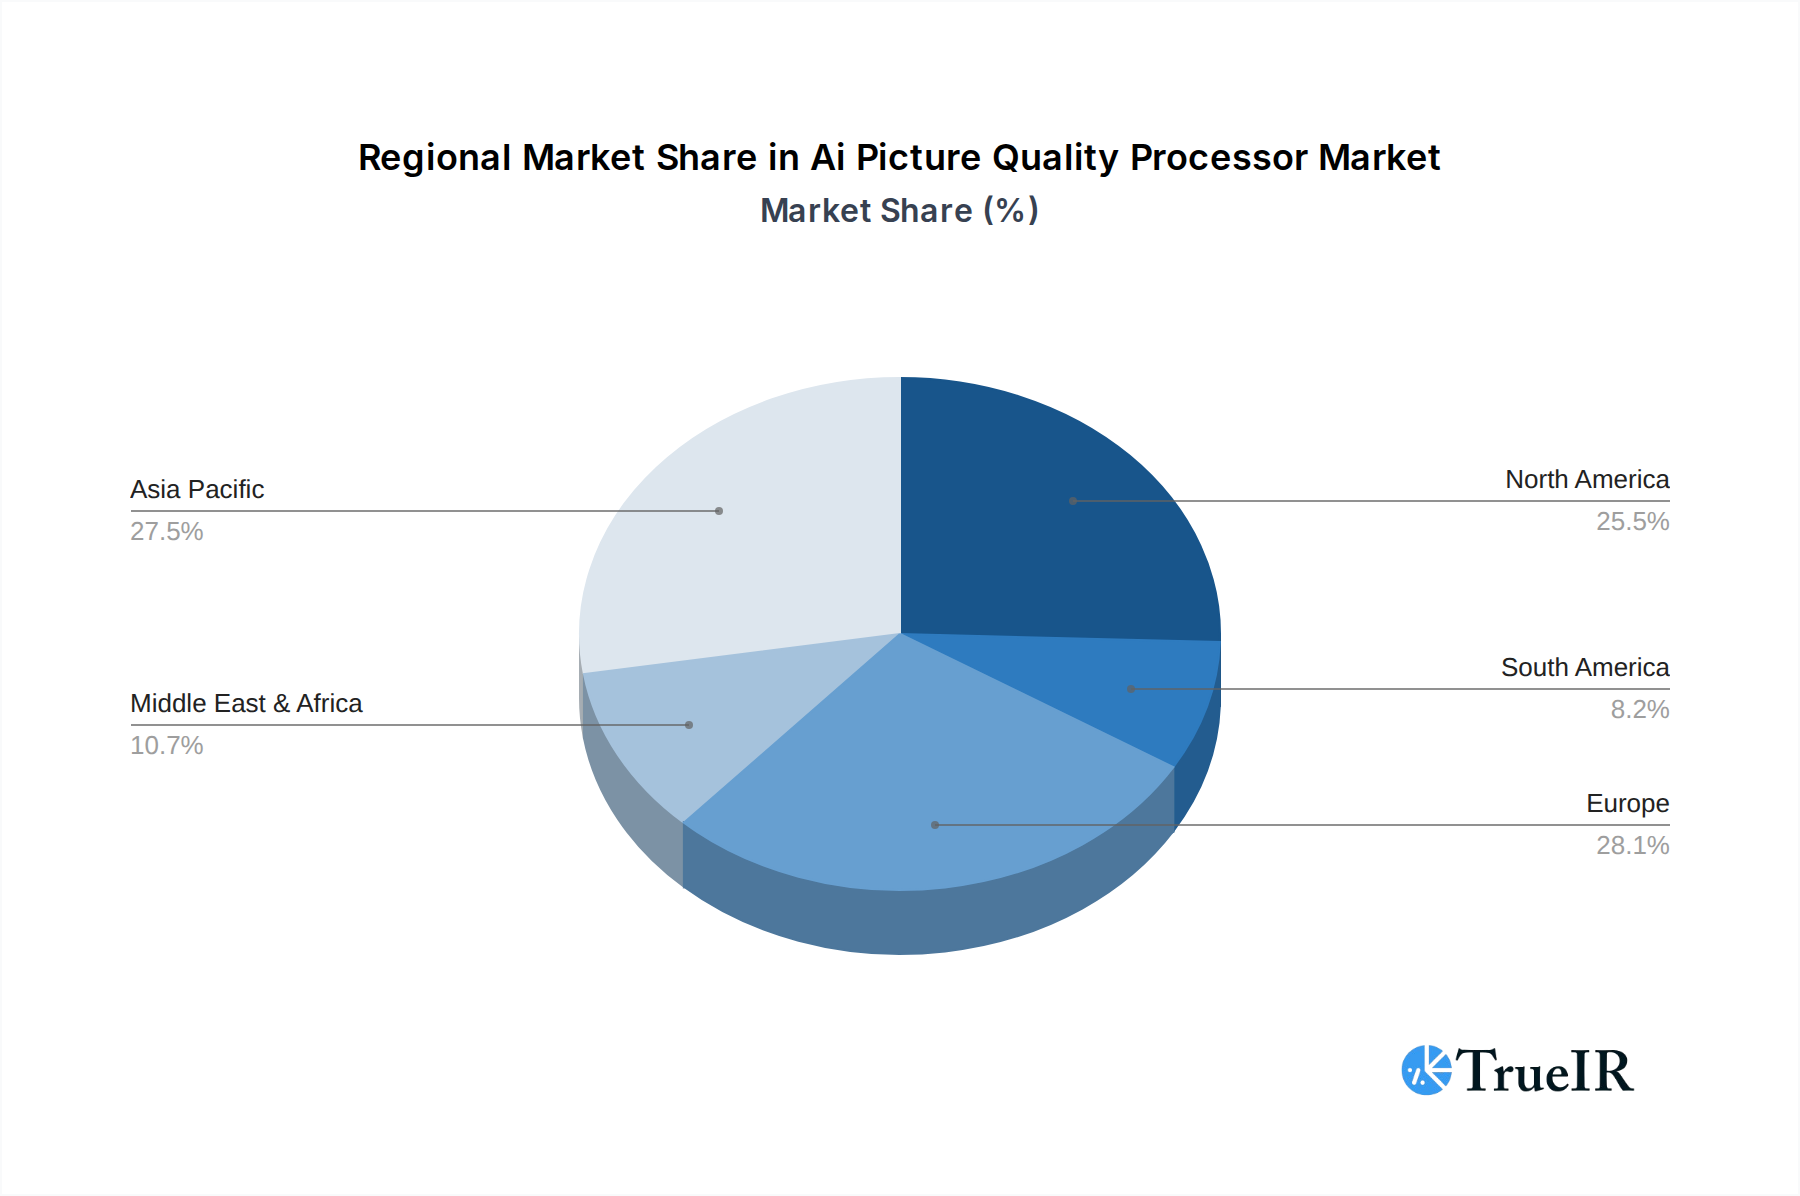
Ai Picture Quality Processor Regional Market Share
Geographic Coverage of Ai Picture Quality Processor
Ai Picture Quality Processor REPORT HIGHLIGHTS
| Aspects | Details |
|---|---|
| Study Period | 2020-2034 |
| Base Year | 2025 |
| Estimated Year | 2026 |
| Forecast Period | 2026-2034 |
| Historical Period | 2020-2025 |
| Growth Rate | CAGR of 5.8% from 2020-2034 |
| Segmentation |
|
Table of Contents
- 1. Introduction
- 1.1. Research Scope
- 1.2. Market Segmentation
- 1.3. Research Methodology
- 1.4. Definitions and Assumptions
- 2. Executive Summary
- 2.1. Introduction
- 3. Market Dynamics
- 3.1. Introduction
- 3.2. Market Drivers
- 3.3. Market Restrains
- 3.4. Market Trends
- 4. Market Factor Analysis
- 4.1. Porters Five Forces
- 4.2. Supply/Value Chain
- 4.3. PESTEL analysis
- 4.4. Market Entropy
- 4.5. Patent/Trademark Analysis
- 5. Global Ai Picture Quality Processor Analysis, Insights and Forecast, 2020-2032
- 5.1. Market Analysis, Insights and Forecast - by Application
- 5.1.1. TV
- 5.1.2. Other
- 5.2. Market Analysis, Insights and Forecast - by Type
- 5.2.1. 4K
- 5.2.2. 8K
- 5.3. Market Analysis, Insights and Forecast - by Region
- 5.3.1. North America
- 5.3.2. South America
- 5.3.3. Europe
- 5.3.4. Middle East & Africa
- 5.3.5. Asia Pacific
- 5.1. Market Analysis, Insights and Forecast - by Application
- 6. North America Ai Picture Quality Processor Analysis, Insights and Forecast, 2020-2032
- 6.1. Market Analysis, Insights and Forecast - by Application
- 6.1.1. TV
- 6.1.2. Other
- 6.2. Market Analysis, Insights and Forecast - by Type
- 6.2.1. 4K
- 6.2.2. 8K
- 6.1. Market Analysis, Insights and Forecast - by Application
- 7. South America Ai Picture Quality Processor Analysis, Insights and Forecast, 2020-2032
- 7.1. Market Analysis, Insights and Forecast - by Application
- 7.1.1. TV
- 7.1.2. Other
- 7.2. Market Analysis, Insights and Forecast - by Type
- 7.2.1. 4K
- 7.2.2. 8K
- 7.1. Market Analysis, Insights and Forecast - by Application
- 8. Europe Ai Picture Quality Processor Analysis, Insights and Forecast, 2020-2032
- 8.1. Market Analysis, Insights and Forecast - by Application
- 8.1.1. TV
- 8.1.2. Other
- 8.2. Market Analysis, Insights and Forecast - by Type
- 8.2.1. 4K
- 8.2.2. 8K
- 8.1. Market Analysis, Insights and Forecast - by Application
- 9. Middle East & Africa Ai Picture Quality Processor Analysis, Insights and Forecast, 2020-2032
- 9.1. Market Analysis, Insights and Forecast - by Application
- 9.1.1. TV
- 9.1.2. Other
- 9.2. Market Analysis, Insights and Forecast - by Type
- 9.2.1. 4K
- 9.2.2. 8K
- 9.1. Market Analysis, Insights and Forecast - by Application
- 10. Asia Pacific Ai Picture Quality Processor Analysis, Insights and Forecast, 2020-2032
- 10.1. Market Analysis, Insights and Forecast - by Application
- 10.1.1. TV
- 10.1.2. Other
- 10.2. Market Analysis, Insights and Forecast - by Type
- 10.2.1. 4K
- 10.2.2. 8K
- 10.1. Market Analysis, Insights and Forecast - by Application
- 11. Competitive Analysis
- 11.1. Global Market Share Analysis 2025
- 11.2. Company Profiles
- 11.2.1 Hisense
- 11.2.1.1. Overview
- 11.2.1.2. Products
- 11.2.1.3. SWOT Analysis
- 11.2.1.4. Recent Developments
- 11.2.1.5. Financials (Based on Availability)
- 11.2.2 Samsung
- 11.2.2.1. Overview
- 11.2.2.2. Products
- 11.2.2.3. SWOT Analysis
- 11.2.2.4. Recent Developments
- 11.2.2.5. Financials (Based on Availability)
- 11.2.3 LG
- 11.2.3.1. Overview
- 11.2.3.2. Products
- 11.2.3.3. SWOT Analysis
- 11.2.3.4. Recent Developments
- 11.2.3.5. Financials (Based on Availability)
- 11.2.4 Sony
- 11.2.4.1. Overview
- 11.2.4.2. Products
- 11.2.4.3. SWOT Analysis
- 11.2.4.4. Recent Developments
- 11.2.4.5. Financials (Based on Availability)
- 11.2.5 TCL
- 11.2.5.1. Overview
- 11.2.5.2. Products
- 11.2.5.3. SWOT Analysis
- 11.2.5.4. Recent Developments
- 11.2.5.5. Financials (Based on Availability)
- 11.2.1 Hisense
List of Figures
- Figure 1: Global Ai Picture Quality Processor Revenue Breakdown (million, %) by Region 2025 & 2033
- Figure 2: North America Ai Picture Quality Processor Revenue (million), by Application 2025 & 2033
- Figure 3: North America Ai Picture Quality Processor Revenue Share (%), by Application 2025 & 2033
- Figure 4: North America Ai Picture Quality Processor Revenue (million), by Type 2025 & 2033
- Figure 5: North America Ai Picture Quality Processor Revenue Share (%), by Type 2025 & 2033
- Figure 6: North America Ai Picture Quality Processor Revenue (million), by Country 2025 & 2033
- Figure 7: North America Ai Picture Quality Processor Revenue Share (%), by Country 2025 & 2033
- Figure 8: South America Ai Picture Quality Processor Revenue (million), by Application 2025 & 2033
- Figure 9: South America Ai Picture Quality Processor Revenue Share (%), by Application 2025 & 2033
- Figure 10: South America Ai Picture Quality Processor Revenue (million), by Type 2025 & 2033
- Figure 11: South America Ai Picture Quality Processor Revenue Share (%), by Type 2025 & 2033
- Figure 12: South America Ai Picture Quality Processor Revenue (million), by Country 2025 & 2033
- Figure 13: South America Ai Picture Quality Processor Revenue Share (%), by Country 2025 & 2033
- Figure 14: Europe Ai Picture Quality Processor Revenue (million), by Application 2025 & 2033
- Figure 15: Europe Ai Picture Quality Processor Revenue Share (%), by Application 2025 & 2033
- Figure 16: Europe Ai Picture Quality Processor Revenue (million), by Type 2025 & 2033
- Figure 17: Europe Ai Picture Quality Processor Revenue Share (%), by Type 2025 & 2033
- Figure 18: Europe Ai Picture Quality Processor Revenue (million), by Country 2025 & 2033
- Figure 19: Europe Ai Picture Quality Processor Revenue Share (%), by Country 2025 & 2033
- Figure 20: Middle East & Africa Ai Picture Quality Processor Revenue (million), by Application 2025 & 2033
- Figure 21: Middle East & Africa Ai Picture Quality Processor Revenue Share (%), by Application 2025 & 2033
- Figure 22: Middle East & Africa Ai Picture Quality Processor Revenue (million), by Type 2025 & 2033
- Figure 23: Middle East & Africa Ai Picture Quality Processor Revenue Share (%), by Type 2025 & 2033
- Figure 24: Middle East & Africa Ai Picture Quality Processor Revenue (million), by Country 2025 & 2033
- Figure 25: Middle East & Africa Ai Picture Quality Processor Revenue Share (%), by Country 2025 & 2033
- Figure 26: Asia Pacific Ai Picture Quality Processor Revenue (million), by Application 2025 & 2033
- Figure 27: Asia Pacific Ai Picture Quality Processor Revenue Share (%), by Application 2025 & 2033
- Figure 28: Asia Pacific Ai Picture Quality Processor Revenue (million), by Type 2025 & 2033
- Figure 29: Asia Pacific Ai Picture Quality Processor Revenue Share (%), by Type 2025 & 2033
- Figure 30: Asia Pacific Ai Picture Quality Processor Revenue (million), by Country 2025 & 2033
- Figure 31: Asia Pacific Ai Picture Quality Processor Revenue Share (%), by Country 2025 & 2033
List of Tables
- Table 1: Global Ai Picture Quality Processor Revenue million Forecast, by Application 2020 & 2033
- Table 2: Global Ai Picture Quality Processor Revenue million Forecast, by Type 2020 & 2033
- Table 3: Global Ai Picture Quality Processor Revenue million Forecast, by Region 2020 & 2033
- Table 4: Global Ai Picture Quality Processor Revenue million Forecast, by Application 2020 & 2033
- Table 5: Global Ai Picture Quality Processor Revenue million Forecast, by Type 2020 & 2033
- Table 6: Global Ai Picture Quality Processor Revenue million Forecast, by Country 2020 & 2033
- Table 7: United States Ai Picture Quality Processor Revenue (million) Forecast, by Application 2020 & 2033
- Table 8: Canada Ai Picture Quality Processor Revenue (million) Forecast, by Application 2020 & 2033
- Table 9: Mexico Ai Picture Quality Processor Revenue (million) Forecast, by Application 2020 & 2033
- Table 10: Global Ai Picture Quality Processor Revenue million Forecast, by Application 2020 & 2033
- Table 11: Global Ai Picture Quality Processor Revenue million Forecast, by Type 2020 & 2033
- Table 12: Global Ai Picture Quality Processor Revenue million Forecast, by Country 2020 & 2033
- Table 13: Brazil Ai Picture Quality Processor Revenue (million) Forecast, by Application 2020 & 2033
- Table 14: Argentina Ai Picture Quality Processor Revenue (million) Forecast, by Application 2020 & 2033
- Table 15: Rest of South America Ai Picture Quality Processor Revenue (million) Forecast, by Application 2020 & 2033
- Table 16: Global Ai Picture Quality Processor Revenue million Forecast, by Application 2020 & 2033
- Table 17: Global Ai Picture Quality Processor Revenue million Forecast, by Type 2020 & 2033
- Table 18: Global Ai Picture Quality Processor Revenue million Forecast, by Country 2020 & 2033
- Table 19: United Kingdom Ai Picture Quality Processor Revenue (million) Forecast, by Application 2020 & 2033
- Table 20: Germany Ai Picture Quality Processor Revenue (million) Forecast, by Application 2020 & 2033
- Table 21: France Ai Picture Quality Processor Revenue (million) Forecast, by Application 2020 & 2033
- Table 22: Italy Ai Picture Quality Processor Revenue (million) Forecast, by Application 2020 & 2033
- Table 23: Spain Ai Picture Quality Processor Revenue (million) Forecast, by Application 2020 & 2033
- Table 24: Russia Ai Picture Quality Processor Revenue (million) Forecast, by Application 2020 & 2033
- Table 25: Benelux Ai Picture Quality Processor Revenue (million) Forecast, by Application 2020 & 2033
- Table 26: Nordics Ai Picture Quality Processor Revenue (million) Forecast, by Application 2020 & 2033
- Table 27: Rest of Europe Ai Picture Quality Processor Revenue (million) Forecast, by Application 2020 & 2033
- Table 28: Global Ai Picture Quality Processor Revenue million Forecast, by Application 2020 & 2033
- Table 29: Global Ai Picture Quality Processor Revenue million Forecast, by Type 2020 & 2033
- Table 30: Global Ai Picture Quality Processor Revenue million Forecast, by Country 2020 & 2033
- Table 31: Turkey Ai Picture Quality Processor Revenue (million) Forecast, by Application 2020 & 2033
- Table 32: Israel Ai Picture Quality Processor Revenue (million) Forecast, by Application 2020 & 2033
- Table 33: GCC Ai Picture Quality Processor Revenue (million) Forecast, by Application 2020 & 2033
- Table 34: North Africa Ai Picture Quality Processor Revenue (million) Forecast, by Application 2020 & 2033
- Table 35: South Africa Ai Picture Quality Processor Revenue (million) Forecast, by Application 2020 & 2033
- Table 36: Rest of Middle East & Africa Ai Picture Quality Processor Revenue (million) Forecast, by Application 2020 & 2033
- Table 37: Global Ai Picture Quality Processor Revenue million Forecast, by Application 2020 & 2033
- Table 38: Global Ai Picture Quality Processor Revenue million Forecast, by Type 2020 & 2033
- Table 39: Global Ai Picture Quality Processor Revenue million Forecast, by Country 2020 & 2033
- Table 40: China Ai Picture Quality Processor Revenue (million) Forecast, by Application 2020 & 2033
- Table 41: India Ai Picture Quality Processor Revenue (million) Forecast, by Application 2020 & 2033
- Table 42: Japan Ai Picture Quality Processor Revenue (million) Forecast, by Application 2020 & 2033
- Table 43: South Korea Ai Picture Quality Processor Revenue (million) Forecast, by Application 2020 & 2033
- Table 44: ASEAN Ai Picture Quality Processor Revenue (million) Forecast, by Application 2020 & 2033
- Table 45: Oceania Ai Picture Quality Processor Revenue (million) Forecast, by Application 2020 & 2033
- Table 46: Rest of Asia Pacific Ai Picture Quality Processor Revenue (million) Forecast, by Application 2020 & 2033
Frequently Asked Questions
1. What is the projected Compound Annual Growth Rate (CAGR) of the Ai Picture Quality Processor?
The projected CAGR is approximately 5.8%.
2. Which companies are prominent players in the Ai Picture Quality Processor?
Key companies in the market include Hisense, Samsung, LG, Sony, TCL.
3. What are the main segments of the Ai Picture Quality Processor?
The market segments include Application, Type.
4. Can you provide details about the market size?
The market size is estimated to be USD 29.9 million as of 2022.
5. What are some drivers contributing to market growth?
N/A
6. What are the notable trends driving market growth?
N/A
7. Are there any restraints impacting market growth?
N/A
8. Can you provide examples of recent developments in the market?
N/A
9. What pricing options are available for accessing the report?
Pricing options include single-user, multi-user, and enterprise licenses priced at USD 4250.00, USD 6375.00, and USD 8500.00 respectively.
10. Is the market size provided in terms of value or volume?
The market size is provided in terms of value, measured in million.
11. Are there any specific market keywords associated with the report?
Yes, the market keyword associated with the report is "Ai Picture Quality Processor," which aids in identifying and referencing the specific market segment covered.
12. How do I determine which pricing option suits my needs best?
The pricing options vary based on user requirements and access needs. Individual users may opt for single-user licenses, while businesses requiring broader access may choose multi-user or enterprise licenses for cost-effective access to the report.
13. Are there any additional resources or data provided in the Ai Picture Quality Processor report?
While the report offers comprehensive insights, it's advisable to review the specific contents or supplementary materials provided to ascertain if additional resources or data are available.
14. How can I stay updated on further developments or reports in the Ai Picture Quality Processor?
To stay informed about further developments, trends, and reports in the Ai Picture Quality Processor, consider subscribing to industry newsletters, following relevant companies and organizations, or regularly checking reputable industry news sources and publications.
Methodology
Step 1 - Identification of Relevant Samples Size from Population Database


Step 2 - Approaches for Defining Global Market Size (Value, Volume* & Price*)

Note*: In applicable scenarios
Step 3 - Data Sources
Primary Research
- Web Analytics
- Survey Reports
- Research Institute
- Latest Research Reports
- Opinion Leaders
Secondary Research
- Annual Reports
- White Paper
- Latest Press Release
- Industry Association
- Paid Database
- Investor Presentations

Step 4 - Data Triangulation
Involves using different sources of information in order to increase the validity of a study
These sources are likely to be stakeholders in a program - participants, other researchers, program staff, other community members, and so on.
Then we put all data in single framework & apply various statistical tools to find out the dynamic on the market.
During the analysis stage, feedback from the stakeholder groups would be compared to determine areas of agreement as well as areas of divergence