

Key Insights
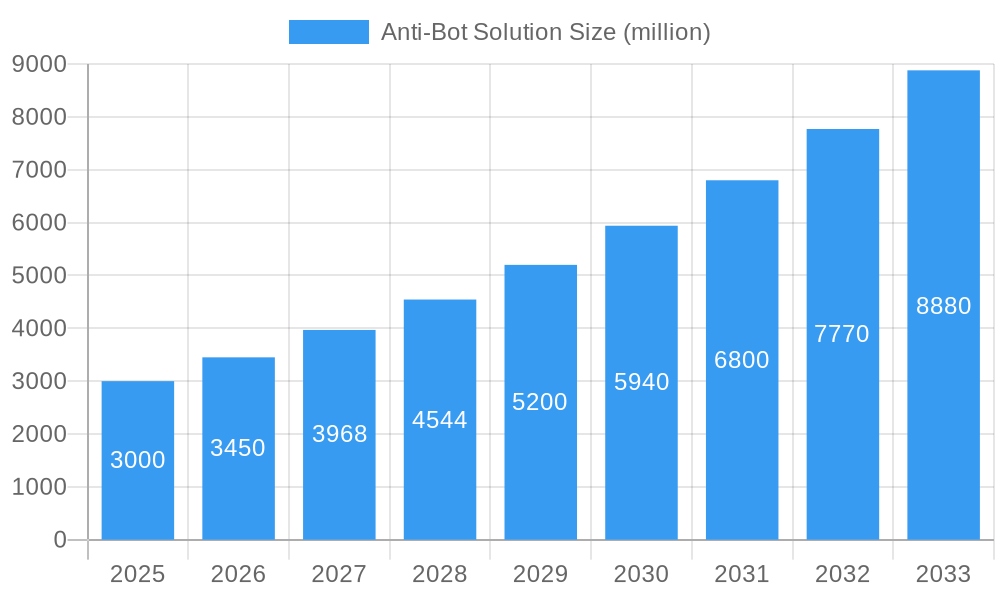
The anti-bot solution market is experiencing robust growth, driven by the escalating sophistication of bot attacks targeting websites and applications. The increasing reliance on digital channels for commerce, communication, and information access fuels this demand. Businesses across sectors, from e-commerce and finance to healthcare and media, are investing heavily in anti-bot solutions to mitigate fraud, data scraping, account takeovers, and denial-of-service (DoS) attacks. The market's expansion is further fueled by the evolution of bot technologies, necessitating equally advanced defensive measures. While challenges remain, such as the constant arms race between bot developers and security providers, and the need for solutions that balance security with user experience, the market is poised for continued expansion. We estimate the 2025 market size to be around $3 billion, based on observed growth in related cybersecurity sectors and expert assessments. A conservative compound annual growth rate (CAGR) of 15% is projected for the 2025-2033 forecast period, reflecting the sustained need for advanced anti-bot technologies. This growth is anticipated across all major regions, with North America and Europe maintaining significant market share due to higher digital adoption rates and stringent data protection regulations. Key market segments include solutions categorized by deployment (cloud, on-premise), by target (web, mobile), and by functionality (detection, mitigation).
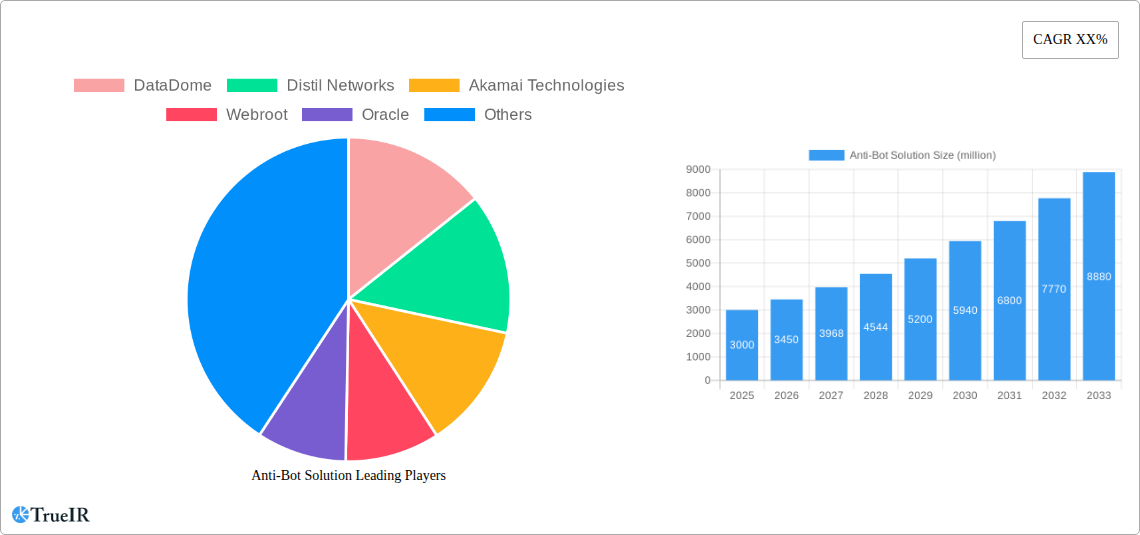
Anti-Bot Solution Market Size (In Billion)
The competitive landscape is highly dynamic, with established players like Akamai Technologies, Imperva, and Cloudflare competing with emerging innovative companies like Arkose Labs and DataDome. Successful players differentiate themselves through advanced techniques like machine learning, behavioral biometrics, and sophisticated threat intelligence. The market is likely to see further consolidation through mergers and acquisitions as companies strive to expand their capabilities and market reach. The focus will increasingly shift towards AI-driven solutions capable of adapting to the constantly evolving tactics of bot creators. Factors such as rising data privacy regulations and increasing awareness of bot-related risks will continue to drive market growth. However, limitations such as high implementation costs, the need for continuous updates, and the challenge of maintaining a balance between security and legitimate user experience are expected to remain as restraints.
Anti-Bot Solution Company Market Share
Anti-Bot Solution Market Report: 2019-2033 - A Comprehensive Analysis of a Multi-Billion Dollar Industry
This in-depth report provides a comprehensive analysis of the global Anti-Bot Solution market, projecting a massive expansion from $xx million in 2025 to $xx million by 2033, representing a CAGR of xx%. The study covers the period 2019-2033, with 2025 as the base year and 2025 as the estimated year. This report is invaluable for businesses, investors, and researchers seeking to understand the dynamics and opportunities within this rapidly evolving sector.
Anti-Bot Solution Market Structure & Competitive Landscape
The Anti-Bot Solution market is characterized by a moderately concentrated landscape, with a few major players holding significant market share. The Herfindahl-Hirschman Index (HHI) is estimated at xx in 2025, indicating a moderately concentrated market. However, the market is also dynamic, driven by continuous innovation in bot detection technologies and increasing regulatory pressure to combat malicious bot activity. Product substitution is a key factor, with companies constantly evolving their solutions to stay ahead of sophisticated bot attacks.
Market Concentration: The top 5 players account for approximately xx% of the global market in 2025.
Innovation Drivers: Advancements in AI, machine learning, and behavioral biometrics are key drivers, leading to more accurate and adaptive bot detection solutions.
Regulatory Impacts: Increasing regulations around data privacy and online security are boosting demand for robust anti-bot solutions, particularly in sectors such as finance and e-commerce.
Product Substitutes: While dedicated anti-bot solutions are primary, some security platforms integrate basic bot mitigation capabilities. This creates some level of substitution, but specialized anti-bot solutions generally offer superior performance.
End-User Segmentation: Key segments include e-commerce, financial services, gaming, and media & entertainment.
M&A Trends: The past five years (2019-2024) witnessed approximately xx M&A transactions in the anti-bot sector, signaling consolidation and expansion of market players. This is expected to continue, with larger players acquiring smaller, specialized firms.
Anti-Bot Solution Market Trends & Opportunities
The global Anti-Bot Solution market is experiencing substantial growth, driven by several key factors. The increasing sophistication of bot attacks, coupled with the rising volume of online transactions and the expanding digital landscape, creates a strong need for advanced bot mitigation solutions. The market is witnessing a significant shift towards AI-powered solutions, offering greater accuracy and adaptability compared to traditional rule-based systems. The market penetration rate for AI-powered anti-bot solutions is estimated at xx% in 2025, and is expected to reach xx% by 2033. This technology shift drives higher adoption rates, especially in sectors that are facing higher risks of sophisticated bot attacks. Consumer preferences are also influencing market trends, with a growing demand for solutions that are both effective and unobtrusive to legitimate users. Competitive dynamics are intense, with companies vying for market share through product innovation, strategic partnerships, and aggressive marketing. The market's future hinges on the ongoing arms race between bot developers and anti-bot solution providers.
Dominant Markets & Segments in Anti-Bot Solution
The North American region holds the dominant position in the Anti-Bot Solution market, followed by Europe and Asia-Pacific. This is primarily attributed to the high concentration of e-commerce businesses and advanced digital infrastructure in these regions. Within North America, the US holds the largest market share.
Key Growth Drivers:
- Robust Digital Infrastructure: Extensive internet penetration and advanced technology infrastructure support the growth of the market.
- Stringent Data Privacy Regulations: Compliance with regulations such as GDPR and CCPA drives the demand for anti-bot solutions.
- High Adoption of E-commerce: High online shopping penetration leads to increased vulnerability to bot-based fraud and thus increases the need for anti-bot solutions.
- Government Initiatives: Government support and awareness campaigns for cybersecurity are boosting market adoption.
The e-commerce segment accounts for a significant share of the market, followed by the financial services sector. This reflects the high vulnerability of these sectors to bot-based attacks, including fraudulent account creation and ticket scalping.
Anti-Bot Solution Product Analysis
The Anti-Bot Solution market offers a wide range of products, ranging from basic CAPTCHAs to sophisticated AI-powered solutions. Recent innovations focus on machine learning algorithms that identify and block bots based on behavioral patterns. These solutions adapt dynamically to new bot techniques and provide greater accuracy. Key competitive advantages lie in the accuracy and speed of bot detection, the ability to minimize false positives, and seamless integration with existing security infrastructures.
Key Drivers, Barriers & Challenges in Anti-Bot Solution
Key Drivers: The increasing sophistication and frequency of bot attacks, coupled with stricter data privacy regulations and heightened consumer awareness of online security, are driving rapid growth. Advancements in AI and machine learning are enabling more sophisticated and adaptive bot detection technologies. The expanding e-commerce and digital services landscape fuels increased demand for these solutions.
Challenges: The biggest challenge lies in the constant arms race between bot developers and anti-bot providers. Sophisticated bots continually evolve to bypass detection mechanisms, necessitating continuous innovation in anti-bot solutions. Balancing the need for robust security with minimizing disruption to legitimate users is a key challenge. Supply chain disruptions can affect the availability of components needed to build anti-bot solutions.
Growth Drivers in the Anti-Bot Solution Market
The market is primarily driven by the rising prevalence of sophisticated bot attacks targeting various industries. Increased regulations on data privacy and security, coupled with advancements in AI and machine learning algorithms, are fueling innovation and adoption. The expansion of e-commerce and the increasing reliance on digital platforms further amplify the need for robust anti-bot solutions.
Challenges Impacting Anti-Bot Solution Growth
Challenges include the continuous evolution of bot technologies, making it difficult to maintain high accuracy and effectiveness of anti-bot solutions. Balancing security with user experience remains a crucial challenge, and supply chain vulnerabilities can impact the availability of necessary components. High implementation costs and a lack of awareness among some businesses also hinder market growth.
Key Players Shaping the Anti-Bot Solution Market
- DataDome
- Distil Networks
- Akamai Technologies
- Webroot
- Oracle
- Radware
- Secucloud
- Imperva
- ClickGUARD
- Barracuda Networks
- HUMAN
- HUMAN Bot Defender
- Arkose Labs
- Cloudflare
- CHEQ Essentials
- Cequence Security
- AppTrana (Indusface)
- Reblaze Technologies
- F5 Distributed Cloud Bot Defense
Significant Anti-Bot Solution Industry Milestones
- 2020, Q4: DataDome launched its advanced behavioral biometrics engine.
- 2021, Q2: Distil Networks integrated its solution with a major e-commerce platform.
- 2022, Q1: Akamai Technologies released its next-generation bot management solution.
- 2023, Q3: Merger of two smaller anti-bot solution providers. (Specific companies not publicly available – xx and xx)
Future Outlook for Anti-Bot Solution Market
The Anti-Bot Solution market is poised for continued strong growth, driven by escalating cyber threats and the increasing reliance on digital platforms. Strategic opportunities lie in developing AI-powered solutions that offer superior accuracy and adaptability. Expanding into emerging markets and focusing on niche applications, such as preventing ticket scalping and protecting financial institutions from fraud, are key avenues for growth. The market's expansion will be fueled by technological advancements, enhanced regulatory frameworks and increasing investments in cybersecurity.
Anti-Bot Solution Segmentation
-
1. Application
- 1.1. SME
- 1.2. Large Enterprise
-
2. Types
- 2.1. Cloud-Based
- 2.2. On-Premise
Anti-Bot Solution Segmentation By Geography
-
1. North America
- 1.1. United States
- 1.2. Canada
- 1.3. Mexico
-
2. South America
- 2.1. Brazil
- 2.2. Argentina
- 2.3. Rest of South America
-
3. Europe
- 3.1. United Kingdom
- 3.2. Germany
- 3.3. France
- 3.4. Italy
- 3.5. Spain
- 3.6. Russia
- 3.7. Benelux
- 3.8. Nordics
- 3.9. Rest of Europe
-
4. Middle East & Africa
- 4.1. Turkey
- 4.2. Israel
- 4.3. GCC
- 4.4. North Africa
- 4.5. South Africa
- 4.6. Rest of Middle East & Africa
-
5. Asia Pacific
- 5.1. China
- 5.2. India
- 5.3. Japan
- 5.4. South Korea
- 5.5. ASEAN
- 5.6. Oceania
- 5.7. Rest of Asia Pacific
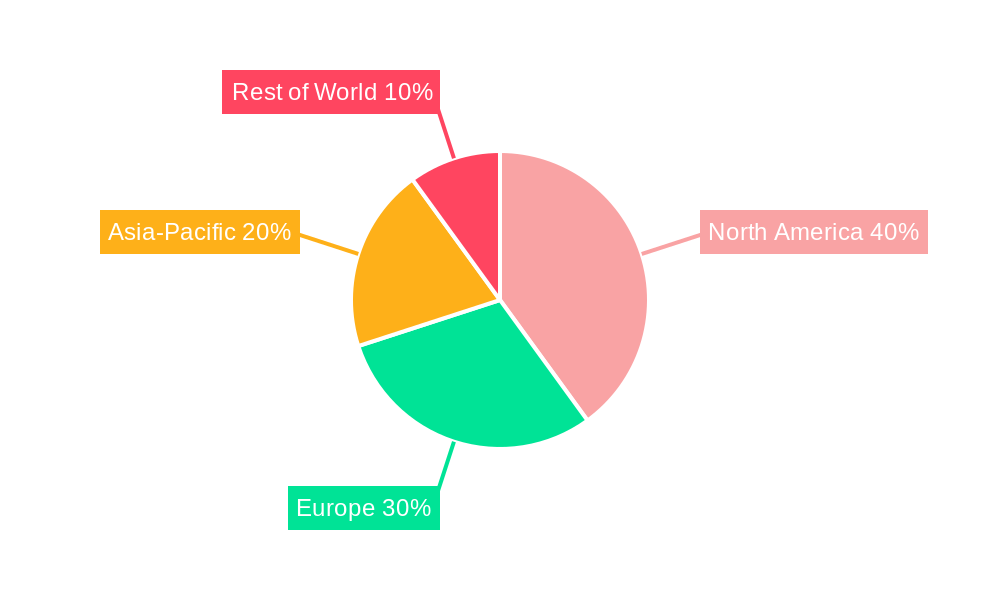
Anti-Bot Solution Regional Market Share
Geographic Coverage of Anti-Bot Solution
Anti-Bot Solution REPORT HIGHLIGHTS
| Aspects | Details |
|---|---|
| Study Period | 2020-2034 |
| Base Year | 2025 |
| Estimated Year | 2026 |
| Forecast Period | 2026-2034 |
| Historical Period | 2020-2025 |
| Growth Rate | CAGR of 10.36% from 2020-2034 |
| Segmentation |
|
Table of Contents
- 1. Introduction
- 1.1. Research Scope
- 1.2. Market Segmentation
- 1.3. Research Methodology
- 1.4. Definitions and Assumptions
- 2. Executive Summary
- 2.1. Introduction
- 3. Market Dynamics
- 3.1. Introduction
- 3.2. Market Drivers
- 3.3. Market Restrains
- 3.4. Market Trends
- 4. Market Factor Analysis
- 4.1. Porters Five Forces
- 4.2. Supply/Value Chain
- 4.3. PESTEL analysis
- 4.4. Market Entropy
- 4.5. Patent/Trademark Analysis
- 5. Global Anti-Bot Solution Analysis, Insights and Forecast, 2020-2032
- 5.1. Market Analysis, Insights and Forecast - by Application
- 5.1.1. SME
- 5.1.2. Large Enterprise
- 5.2. Market Analysis, Insights and Forecast - by Types
- 5.2.1. Cloud-Based
- 5.2.2. On-Premise
- 5.3. Market Analysis, Insights and Forecast - by Region
- 5.3.1. North America
- 5.3.2. South America
- 5.3.3. Europe
- 5.3.4. Middle East & Africa
- 5.3.5. Asia Pacific
- 5.1. Market Analysis, Insights and Forecast - by Application
- 6. North America Anti-Bot Solution Analysis, Insights and Forecast, 2020-2032
- 6.1. Market Analysis, Insights and Forecast - by Application
- 6.1.1. SME
- 6.1.2. Large Enterprise
- 6.2. Market Analysis, Insights and Forecast - by Types
- 6.2.1. Cloud-Based
- 6.2.2. On-Premise
- 6.1. Market Analysis, Insights and Forecast - by Application
- 7. South America Anti-Bot Solution Analysis, Insights and Forecast, 2020-2032
- 7.1. Market Analysis, Insights and Forecast - by Application
- 7.1.1. SME
- 7.1.2. Large Enterprise
- 7.2. Market Analysis, Insights and Forecast - by Types
- 7.2.1. Cloud-Based
- 7.2.2. On-Premise
- 7.1. Market Analysis, Insights and Forecast - by Application
- 8. Europe Anti-Bot Solution Analysis, Insights and Forecast, 2020-2032
- 8.1. Market Analysis, Insights and Forecast - by Application
- 8.1.1. SME
- 8.1.2. Large Enterprise
- 8.2. Market Analysis, Insights and Forecast - by Types
- 8.2.1. Cloud-Based
- 8.2.2. On-Premise
- 8.1. Market Analysis, Insights and Forecast - by Application
- 9. Middle East & Africa Anti-Bot Solution Analysis, Insights and Forecast, 2020-2032
- 9.1. Market Analysis, Insights and Forecast - by Application
- 9.1.1. SME
- 9.1.2. Large Enterprise
- 9.2. Market Analysis, Insights and Forecast - by Types
- 9.2.1. Cloud-Based
- 9.2.2. On-Premise
- 9.1. Market Analysis, Insights and Forecast - by Application
- 10. Asia Pacific Anti-Bot Solution Analysis, Insights and Forecast, 2020-2032
- 10.1. Market Analysis, Insights and Forecast - by Application
- 10.1.1. SME
- 10.1.2. Large Enterprise
- 10.2. Market Analysis, Insights and Forecast - by Types
- 10.2.1. Cloud-Based
- 10.2.2. On-Premise
- 10.1. Market Analysis, Insights and Forecast - by Application
- 11. Competitive Analysis
- 11.1. Global Market Share Analysis 2025
- 11.2. Company Profiles
- 11.2.1 DataDome
- 11.2.1.1. Overview
- 11.2.1.2. Products
- 11.2.1.3. SWOT Analysis
- 11.2.1.4. Recent Developments
- 11.2.1.5. Financials (Based on Availability)
- 11.2.2 Distil Networks
- 11.2.2.1. Overview
- 11.2.2.2. Products
- 11.2.2.3. SWOT Analysis
- 11.2.2.4. Recent Developments
- 11.2.2.5. Financials (Based on Availability)
- 11.2.3 Akamai Technologies
- 11.2.3.1. Overview
- 11.2.3.2. Products
- 11.2.3.3. SWOT Analysis
- 11.2.3.4. Recent Developments
- 11.2.3.5. Financials (Based on Availability)
- 11.2.4 Webroot
- 11.2.4.1. Overview
- 11.2.4.2. Products
- 11.2.4.3. SWOT Analysis
- 11.2.4.4. Recent Developments
- 11.2.4.5. Financials (Based on Availability)
- 11.2.5 Oracle
- 11.2.5.1. Overview
- 11.2.5.2. Products
- 11.2.5.3. SWOT Analysis
- 11.2.5.4. Recent Developments
- 11.2.5.5. Financials (Based on Availability)
- 11.2.6 Radware
- 11.2.6.1. Overview
- 11.2.6.2. Products
- 11.2.6.3. SWOT Analysis
- 11.2.6.4. Recent Developments
- 11.2.6.5. Financials (Based on Availability)
- 11.2.7 Secucloud
- 11.2.7.1. Overview
- 11.2.7.2. Products
- 11.2.7.3. SWOT Analysis
- 11.2.7.4. Recent Developments
- 11.2.7.5. Financials (Based on Availability)
- 11.2.8 Imperva
- 11.2.8.1. Overview
- 11.2.8.2. Products
- 11.2.8.3. SWOT Analysis
- 11.2.8.4. Recent Developments
- 11.2.8.5. Financials (Based on Availability)
- 11.2.9 ClickGUARD
- 11.2.9.1. Overview
- 11.2.9.2. Products
- 11.2.9.3. SWOT Analysis
- 11.2.9.4. Recent Developments
- 11.2.9.5. Financials (Based on Availability)
- 11.2.10 Barracuda Networks
- 11.2.10.1. Overview
- 11.2.10.2. Products
- 11.2.10.3. SWOT Analysis
- 11.2.10.4. Recent Developments
- 11.2.10.5. Financials (Based on Availability)
- 11.2.11 HUMAN
- 11.2.11.1. Overview
- 11.2.11.2. Products
- 11.2.11.3. SWOT Analysis
- 11.2.11.4. Recent Developments
- 11.2.11.5. Financials (Based on Availability)
- 11.2.12 HUMAN Bot Defender
- 11.2.12.1. Overview
- 11.2.12.2. Products
- 11.2.12.3. SWOT Analysis
- 11.2.12.4. Recent Developments
- 11.2.12.5. Financials (Based on Availability)
- 11.2.13 Arkose Labs
- 11.2.13.1. Overview
- 11.2.13.2. Products
- 11.2.13.3. SWOT Analysis
- 11.2.13.4. Recent Developments
- 11.2.13.5. Financials (Based on Availability)
- 11.2.14 Cloudflare
- 11.2.14.1. Overview
- 11.2.14.2. Products
- 11.2.14.3. SWOT Analysis
- 11.2.14.4. Recent Developments
- 11.2.14.5. Financials (Based on Availability)
- 11.2.15 CHEQ Essentials
- 11.2.15.1. Overview
- 11.2.15.2. Products
- 11.2.15.3. SWOT Analysis
- 11.2.15.4. Recent Developments
- 11.2.15.5. Financials (Based on Availability)
- 11.2.16 Cequence Security
- 11.2.16.1. Overview
- 11.2.16.2. Products
- 11.2.16.3. SWOT Analysis
- 11.2.16.4. Recent Developments
- 11.2.16.5. Financials (Based on Availability)
- 11.2.17 AppTrana (Indusface)
- 11.2.17.1. Overview
- 11.2.17.2. Products
- 11.2.17.3. SWOT Analysis
- 11.2.17.4. Recent Developments
- 11.2.17.5. Financials (Based on Availability)
- 11.2.18 Reblaze Technologies
- 11.2.18.1. Overview
- 11.2.18.2. Products
- 11.2.18.3. SWOT Analysis
- 11.2.18.4. Recent Developments
- 11.2.18.5. Financials (Based on Availability)
- 11.2.19 F5 Distributed Cloud Bot Defense
- 11.2.19.1. Overview
- 11.2.19.2. Products
- 11.2.19.3. SWOT Analysis
- 11.2.19.4. Recent Developments
- 11.2.19.5. Financials (Based on Availability)
- 11.2.1 DataDome
List of Figures
- Figure 1: Global Anti-Bot Solution Revenue Breakdown (undefined, %) by Region 2025 & 2033
- Figure 2: North America Anti-Bot Solution Revenue (undefined), by Application 2025 & 2033
- Figure 3: North America Anti-Bot Solution Revenue Share (%), by Application 2025 & 2033
- Figure 4: North America Anti-Bot Solution Revenue (undefined), by Types 2025 & 2033
- Figure 5: North America Anti-Bot Solution Revenue Share (%), by Types 2025 & 2033
- Figure 6: North America Anti-Bot Solution Revenue (undefined), by Country 2025 & 2033
- Figure 7: North America Anti-Bot Solution Revenue Share (%), by Country 2025 & 2033
- Figure 8: South America Anti-Bot Solution Revenue (undefined), by Application 2025 & 2033
- Figure 9: South America Anti-Bot Solution Revenue Share (%), by Application 2025 & 2033
- Figure 10: South America Anti-Bot Solution Revenue (undefined), by Types 2025 & 2033
- Figure 11: South America Anti-Bot Solution Revenue Share (%), by Types 2025 & 2033
- Figure 12: South America Anti-Bot Solution Revenue (undefined), by Country 2025 & 2033
- Figure 13: South America Anti-Bot Solution Revenue Share (%), by Country 2025 & 2033
- Figure 14: Europe Anti-Bot Solution Revenue (undefined), by Application 2025 & 2033
- Figure 15: Europe Anti-Bot Solution Revenue Share (%), by Application 2025 & 2033
- Figure 16: Europe Anti-Bot Solution Revenue (undefined), by Types 2025 & 2033
- Figure 17: Europe Anti-Bot Solution Revenue Share (%), by Types 2025 & 2033
- Figure 18: Europe Anti-Bot Solution Revenue (undefined), by Country 2025 & 2033
- Figure 19: Europe Anti-Bot Solution Revenue Share (%), by Country 2025 & 2033
- Figure 20: Middle East & Africa Anti-Bot Solution Revenue (undefined), by Application 2025 & 2033
- Figure 21: Middle East & Africa Anti-Bot Solution Revenue Share (%), by Application 2025 & 2033
- Figure 22: Middle East & Africa Anti-Bot Solution Revenue (undefined), by Types 2025 & 2033
- Figure 23: Middle East & Africa Anti-Bot Solution Revenue Share (%), by Types 2025 & 2033
- Figure 24: Middle East & Africa Anti-Bot Solution Revenue (undefined), by Country 2025 & 2033
- Figure 25: Middle East & Africa Anti-Bot Solution Revenue Share (%), by Country 2025 & 2033
- Figure 26: Asia Pacific Anti-Bot Solution Revenue (undefined), by Application 2025 & 2033
- Figure 27: Asia Pacific Anti-Bot Solution Revenue Share (%), by Application 2025 & 2033
- Figure 28: Asia Pacific Anti-Bot Solution Revenue (undefined), by Types 2025 & 2033
- Figure 29: Asia Pacific Anti-Bot Solution Revenue Share (%), by Types 2025 & 2033
- Figure 30: Asia Pacific Anti-Bot Solution Revenue (undefined), by Country 2025 & 2033
- Figure 31: Asia Pacific Anti-Bot Solution Revenue Share (%), by Country 2025 & 2033
List of Tables
- Table 1: Global Anti-Bot Solution Revenue undefined Forecast, by Application 2020 & 2033
- Table 2: Global Anti-Bot Solution Revenue undefined Forecast, by Types 2020 & 2033
- Table 3: Global Anti-Bot Solution Revenue undefined Forecast, by Region 2020 & 2033
- Table 4: Global Anti-Bot Solution Revenue undefined Forecast, by Application 2020 & 2033
- Table 5: Global Anti-Bot Solution Revenue undefined Forecast, by Types 2020 & 2033
- Table 6: Global Anti-Bot Solution Revenue undefined Forecast, by Country 2020 & 2033
- Table 7: United States Anti-Bot Solution Revenue (undefined) Forecast, by Application 2020 & 2033
- Table 8: Canada Anti-Bot Solution Revenue (undefined) Forecast, by Application 2020 & 2033
- Table 9: Mexico Anti-Bot Solution Revenue (undefined) Forecast, by Application 2020 & 2033
- Table 10: Global Anti-Bot Solution Revenue undefined Forecast, by Application 2020 & 2033
- Table 11: Global Anti-Bot Solution Revenue undefined Forecast, by Types 2020 & 2033
- Table 12: Global Anti-Bot Solution Revenue undefined Forecast, by Country 2020 & 2033
- Table 13: Brazil Anti-Bot Solution Revenue (undefined) Forecast, by Application 2020 & 2033
- Table 14: Argentina Anti-Bot Solution Revenue (undefined) Forecast, by Application 2020 & 2033
- Table 15: Rest of South America Anti-Bot Solution Revenue (undefined) Forecast, by Application 2020 & 2033
- Table 16: Global Anti-Bot Solution Revenue undefined Forecast, by Application 2020 & 2033
- Table 17: Global Anti-Bot Solution Revenue undefined Forecast, by Types 2020 & 2033
- Table 18: Global Anti-Bot Solution Revenue undefined Forecast, by Country 2020 & 2033
- Table 19: United Kingdom Anti-Bot Solution Revenue (undefined) Forecast, by Application 2020 & 2033
- Table 20: Germany Anti-Bot Solution Revenue (undefined) Forecast, by Application 2020 & 2033
- Table 21: France Anti-Bot Solution Revenue (undefined) Forecast, by Application 2020 & 2033
- Table 22: Italy Anti-Bot Solution Revenue (undefined) Forecast, by Application 2020 & 2033
- Table 23: Spain Anti-Bot Solution Revenue (undefined) Forecast, by Application 2020 & 2033
- Table 24: Russia Anti-Bot Solution Revenue (undefined) Forecast, by Application 2020 & 2033
- Table 25: Benelux Anti-Bot Solution Revenue (undefined) Forecast, by Application 2020 & 2033
- Table 26: Nordics Anti-Bot Solution Revenue (undefined) Forecast, by Application 2020 & 2033
- Table 27: Rest of Europe Anti-Bot Solution Revenue (undefined) Forecast, by Application 2020 & 2033
- Table 28: Global Anti-Bot Solution Revenue undefined Forecast, by Application 2020 & 2033
- Table 29: Global Anti-Bot Solution Revenue undefined Forecast, by Types 2020 & 2033
- Table 30: Global Anti-Bot Solution Revenue undefined Forecast, by Country 2020 & 2033
- Table 31: Turkey Anti-Bot Solution Revenue (undefined) Forecast, by Application 2020 & 2033
- Table 32: Israel Anti-Bot Solution Revenue (undefined) Forecast, by Application 2020 & 2033
- Table 33: GCC Anti-Bot Solution Revenue (undefined) Forecast, by Application 2020 & 2033
- Table 34: North Africa Anti-Bot Solution Revenue (undefined) Forecast, by Application 2020 & 2033
- Table 35: South Africa Anti-Bot Solution Revenue (undefined) Forecast, by Application 2020 & 2033
- Table 36: Rest of Middle East & Africa Anti-Bot Solution Revenue (undefined) Forecast, by Application 2020 & 2033
- Table 37: Global Anti-Bot Solution Revenue undefined Forecast, by Application 2020 & 2033
- Table 38: Global Anti-Bot Solution Revenue undefined Forecast, by Types 2020 & 2033
- Table 39: Global Anti-Bot Solution Revenue undefined Forecast, by Country 2020 & 2033
- Table 40: China Anti-Bot Solution Revenue (undefined) Forecast, by Application 2020 & 2033
- Table 41: India Anti-Bot Solution Revenue (undefined) Forecast, by Application 2020 & 2033
- Table 42: Japan Anti-Bot Solution Revenue (undefined) Forecast, by Application 2020 & 2033
- Table 43: South Korea Anti-Bot Solution Revenue (undefined) Forecast, by Application 2020 & 2033
- Table 44: ASEAN Anti-Bot Solution Revenue (undefined) Forecast, by Application 2020 & 2033
- Table 45: Oceania Anti-Bot Solution Revenue (undefined) Forecast, by Application 2020 & 2033
- Table 46: Rest of Asia Pacific Anti-Bot Solution Revenue (undefined) Forecast, by Application 2020 & 2033
Frequently Asked Questions
1. What is the projected Compound Annual Growth Rate (CAGR) of the Anti-Bot Solution?
The projected CAGR is approximately 10.36%.
2. Which companies are prominent players in the Anti-Bot Solution?
Key companies in the market include DataDome, Distil Networks, Akamai Technologies, Webroot, Oracle, Radware, Secucloud, Imperva, ClickGUARD, Barracuda Networks, HUMAN, HUMAN Bot Defender, Arkose Labs, Cloudflare, CHEQ Essentials, Cequence Security, AppTrana (Indusface), Reblaze Technologies, F5 Distributed Cloud Bot Defense.
3. What are the main segments of the Anti-Bot Solution?
The market segments include Application, Types.
4. Can you provide details about the market size?
The market size is estimated to be USD XXX N/A as of 2022.
5. What are some drivers contributing to market growth?
N/A
6. What are the notable trends driving market growth?
N/A
7. Are there any restraints impacting market growth?
N/A
8. Can you provide examples of recent developments in the market?
N/A
9. What pricing options are available for accessing the report?
Pricing options include single-user, multi-user, and enterprise licenses priced at USD 3950.00, USD 5925.00, and USD 7900.00 respectively.
10. Is the market size provided in terms of value or volume?
The market size is provided in terms of value, measured in N/A.
11. Are there any specific market keywords associated with the report?
Yes, the market keyword associated with the report is "Anti-Bot Solution," which aids in identifying and referencing the specific market segment covered.
12. How do I determine which pricing option suits my needs best?
The pricing options vary based on user requirements and access needs. Individual users may opt for single-user licenses, while businesses requiring broader access may choose multi-user or enterprise licenses for cost-effective access to the report.
13. Are there any additional resources or data provided in the Anti-Bot Solution report?
While the report offers comprehensive insights, it's advisable to review the specific contents or supplementary materials provided to ascertain if additional resources or data are available.
14. How can I stay updated on further developments or reports in the Anti-Bot Solution?
To stay informed about further developments, trends, and reports in the Anti-Bot Solution, consider subscribing to industry newsletters, following relevant companies and organizations, or regularly checking reputable industry news sources and publications.
Methodology
Step 1 - Identification of Relevant Samples Size from Population Database


Step 2 - Approaches for Defining Global Market Size (Value, Volume* & Price*)

Note*: In applicable scenarios
Step 3 - Data Sources
Primary Research
- Web Analytics
- Survey Reports
- Research Institute
- Latest Research Reports
- Opinion Leaders
Secondary Research
- Annual Reports
- White Paper
- Latest Press Release
- Industry Association
- Paid Database
- Investor Presentations

Step 4 - Data Triangulation
Involves using different sources of information in order to increase the validity of a study
These sources are likely to be stakeholders in a program - participants, other researchers, program staff, other community members, and so on.
Then we put all data in single framework & apply various statistical tools to find out the dynamic on the market.
During the analysis stage, feedback from the stakeholder groups would be compared to determine areas of agreement as well as areas of divergence