

Key Insights
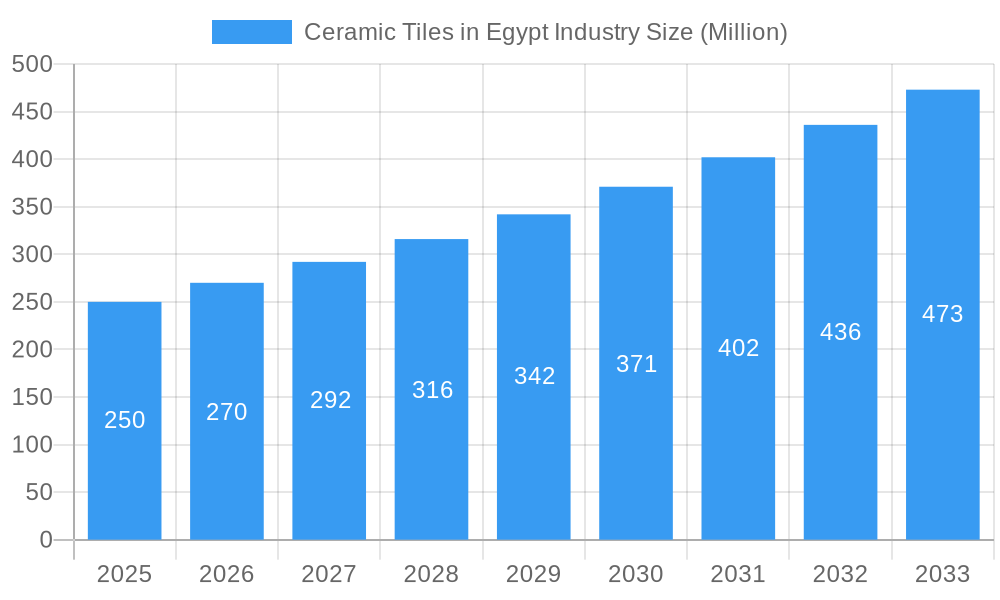
Egypt's ceramic tile market, valued at $1.5 billion in the base year of 2024, is poised for significant expansion, projected to grow at a compound annual growth rate (CAGR) of 8.3%. This robust growth is propelled by a thriving construction sector, encompassing both residential and commercial developments, further amplified by Egypt's ongoing urbanization and population increase. Rising disposable incomes are driving demand for home enhancement and renovation, creating a strong appetite for premium ceramic tile solutions. Moreover, a growing emphasis on aesthetic appeal and durability in interior design fuels the demand for advanced products such as glazed and scratch-resistant tiles. Potential challenges include fluctuations in raw material costs and economic volatility, yet the optimistic construction outlook and increasing consumer preference for ceramic tiles ensure sustained market growth.
Ceramic Tiles in Egypt Industry Market Size (In Billion)
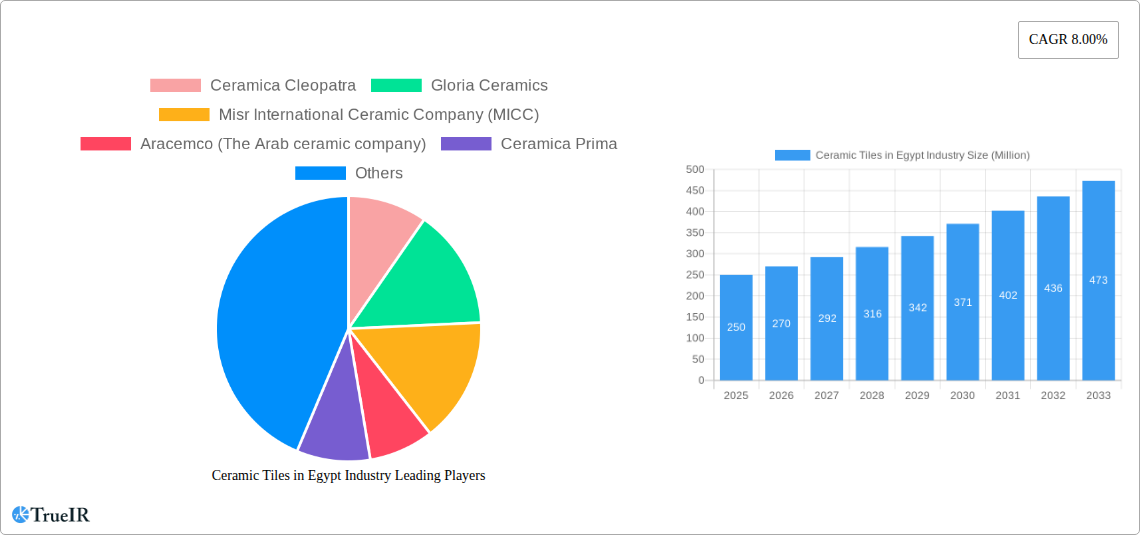
Market segmentation highlights a diverse product landscape. Glazed and porcelain tiles lead due to their superior aesthetics and durability. Floor tiles command a larger share than wall tiles, reflecting their extensive application in residential and commercial settings. New construction remains a primary demand driver, complemented by strong renovation and replacement activities, particularly in the residential segment. Key industry players include Ceramica Cleopatra, Gloria Ceramics, and Misr International Ceramic Company (MICC), distinguished by their unique branding and product offerings. The competitive arena is characterized by strategic investments in product innovation and distribution network expansion. While the market's primary focus is Egypt, opportunities for international expansion exist. The historical period (2019-2024) likely mirrored these growth trajectories, establishing a strong foundation for future projections. Continued infrastructure development in Egypt is expected to further stimulate the ceramic tile industry.
Ceramic Tiles in Egypt Industry Company Market Share
Egypt's Ceramic Tiles Industry: A Comprehensive Market Report (2019-2033)
This dynamic report provides a detailed analysis of Egypt's burgeoning ceramic tiles industry, offering invaluable insights for investors, manufacturers, and industry professionals. Leveraging extensive market research and data analysis covering the period 2019-2033, with a focus on 2025, this report dissects market structure, competitive dynamics, key trends, and future growth potential. Expect precise data, insightful commentary, and actionable strategies to navigate this thriving sector. The Egyptian ceramic tiles market, valued at xx Million USD in 2025, is projected to experience significant growth, reaching xx Million USD by 2033.
Ceramic Tiles in Egypt Industry Market Structure & Competitive Landscape
Egypt's ceramic tile industry exhibits a moderately concentrated market structure. Key players like Ceramica Cleopatra, Gloria Ceramics, and Misr International Ceramic Company (MICC) hold significant market share, while numerous smaller players contribute to the overall volume. The Herfindahl-Hirschman Index (HHI) for 2025 is estimated at xx, suggesting a moderately competitive environment. Innovation is driven by the demand for aesthetically pleasing, durable, and technologically advanced tiles, leading to increased investment in R&D. Regulatory changes related to building codes and environmental standards influence manufacturing processes and product offerings. Substitutes, such as vinyl flooring and other types of surfacing materials, exert moderate competitive pressure. The end-user segmentation is primarily driven by residential construction (xx%), followed by commercial (xx%) and industrial sectors (xx%). M&A activity has been moderate over the past few years, with xx Million USD in transactions recorded between 2019 and 2024.
- Market Concentration: Moderately concentrated, with a few major players dominating.
- Innovation Drivers: Demand for high-quality, technologically advanced, and aesthetically appealing tiles.
- Regulatory Impacts: Building codes and environmental regulations influence manufacturing and product design.
- Product Substitutes: Vinyl flooring and other materials pose moderate competitive pressure.
- End-User Segmentation: Primarily residential, with significant contributions from commercial and industrial segments.
- M&A Trends: Moderate activity in recent years, with a total transaction value of xx Million USD between 2019 and 2024.
Ceramic Tiles in Egypt Industry Market Trends & Opportunities
The Egyptian ceramic tile market is experiencing robust growth, fueled by a thriving construction sector and increasing disposable incomes. The market size is expected to register a Compound Annual Growth Rate (CAGR) of xx% during the forecast period (2025-2033). Technological advancements, such as the adoption of digital printing techniques and the introduction of innovative materials like scratch-free tiles, are shaping consumer preferences. Growing demand for sustainable and eco-friendly products is creating new opportunities. Competitive dynamics are characterized by ongoing product differentiation, strategic pricing, and brand-building initiatives. Market penetration rate for glazed tiles is currently at xx%, while porcelain tiles stand at xx%. The rising trend of home renovations further contributes to market growth.
Dominant Markets & Segments in Ceramic Tiles in Egypt Industry
The residential segment remains the dominant end-user market for ceramic tiles in Egypt, accounting for the majority of consumption. Within product segments, glazed tiles enjoy the largest market share, driven by their affordability and aesthetic versatility. The demand for floor tiles surpasses that of wall tiles, largely due to their utility in larger areas. New construction projects constitute a significant driver of demand, exceeding that of the replacement and renovation sector.
- Key Growth Drivers:
- Strong growth in the construction sector, particularly in residential developments.
- Increasing disposable incomes among consumers, enabling greater spending on home improvements.
- Government initiatives supporting infrastructure development and housing projects.
- Dominant Segments:
- Product: Glazed tiles
- Application: Floor tiles
- Construction Type: New Construction
- End User: Residential
Ceramic Tiles in Egypt Industry Product Analysis
The Egyptian ceramic tile industry showcases a diverse range of products, including glazed, porcelain, scratch-free, and other specialized tiles. Technological advancements focus on improving durability, aesthetics, and ease of maintenance. Digital printing enables complex designs and high-quality finishes. The market is witnessing growing demand for scratch-free and large-format tiles, reflecting a shift towards high-end products. Product innovation is primarily driven by the need to meet diverse consumer preferences and enhance product value propositions.
Key Drivers, Barriers & Challenges in Ceramic Tiles in Egypt Industry
Key Drivers:
- The expanding construction industry, particularly residential building projects.
- Rising disposable incomes and increasing urbanization.
- Government initiatives aimed at infrastructure development.
- The introduction of innovative products and technologically advanced manufacturing processes.
Key Challenges:
- Fluctuations in raw material prices, particularly energy costs.
- Intense competition among domestic and international players.
- Regulatory hurdles and bureaucratic complexities.
- Supply chain disruptions and logistics challenges.
Growth Drivers in the Ceramic Tiles in Egypt Industry Market
The Egyptian ceramic tile market's growth is significantly driven by a robust construction sector, particularly in residential and commercial buildings. Moreover, increasing disposable incomes and a preference for aesthetically pleasing homes are boosting demand. Government support for infrastructure projects further adds to market expansion. Technological innovation, evident in the production of high-quality, durable tiles, contributes to market expansion.
Challenges Impacting Ceramic Tiles in Egypt Industry Growth
Key challenges for the Egyptian ceramic tile industry include managing fluctuating raw material costs and supply chain vulnerabilities. Intense competition and regulatory uncertainties are major concerns. Ensuring environmental sustainability is another challenge requiring ongoing attention. These factors can impact profitability and hinder sustainable growth.
Key Players Shaping the Ceramic Tiles in Egypt Industry Market
- Ceramica Cleopatra
- Gloria Ceramics
- Misr International Ceramic Company (MICC)
- Aracemco (The Arab ceramic company)
- Ceramica Prima
- Ceramica Venzia
- Lecico Egypt
- Al-Ezz Ceramics and Porcelain (Gemma)
- Al Amir Ceramics
- Alfa Ceramic
- Royal Ceramica
- Pharaohs Ceramics Group (Ceramica Innova)
Significant Ceramic Tiles in Egypt Industry Industry Milestones
- 2020: Introduction of a new line of eco-friendly tiles by Ceramica Cleopatra.
- 2021: Aracemco invests in a new, state-of-the-art manufacturing facility.
- 2022: Merger of two smaller tile manufacturers resulting in increased market share for the combined entity.
- 2023: Lecico Egypt launches a new line of large-format tiles targeting high-end market segments.
Future Outlook for Ceramic Tiles in Egypt Industry Market
The Egyptian ceramic tile market is poised for sustained growth over the forecast period, driven by continuous construction activity and evolving consumer preferences. Strategic investments in advanced technology, product diversification, and sustainable manufacturing practices will be crucial for success. The market presents substantial opportunities for manufacturers who can effectively cater to the growing demand for high-quality, durable, and aesthetically pleasing tiles while addressing environmental concerns.
Ceramic Tiles in Egypt Industry Segmentation
-
1. Product
- 1.1. Glazed
- 1.2. Porcelain
- 1.3. Scratch Free
- 1.4. Other Products
-
2. Application
- 2.1. Floor Tiles
- 2.2. Wall Tiles
- 2.3. Other Applications
-
3. Construction Type
- 3.1. New Construction
- 3.2. Replacement and Renovation
-
4. End User
- 4.1. Residential
- 4.2. Commercial
Ceramic Tiles in Egypt Industry Segmentation By Geography
-
1. North America
- 1.1. United States
- 1.2. Canada
- 1.3. Mexico
-
2. South America
- 2.1. Brazil
- 2.2. Argentina
- 2.3. Rest of South America
-
3. Europe
- 3.1. United Kingdom
- 3.2. Germany
- 3.3. France
- 3.4. Italy
- 3.5. Spain
- 3.6. Russia
- 3.7. Benelux
- 3.8. Nordics
- 3.9. Rest of Europe
-
4. Middle East & Africa
- 4.1. Turkey
- 4.2. Israel
- 4.3. GCC
- 4.4. North Africa
- 4.5. South Africa
- 4.6. Rest of Middle East & Africa
-
5. Asia Pacific
- 5.1. China
- 5.2. India
- 5.3. Japan
- 5.4. South Korea
- 5.5. ASEAN
- 5.6. Oceania
- 5.7. Rest of Asia Pacific
Ceramic Tiles in Egypt Industry Regional Market Share
Geographic Coverage of Ceramic Tiles in Egypt Industry
Ceramic Tiles in Egypt Industry REPORT HIGHLIGHTS
| Aspects | Details |
|---|---|
| Study Period | 2020-2034 |
| Base Year | 2025 |
| Estimated Year | 2026 |
| Forecast Period | 2026-2034 |
| Historical Period | 2020-2025 |
| Growth Rate | CAGR of 8.3% from 2020-2034 |
| Segmentation |
|
Table of Contents
- 1. Introduction
- 1.1. Research Scope
- 1.2. Market Segmentation
- 1.3. Research Objective
- 1.4. Definitions and Assumptions
- 2. Executive Summary
- 2.1. Market Snapshot
- 3. Market Dynamics
- 3.1. Market Drivers
- 3.2. Market Restrains
- 3.3. Market Trends
- 3.4. Market Opportunities
- 4. Market Factor Analysis
- 4.1. Porters Five Forces
- 4.1.1. Bargaining Power of Suppliers
- 4.1.2. Bargaining Power of Buyers
- 4.1.3. Threat of New Entrants
- 4.1.4. Threat of Substitutes
- 4.1.5. Competitive Rivalry
- 4.2. PESTEL analysis
- 4.3. BCG Analysis
- 4.3.1. Stars (High Growth, High Market Share)
- 4.3.2. Cash Cows (Low Growth, High Market Share)
- 4.3.3. Question Mark (High Growth, Low Market Share)
- 4.3.4. Dogs (Low Growth, Low Market Share)
- 4.4. Ansoff Matrix Analysis
- 4.5. Supply Chain Analysis
- 4.6. Regulatory Landscape
- 4.7. Current Market Potential and Opportunity Assessment (TAM–SAM–SOM Framework)
- 4.8. TIR Analyst Note
- 4.1. Porters Five Forces
- 5. Market Analysis, Insights and Forecast 2021-2033
- 5.1. Market Analysis, Insights and Forecast - by Product
- 5.1.1. Glazed
- 5.1.2. Porcelain
- 5.1.3. Scratch Free
- 5.1.4. Other Products
- 5.2. Market Analysis, Insights and Forecast - by Application
- 5.2.1. Floor Tiles
- 5.2.2. Wall Tiles
- 5.2.3. Other Applications
- 5.3. Market Analysis, Insights and Forecast - by Construction Type
- 5.3.1. New Construction
- 5.3.2. Replacement and Renovation
- 5.4. Market Analysis, Insights and Forecast - by End User
- 5.4.1. Residential
- 5.4.2. Commercial
- 5.5. Market Analysis, Insights and Forecast - by Region
- 5.5.1. North America
- 5.5.2. South America
- 5.5.3. Europe
- 5.5.4. Middle East & Africa
- 5.5.5. Asia Pacific
- 5.1. Market Analysis, Insights and Forecast - by Product
- 6. Global Ceramic Tiles in Egypt Industry Analysis, Insights and Forecast, 2021-2033
- 6.1. Market Analysis, Insights and Forecast - by Product
- 6.1.1. Glazed
- 6.1.2. Porcelain
- 6.1.3. Scratch Free
- 6.1.4. Other Products
- 6.2. Market Analysis, Insights and Forecast - by Application
- 6.2.1. Floor Tiles
- 6.2.2. Wall Tiles
- 6.2.3. Other Applications
- 6.3. Market Analysis, Insights and Forecast - by Construction Type
- 6.3.1. New Construction
- 6.3.2. Replacement and Renovation
- 6.4. Market Analysis, Insights and Forecast - by End User
- 6.4.1. Residential
- 6.4.2. Commercial
- 6.1. Market Analysis, Insights and Forecast - by Product
- 7. North America Ceramic Tiles in Egypt Industry Analysis, Insights and Forecast, 2020-2032
- 7.1. Market Analysis, Insights and Forecast - by Product
- 7.1.1. Glazed
- 7.1.2. Porcelain
- 7.1.3. Scratch Free
- 7.1.4. Other Products
- 7.2. Market Analysis, Insights and Forecast - by Application
- 7.2.1. Floor Tiles
- 7.2.2. Wall Tiles
- 7.2.3. Other Applications
- 7.3. Market Analysis, Insights and Forecast - by Construction Type
- 7.3.1. New Construction
- 7.3.2. Replacement and Renovation
- 7.4. Market Analysis, Insights and Forecast - by End User
- 7.4.1. Residential
- 7.4.2. Commercial
- 7.1. Market Analysis, Insights and Forecast - by Product
- 8. South America Ceramic Tiles in Egypt Industry Analysis, Insights and Forecast, 2020-2032
- 8.1. Market Analysis, Insights and Forecast - by Product
- 8.1.1. Glazed
- 8.1.2. Porcelain
- 8.1.3. Scratch Free
- 8.1.4. Other Products
- 8.2. Market Analysis, Insights and Forecast - by Application
- 8.2.1. Floor Tiles
- 8.2.2. Wall Tiles
- 8.2.3. Other Applications
- 8.3. Market Analysis, Insights and Forecast - by Construction Type
- 8.3.1. New Construction
- 8.3.2. Replacement and Renovation
- 8.4. Market Analysis, Insights and Forecast - by End User
- 8.4.1. Residential
- 8.4.2. Commercial
- 8.1. Market Analysis, Insights and Forecast - by Product
- 9. Europe Ceramic Tiles in Egypt Industry Analysis, Insights and Forecast, 2020-2032
- 9.1. Market Analysis, Insights and Forecast - by Product
- 9.1.1. Glazed
- 9.1.2. Porcelain
- 9.1.3. Scratch Free
- 9.1.4. Other Products
- 9.2. Market Analysis, Insights and Forecast - by Application
- 9.2.1. Floor Tiles
- 9.2.2. Wall Tiles
- 9.2.3. Other Applications
- 9.3. Market Analysis, Insights and Forecast - by Construction Type
- 9.3.1. New Construction
- 9.3.2. Replacement and Renovation
- 9.4. Market Analysis, Insights and Forecast - by End User
- 9.4.1. Residential
- 9.4.2. Commercial
- 9.1. Market Analysis, Insights and Forecast - by Product
- 10. Middle East & Africa Ceramic Tiles in Egypt Industry Analysis, Insights and Forecast, 2020-2032
- 10.1. Market Analysis, Insights and Forecast - by Product
- 10.1.1. Glazed
- 10.1.2. Porcelain
- 10.1.3. Scratch Free
- 10.1.4. Other Products
- 10.2. Market Analysis, Insights and Forecast - by Application
- 10.2.1. Floor Tiles
- 10.2.2. Wall Tiles
- 10.2.3. Other Applications
- 10.3. Market Analysis, Insights and Forecast - by Construction Type
- 10.3.1. New Construction
- 10.3.2. Replacement and Renovation
- 10.4. Market Analysis, Insights and Forecast - by End User
- 10.4.1. Residential
- 10.4.2. Commercial
- 10.1. Market Analysis, Insights and Forecast - by Product
- 11. Asia Pacific Ceramic Tiles in Egypt Industry Analysis, Insights and Forecast, 2020-2032
- 11.1. Market Analysis, Insights and Forecast - by Product
- 11.1.1. Glazed
- 11.1.2. Porcelain
- 11.1.3. Scratch Free
- 11.1.4. Other Products
- 11.2. Market Analysis, Insights and Forecast - by Application
- 11.2.1. Floor Tiles
- 11.2.2. Wall Tiles
- 11.2.3. Other Applications
- 11.3. Market Analysis, Insights and Forecast - by Construction Type
- 11.3.1. New Construction
- 11.3.2. Replacement and Renovation
- 11.4. Market Analysis, Insights and Forecast - by End User
- 11.4.1. Residential
- 11.4.2. Commercial
- 11.1. Market Analysis, Insights and Forecast - by Product
- 12. Competitive Analysis
- 12.1. Company Profiles
- 12.1.1 Ceramica Cleopatra
- 12.1.1.1. Company Overview
- 12.1.1.2. Products
- 12.1.1.3. Company Financials
- 12.1.1.4. SWOT Analysis
- 12.1.2 Gloria Ceramics
- 12.1.2.1. Company Overview
- 12.1.2.2. Products
- 12.1.2.3. Company Financials
- 12.1.2.4. SWOT Analysis
- 12.1.3 Misr International Ceramic Company (MICC)
- 12.1.3.1. Company Overview
- 12.1.3.2. Products
- 12.1.3.3. Company Financials
- 12.1.3.4. SWOT Analysis
- 12.1.4 Aracemco (The Arab ceramic company)
- 12.1.4.1. Company Overview
- 12.1.4.2. Products
- 12.1.4.3. Company Financials
- 12.1.4.4. SWOT Analysis
- 12.1.5 Ceramica Prima
- 12.1.5.1. Company Overview
- 12.1.5.2. Products
- 12.1.5.3. Company Financials
- 12.1.5.4. SWOT Analysis
- 12.1.6 Ceramica Venzia
- 12.1.6.1. Company Overview
- 12.1.6.2. Products
- 12.1.6.3. Company Financials
- 12.1.6.4. SWOT Analysis
- 12.1.7 Lecico Egypt
- 12.1.7.1. Company Overview
- 12.1.7.2. Products
- 12.1.7.3. Company Financials
- 12.1.7.4. SWOT Analysis
- 12.1.8 Al-Ezz Ceramics and Porcelain (Gemma)
- 12.1.8.1. Company Overview
- 12.1.8.2. Products
- 12.1.8.3. Company Financials
- 12.1.8.4. SWOT Analysis
- 12.1.9 Al Amir Ceramics
- 12.1.9.1. Company Overview
- 12.1.9.2. Products
- 12.1.9.3. Company Financials
- 12.1.9.4. SWOT Analysis
- 12.1.10 Alfa Ceramic
- 12.1.10.1. Company Overview
- 12.1.10.2. Products
- 12.1.10.3. Company Financials
- 12.1.10.4. SWOT Analysis
- 12.1.11 Royal Ceramica
- 12.1.11.1. Company Overview
- 12.1.11.2. Products
- 12.1.11.3. Company Financials
- 12.1.11.4. SWOT Analysis
- 12.1.12 Pharaohs Ceramics Group (Ceramica Innova)
- 12.1.12.1. Company Overview
- 12.1.12.2. Products
- 12.1.12.3. Company Financials
- 12.1.12.4. SWOT Analysis
- 12.1.1 Ceramica Cleopatra
- 12.2. Market Entropy
- 12.2.1 Company's Key Areas Served
- 12.2.2 Recent Developments
- 12.3. Company Market Share Analysis 2025
- 12.3.1 Top 5 Companies Market Share Analysis
- 12.3.2 Top 3 Companies Market Share Analysis
- 12.4. List of Potential Customers
- 13. Research Methodology
List of Figures
- Figure 1: Global Ceramic Tiles in Egypt Industry Revenue Breakdown (billion, %) by Region 2025 & 2033
- Figure 2: Global Ceramic Tiles in Egypt Industry Volume Breakdown (K Unit, %) by Region 2025 & 2033
- Figure 3: North America Ceramic Tiles in Egypt Industry Revenue (billion), by Product 2025 & 2033
- Figure 4: North America Ceramic Tiles in Egypt Industry Volume (K Unit), by Product 2025 & 2033
- Figure 5: North America Ceramic Tiles in Egypt Industry Revenue Share (%), by Product 2025 & 2033
- Figure 6: North America Ceramic Tiles in Egypt Industry Volume Share (%), by Product 2025 & 2033
- Figure 7: North America Ceramic Tiles in Egypt Industry Revenue (billion), by Application 2025 & 2033
- Figure 8: North America Ceramic Tiles in Egypt Industry Volume (K Unit), by Application 2025 & 2033
- Figure 9: North America Ceramic Tiles in Egypt Industry Revenue Share (%), by Application 2025 & 2033
- Figure 10: North America Ceramic Tiles in Egypt Industry Volume Share (%), by Application 2025 & 2033
- Figure 11: North America Ceramic Tiles in Egypt Industry Revenue (billion), by Construction Type 2025 & 2033
- Figure 12: North America Ceramic Tiles in Egypt Industry Volume (K Unit), by Construction Type 2025 & 2033
- Figure 13: North America Ceramic Tiles in Egypt Industry Revenue Share (%), by Construction Type 2025 & 2033
- Figure 14: North America Ceramic Tiles in Egypt Industry Volume Share (%), by Construction Type 2025 & 2033
- Figure 15: North America Ceramic Tiles in Egypt Industry Revenue (billion), by End User 2025 & 2033
- Figure 16: North America Ceramic Tiles in Egypt Industry Volume (K Unit), by End User 2025 & 2033
- Figure 17: North America Ceramic Tiles in Egypt Industry Revenue Share (%), by End User 2025 & 2033
- Figure 18: North America Ceramic Tiles in Egypt Industry Volume Share (%), by End User 2025 & 2033
- Figure 19: North America Ceramic Tiles in Egypt Industry Revenue (billion), by Country 2025 & 2033
- Figure 20: North America Ceramic Tiles in Egypt Industry Volume (K Unit), by Country 2025 & 2033
- Figure 21: North America Ceramic Tiles in Egypt Industry Revenue Share (%), by Country 2025 & 2033
- Figure 22: North America Ceramic Tiles in Egypt Industry Volume Share (%), by Country 2025 & 2033
- Figure 23: South America Ceramic Tiles in Egypt Industry Revenue (billion), by Product 2025 & 2033
- Figure 24: South America Ceramic Tiles in Egypt Industry Volume (K Unit), by Product 2025 & 2033
- Figure 25: South America Ceramic Tiles in Egypt Industry Revenue Share (%), by Product 2025 & 2033
- Figure 26: South America Ceramic Tiles in Egypt Industry Volume Share (%), by Product 2025 & 2033
- Figure 27: South America Ceramic Tiles in Egypt Industry Revenue (billion), by Application 2025 & 2033
- Figure 28: South America Ceramic Tiles in Egypt Industry Volume (K Unit), by Application 2025 & 2033
- Figure 29: South America Ceramic Tiles in Egypt Industry Revenue Share (%), by Application 2025 & 2033
- Figure 30: South America Ceramic Tiles in Egypt Industry Volume Share (%), by Application 2025 & 2033
- Figure 31: South America Ceramic Tiles in Egypt Industry Revenue (billion), by Construction Type 2025 & 2033
- Figure 32: South America Ceramic Tiles in Egypt Industry Volume (K Unit), by Construction Type 2025 & 2033
- Figure 33: South America Ceramic Tiles in Egypt Industry Revenue Share (%), by Construction Type 2025 & 2033
- Figure 34: South America Ceramic Tiles in Egypt Industry Volume Share (%), by Construction Type 2025 & 2033
- Figure 35: South America Ceramic Tiles in Egypt Industry Revenue (billion), by End User 2025 & 2033
- Figure 36: South America Ceramic Tiles in Egypt Industry Volume (K Unit), by End User 2025 & 2033
- Figure 37: South America Ceramic Tiles in Egypt Industry Revenue Share (%), by End User 2025 & 2033
- Figure 38: South America Ceramic Tiles in Egypt Industry Volume Share (%), by End User 2025 & 2033
- Figure 39: South America Ceramic Tiles in Egypt Industry Revenue (billion), by Country 2025 & 2033
- Figure 40: South America Ceramic Tiles in Egypt Industry Volume (K Unit), by Country 2025 & 2033
- Figure 41: South America Ceramic Tiles in Egypt Industry Revenue Share (%), by Country 2025 & 2033
- Figure 42: South America Ceramic Tiles in Egypt Industry Volume Share (%), by Country 2025 & 2033
- Figure 43: Europe Ceramic Tiles in Egypt Industry Revenue (billion), by Product 2025 & 2033
- Figure 44: Europe Ceramic Tiles in Egypt Industry Volume (K Unit), by Product 2025 & 2033
- Figure 45: Europe Ceramic Tiles in Egypt Industry Revenue Share (%), by Product 2025 & 2033
- Figure 46: Europe Ceramic Tiles in Egypt Industry Volume Share (%), by Product 2025 & 2033
- Figure 47: Europe Ceramic Tiles in Egypt Industry Revenue (billion), by Application 2025 & 2033
- Figure 48: Europe Ceramic Tiles in Egypt Industry Volume (K Unit), by Application 2025 & 2033
- Figure 49: Europe Ceramic Tiles in Egypt Industry Revenue Share (%), by Application 2025 & 2033
- Figure 50: Europe Ceramic Tiles in Egypt Industry Volume Share (%), by Application 2025 & 2033
- Figure 51: Europe Ceramic Tiles in Egypt Industry Revenue (billion), by Construction Type 2025 & 2033
- Figure 52: Europe Ceramic Tiles in Egypt Industry Volume (K Unit), by Construction Type 2025 & 2033
- Figure 53: Europe Ceramic Tiles in Egypt Industry Revenue Share (%), by Construction Type 2025 & 2033
- Figure 54: Europe Ceramic Tiles in Egypt Industry Volume Share (%), by Construction Type 2025 & 2033
- Figure 55: Europe Ceramic Tiles in Egypt Industry Revenue (billion), by End User 2025 & 2033
- Figure 56: Europe Ceramic Tiles in Egypt Industry Volume (K Unit), by End User 2025 & 2033
- Figure 57: Europe Ceramic Tiles in Egypt Industry Revenue Share (%), by End User 2025 & 2033
- Figure 58: Europe Ceramic Tiles in Egypt Industry Volume Share (%), by End User 2025 & 2033
- Figure 59: Europe Ceramic Tiles in Egypt Industry Revenue (billion), by Country 2025 & 2033
- Figure 60: Europe Ceramic Tiles in Egypt Industry Volume (K Unit), by Country 2025 & 2033
- Figure 61: Europe Ceramic Tiles in Egypt Industry Revenue Share (%), by Country 2025 & 2033
- Figure 62: Europe Ceramic Tiles in Egypt Industry Volume Share (%), by Country 2025 & 2033
- Figure 63: Middle East & Africa Ceramic Tiles in Egypt Industry Revenue (billion), by Product 2025 & 2033
- Figure 64: Middle East & Africa Ceramic Tiles in Egypt Industry Volume (K Unit), by Product 2025 & 2033
- Figure 65: Middle East & Africa Ceramic Tiles in Egypt Industry Revenue Share (%), by Product 2025 & 2033
- Figure 66: Middle East & Africa Ceramic Tiles in Egypt Industry Volume Share (%), by Product 2025 & 2033
- Figure 67: Middle East & Africa Ceramic Tiles in Egypt Industry Revenue (billion), by Application 2025 & 2033
- Figure 68: Middle East & Africa Ceramic Tiles in Egypt Industry Volume (K Unit), by Application 2025 & 2033
- Figure 69: Middle East & Africa Ceramic Tiles in Egypt Industry Revenue Share (%), by Application 2025 & 2033
- Figure 70: Middle East & Africa Ceramic Tiles in Egypt Industry Volume Share (%), by Application 2025 & 2033
- Figure 71: Middle East & Africa Ceramic Tiles in Egypt Industry Revenue (billion), by Construction Type 2025 & 2033
- Figure 72: Middle East & Africa Ceramic Tiles in Egypt Industry Volume (K Unit), by Construction Type 2025 & 2033
- Figure 73: Middle East & Africa Ceramic Tiles in Egypt Industry Revenue Share (%), by Construction Type 2025 & 2033
- Figure 74: Middle East & Africa Ceramic Tiles in Egypt Industry Volume Share (%), by Construction Type 2025 & 2033
- Figure 75: Middle East & Africa Ceramic Tiles in Egypt Industry Revenue (billion), by End User 2025 & 2033
- Figure 76: Middle East & Africa Ceramic Tiles in Egypt Industry Volume (K Unit), by End User 2025 & 2033
- Figure 77: Middle East & Africa Ceramic Tiles in Egypt Industry Revenue Share (%), by End User 2025 & 2033
- Figure 78: Middle East & Africa Ceramic Tiles in Egypt Industry Volume Share (%), by End User 2025 & 2033
- Figure 79: Middle East & Africa Ceramic Tiles in Egypt Industry Revenue (billion), by Country 2025 & 2033
- Figure 80: Middle East & Africa Ceramic Tiles in Egypt Industry Volume (K Unit), by Country 2025 & 2033
- Figure 81: Middle East & Africa Ceramic Tiles in Egypt Industry Revenue Share (%), by Country 2025 & 2033
- Figure 82: Middle East & Africa Ceramic Tiles in Egypt Industry Volume Share (%), by Country 2025 & 2033
- Figure 83: Asia Pacific Ceramic Tiles in Egypt Industry Revenue (billion), by Product 2025 & 2033
- Figure 84: Asia Pacific Ceramic Tiles in Egypt Industry Volume (K Unit), by Product 2025 & 2033
- Figure 85: Asia Pacific Ceramic Tiles in Egypt Industry Revenue Share (%), by Product 2025 & 2033
- Figure 86: Asia Pacific Ceramic Tiles in Egypt Industry Volume Share (%), by Product 2025 & 2033
- Figure 87: Asia Pacific Ceramic Tiles in Egypt Industry Revenue (billion), by Application 2025 & 2033
- Figure 88: Asia Pacific Ceramic Tiles in Egypt Industry Volume (K Unit), by Application 2025 & 2033
- Figure 89: Asia Pacific Ceramic Tiles in Egypt Industry Revenue Share (%), by Application 2025 & 2033
- Figure 90: Asia Pacific Ceramic Tiles in Egypt Industry Volume Share (%), by Application 2025 & 2033
- Figure 91: Asia Pacific Ceramic Tiles in Egypt Industry Revenue (billion), by Construction Type 2025 & 2033
- Figure 92: Asia Pacific Ceramic Tiles in Egypt Industry Volume (K Unit), by Construction Type 2025 & 2033
- Figure 93: Asia Pacific Ceramic Tiles in Egypt Industry Revenue Share (%), by Construction Type 2025 & 2033
- Figure 94: Asia Pacific Ceramic Tiles in Egypt Industry Volume Share (%), by Construction Type 2025 & 2033
- Figure 95: Asia Pacific Ceramic Tiles in Egypt Industry Revenue (billion), by End User 2025 & 2033
- Figure 96: Asia Pacific Ceramic Tiles in Egypt Industry Volume (K Unit), by End User 2025 & 2033
- Figure 97: Asia Pacific Ceramic Tiles in Egypt Industry Revenue Share (%), by End User 2025 & 2033
- Figure 98: Asia Pacific Ceramic Tiles in Egypt Industry Volume Share (%), by End User 2025 & 2033
- Figure 99: Asia Pacific Ceramic Tiles in Egypt Industry Revenue (billion), by Country 2025 & 2033
- Figure 100: Asia Pacific Ceramic Tiles in Egypt Industry Volume (K Unit), by Country 2025 & 2033
- Figure 101: Asia Pacific Ceramic Tiles in Egypt Industry Revenue Share (%), by Country 2025 & 2033
- Figure 102: Asia Pacific Ceramic Tiles in Egypt Industry Volume Share (%), by Country 2025 & 2033
List of Tables
- Table 1: Global Ceramic Tiles in Egypt Industry Revenue billion Forecast, by Product 2020 & 2033
- Table 2: Global Ceramic Tiles in Egypt Industry Volume K Unit Forecast, by Product 2020 & 2033
- Table 3: Global Ceramic Tiles in Egypt Industry Revenue billion Forecast, by Application 2020 & 2033
- Table 4: Global Ceramic Tiles in Egypt Industry Volume K Unit Forecast, by Application 2020 & 2033
- Table 5: Global Ceramic Tiles in Egypt Industry Revenue billion Forecast, by Construction Type 2020 & 2033
- Table 6: Global Ceramic Tiles in Egypt Industry Volume K Unit Forecast, by Construction Type 2020 & 2033
- Table 7: Global Ceramic Tiles in Egypt Industry Revenue billion Forecast, by End User 2020 & 2033
- Table 8: Global Ceramic Tiles in Egypt Industry Volume K Unit Forecast, by End User 2020 & 2033
- Table 9: Global Ceramic Tiles in Egypt Industry Revenue billion Forecast, by Region 2020 & 2033
- Table 10: Global Ceramic Tiles in Egypt Industry Volume K Unit Forecast, by Region 2020 & 2033
- Table 11: Global Ceramic Tiles in Egypt Industry Revenue billion Forecast, by Product 2020 & 2033
- Table 12: Global Ceramic Tiles in Egypt Industry Volume K Unit Forecast, by Product 2020 & 2033
- Table 13: Global Ceramic Tiles in Egypt Industry Revenue billion Forecast, by Application 2020 & 2033
- Table 14: Global Ceramic Tiles in Egypt Industry Volume K Unit Forecast, by Application 2020 & 2033
- Table 15: Global Ceramic Tiles in Egypt Industry Revenue billion Forecast, by Construction Type 2020 & 2033
- Table 16: Global Ceramic Tiles in Egypt Industry Volume K Unit Forecast, by Construction Type 2020 & 2033
- Table 17: Global Ceramic Tiles in Egypt Industry Revenue billion Forecast, by End User 2020 & 2033
- Table 18: Global Ceramic Tiles in Egypt Industry Volume K Unit Forecast, by End User 2020 & 2033
- Table 19: Global Ceramic Tiles in Egypt Industry Revenue billion Forecast, by Country 2020 & 2033
- Table 20: Global Ceramic Tiles in Egypt Industry Volume K Unit Forecast, by Country 2020 & 2033
- Table 21: United States Ceramic Tiles in Egypt Industry Revenue (billion) Forecast, by Application 2020 & 2033
- Table 22: United States Ceramic Tiles in Egypt Industry Volume (K Unit) Forecast, by Application 2020 & 2033
- Table 23: Canada Ceramic Tiles in Egypt Industry Revenue (billion) Forecast, by Application 2020 & 2033
- Table 24: Canada Ceramic Tiles in Egypt Industry Volume (K Unit) Forecast, by Application 2020 & 2033
- Table 25: Mexico Ceramic Tiles in Egypt Industry Revenue (billion) Forecast, by Application 2020 & 2033
- Table 26: Mexico Ceramic Tiles in Egypt Industry Volume (K Unit) Forecast, by Application 2020 & 2033
- Table 27: Global Ceramic Tiles in Egypt Industry Revenue billion Forecast, by Product 2020 & 2033
- Table 28: Global Ceramic Tiles in Egypt Industry Volume K Unit Forecast, by Product 2020 & 2033
- Table 29: Global Ceramic Tiles in Egypt Industry Revenue billion Forecast, by Application 2020 & 2033
- Table 30: Global Ceramic Tiles in Egypt Industry Volume K Unit Forecast, by Application 2020 & 2033
- Table 31: Global Ceramic Tiles in Egypt Industry Revenue billion Forecast, by Construction Type 2020 & 2033
- Table 32: Global Ceramic Tiles in Egypt Industry Volume K Unit Forecast, by Construction Type 2020 & 2033
- Table 33: Global Ceramic Tiles in Egypt Industry Revenue billion Forecast, by End User 2020 & 2033
- Table 34: Global Ceramic Tiles in Egypt Industry Volume K Unit Forecast, by End User 2020 & 2033
- Table 35: Global Ceramic Tiles in Egypt Industry Revenue billion Forecast, by Country 2020 & 2033
- Table 36: Global Ceramic Tiles in Egypt Industry Volume K Unit Forecast, by Country 2020 & 2033
- Table 37: Brazil Ceramic Tiles in Egypt Industry Revenue (billion) Forecast, by Application 2020 & 2033
- Table 38: Brazil Ceramic Tiles in Egypt Industry Volume (K Unit) Forecast, by Application 2020 & 2033
- Table 39: Argentina Ceramic Tiles in Egypt Industry Revenue (billion) Forecast, by Application 2020 & 2033
- Table 40: Argentina Ceramic Tiles in Egypt Industry Volume (K Unit) Forecast, by Application 2020 & 2033
- Table 41: Rest of South America Ceramic Tiles in Egypt Industry Revenue (billion) Forecast, by Application 2020 & 2033
- Table 42: Rest of South America Ceramic Tiles in Egypt Industry Volume (K Unit) Forecast, by Application 2020 & 2033
- Table 43: Global Ceramic Tiles in Egypt Industry Revenue billion Forecast, by Product 2020 & 2033
- Table 44: Global Ceramic Tiles in Egypt Industry Volume K Unit Forecast, by Product 2020 & 2033
- Table 45: Global Ceramic Tiles in Egypt Industry Revenue billion Forecast, by Application 2020 & 2033
- Table 46: Global Ceramic Tiles in Egypt Industry Volume K Unit Forecast, by Application 2020 & 2033
- Table 47: Global Ceramic Tiles in Egypt Industry Revenue billion Forecast, by Construction Type 2020 & 2033
- Table 48: Global Ceramic Tiles in Egypt Industry Volume K Unit Forecast, by Construction Type 2020 & 2033
- Table 49: Global Ceramic Tiles in Egypt Industry Revenue billion Forecast, by End User 2020 & 2033
- Table 50: Global Ceramic Tiles in Egypt Industry Volume K Unit Forecast, by End User 2020 & 2033
- Table 51: Global Ceramic Tiles in Egypt Industry Revenue billion Forecast, by Country 2020 & 2033
- Table 52: Global Ceramic Tiles in Egypt Industry Volume K Unit Forecast, by Country 2020 & 2033
- Table 53: United Kingdom Ceramic Tiles in Egypt Industry Revenue (billion) Forecast, by Application 2020 & 2033
- Table 54: United Kingdom Ceramic Tiles in Egypt Industry Volume (K Unit) Forecast, by Application 2020 & 2033
- Table 55: Germany Ceramic Tiles in Egypt Industry Revenue (billion) Forecast, by Application 2020 & 2033
- Table 56: Germany Ceramic Tiles in Egypt Industry Volume (K Unit) Forecast, by Application 2020 & 2033
- Table 57: France Ceramic Tiles in Egypt Industry Revenue (billion) Forecast, by Application 2020 & 2033
- Table 58: France Ceramic Tiles in Egypt Industry Volume (K Unit) Forecast, by Application 2020 & 2033
- Table 59: Italy Ceramic Tiles in Egypt Industry Revenue (billion) Forecast, by Application 2020 & 2033
- Table 60: Italy Ceramic Tiles in Egypt Industry Volume (K Unit) Forecast, by Application 2020 & 2033
- Table 61: Spain Ceramic Tiles in Egypt Industry Revenue (billion) Forecast, by Application 2020 & 2033
- Table 62: Spain Ceramic Tiles in Egypt Industry Volume (K Unit) Forecast, by Application 2020 & 2033
- Table 63: Russia Ceramic Tiles in Egypt Industry Revenue (billion) Forecast, by Application 2020 & 2033
- Table 64: Russia Ceramic Tiles in Egypt Industry Volume (K Unit) Forecast, by Application 2020 & 2033
- Table 65: Benelux Ceramic Tiles in Egypt Industry Revenue (billion) Forecast, by Application 2020 & 2033
- Table 66: Benelux Ceramic Tiles in Egypt Industry Volume (K Unit) Forecast, by Application 2020 & 2033
- Table 67: Nordics Ceramic Tiles in Egypt Industry Revenue (billion) Forecast, by Application 2020 & 2033
- Table 68: Nordics Ceramic Tiles in Egypt Industry Volume (K Unit) Forecast, by Application 2020 & 2033
- Table 69: Rest of Europe Ceramic Tiles in Egypt Industry Revenue (billion) Forecast, by Application 2020 & 2033
- Table 70: Rest of Europe Ceramic Tiles in Egypt Industry Volume (K Unit) Forecast, by Application 2020 & 2033
- Table 71: Global Ceramic Tiles in Egypt Industry Revenue billion Forecast, by Product 2020 & 2033
- Table 72: Global Ceramic Tiles in Egypt Industry Volume K Unit Forecast, by Product 2020 & 2033
- Table 73: Global Ceramic Tiles in Egypt Industry Revenue billion Forecast, by Application 2020 & 2033
- Table 74: Global Ceramic Tiles in Egypt Industry Volume K Unit Forecast, by Application 2020 & 2033
- Table 75: Global Ceramic Tiles in Egypt Industry Revenue billion Forecast, by Construction Type 2020 & 2033
- Table 76: Global Ceramic Tiles in Egypt Industry Volume K Unit Forecast, by Construction Type 2020 & 2033
- Table 77: Global Ceramic Tiles in Egypt Industry Revenue billion Forecast, by End User 2020 & 2033
- Table 78: Global Ceramic Tiles in Egypt Industry Volume K Unit Forecast, by End User 2020 & 2033
- Table 79: Global Ceramic Tiles in Egypt Industry Revenue billion Forecast, by Country 2020 & 2033
- Table 80: Global Ceramic Tiles in Egypt Industry Volume K Unit Forecast, by Country 2020 & 2033
- Table 81: Turkey Ceramic Tiles in Egypt Industry Revenue (billion) Forecast, by Application 2020 & 2033
- Table 82: Turkey Ceramic Tiles in Egypt Industry Volume (K Unit) Forecast, by Application 2020 & 2033
- Table 83: Israel Ceramic Tiles in Egypt Industry Revenue (billion) Forecast, by Application 2020 & 2033
- Table 84: Israel Ceramic Tiles in Egypt Industry Volume (K Unit) Forecast, by Application 2020 & 2033
- Table 85: GCC Ceramic Tiles in Egypt Industry Revenue (billion) Forecast, by Application 2020 & 2033
- Table 86: GCC Ceramic Tiles in Egypt Industry Volume (K Unit) Forecast, by Application 2020 & 2033
- Table 87: North Africa Ceramic Tiles in Egypt Industry Revenue (billion) Forecast, by Application 2020 & 2033
- Table 88: North Africa Ceramic Tiles in Egypt Industry Volume (K Unit) Forecast, by Application 2020 & 2033
- Table 89: South Africa Ceramic Tiles in Egypt Industry Revenue (billion) Forecast, by Application 2020 & 2033
- Table 90: South Africa Ceramic Tiles in Egypt Industry Volume (K Unit) Forecast, by Application 2020 & 2033
- Table 91: Rest of Middle East & Africa Ceramic Tiles in Egypt Industry Revenue (billion) Forecast, by Application 2020 & 2033
- Table 92: Rest of Middle East & Africa Ceramic Tiles in Egypt Industry Volume (K Unit) Forecast, by Application 2020 & 2033
- Table 93: Global Ceramic Tiles in Egypt Industry Revenue billion Forecast, by Product 2020 & 2033
- Table 94: Global Ceramic Tiles in Egypt Industry Volume K Unit Forecast, by Product 2020 & 2033
- Table 95: Global Ceramic Tiles in Egypt Industry Revenue billion Forecast, by Application 2020 & 2033
- Table 96: Global Ceramic Tiles in Egypt Industry Volume K Unit Forecast, by Application 2020 & 2033
- Table 97: Global Ceramic Tiles in Egypt Industry Revenue billion Forecast, by Construction Type 2020 & 2033
- Table 98: Global Ceramic Tiles in Egypt Industry Volume K Unit Forecast, by Construction Type 2020 & 2033
- Table 99: Global Ceramic Tiles in Egypt Industry Revenue billion Forecast, by End User 2020 & 2033
- Table 100: Global Ceramic Tiles in Egypt Industry Volume K Unit Forecast, by End User 2020 & 2033
- Table 101: Global Ceramic Tiles in Egypt Industry Revenue billion Forecast, by Country 2020 & 2033
- Table 102: Global Ceramic Tiles in Egypt Industry Volume K Unit Forecast, by Country 2020 & 2033
- Table 103: China Ceramic Tiles in Egypt Industry Revenue (billion) Forecast, by Application 2020 & 2033
- Table 104: China Ceramic Tiles in Egypt Industry Volume (K Unit) Forecast, by Application 2020 & 2033
- Table 105: India Ceramic Tiles in Egypt Industry Revenue (billion) Forecast, by Application 2020 & 2033
- Table 106: India Ceramic Tiles in Egypt Industry Volume (K Unit) Forecast, by Application 2020 & 2033
- Table 107: Japan Ceramic Tiles in Egypt Industry Revenue (billion) Forecast, by Application 2020 & 2033
- Table 108: Japan Ceramic Tiles in Egypt Industry Volume (K Unit) Forecast, by Application 2020 & 2033
- Table 109: South Korea Ceramic Tiles in Egypt Industry Revenue (billion) Forecast, by Application 2020 & 2033
- Table 110: South Korea Ceramic Tiles in Egypt Industry Volume (K Unit) Forecast, by Application 2020 & 2033
- Table 111: ASEAN Ceramic Tiles in Egypt Industry Revenue (billion) Forecast, by Application 2020 & 2033
- Table 112: ASEAN Ceramic Tiles in Egypt Industry Volume (K Unit) Forecast, by Application 2020 & 2033
- Table 113: Oceania Ceramic Tiles in Egypt Industry Revenue (billion) Forecast, by Application 2020 & 2033
- Table 114: Oceania Ceramic Tiles in Egypt Industry Volume (K Unit) Forecast, by Application 2020 & 2033
- Table 115: Rest of Asia Pacific Ceramic Tiles in Egypt Industry Revenue (billion) Forecast, by Application 2020 & 2033
- Table 116: Rest of Asia Pacific Ceramic Tiles in Egypt Industry Volume (K Unit) Forecast, by Application 2020 & 2033
Frequently Asked Questions
1. What is the projected Compound Annual Growth Rate (CAGR) of the Ceramic Tiles in Egypt Industry?
The projected CAGR is approximately 8.3%.
2. Which companies are prominent players in the Ceramic Tiles in Egypt Industry?
Key companies in the market include Ceramica Cleopatra, Gloria Ceramics, Misr International Ceramic Company (MICC), Aracemco (The Arab ceramic company), Ceramica Prima, Ceramica Venzia, Lecico Egypt, Al-Ezz Ceramics and Porcelain (Gemma), Al Amir Ceramics, Alfa Ceramic, Royal Ceramica, Pharaohs Ceramics Group (Ceramica Innova).
3. What are the main segments of the Ceramic Tiles in Egypt Industry?
The market segments include Product, Application, Construction Type, End User.
4. Can you provide details about the market size?
The market size is estimated to be USD 1.5 billion as of 2022.
5. What are some drivers contributing to market growth?
Rising Construction Sector is Driving the Floor Covering Market; Growing Urbanization is Driving the Market.
6. What are the notable trends driving market growth?
Increasing Production of Ceramic Tiles in Egypt.
7. Are there any restraints impacting market growth?
Skill Gap and Labor Shortages Strikes as Major Restraints For Floor Covering Manufacturing And Maintenance.
8. Can you provide examples of recent developments in the market?
N/A
9. What pricing options are available for accessing the report?
Pricing options include single-user, multi-user, and enterprise licenses priced at USD 3800, USD 4500, and USD 5800 respectively.
10. Is the market size provided in terms of value or volume?
The market size is provided in terms of value, measured in billion and volume, measured in K Unit.
11. Are there any specific market keywords associated with the report?
Yes, the market keyword associated with the report is "Ceramic Tiles in Egypt Industry," which aids in identifying and referencing the specific market segment covered.
12. How do I determine which pricing option suits my needs best?
The pricing options vary based on user requirements and access needs. Individual users may opt for single-user licenses, while businesses requiring broader access may choose multi-user or enterprise licenses for cost-effective access to the report.
13. Are there any additional resources or data provided in the Ceramic Tiles in Egypt Industry report?
While the report offers comprehensive insights, it's advisable to review the specific contents or supplementary materials provided to ascertain if additional resources or data are available.
14. How can I stay updated on further developments or reports in the Ceramic Tiles in Egypt Industry?
To stay informed about further developments, trends, and reports in the Ceramic Tiles in Egypt Industry, consider subscribing to industry newsletters, following relevant companies and organizations, or regularly checking reputable industry news sources and publications.
Methodology
Step 1 - Identification of Relevant Samples Size from Population Database


Step 2 - Approaches for Defining Global Market Size (Value, Volume* & Price*)

Note*: In applicable scenarios
Step 3 - Data Sources
Primary Research
- Web Analytics
- Survey Reports
- Research Institute
- Latest Research Reports
- Opinion Leaders
Secondary Research
- Annual Reports
- White Paper
- Latest Press Release
- Industry Association
- Paid Database
- Investor Presentations

Step 4 - Data Triangulation
Involves using different sources of information in order to increase the validity of a study
These sources are likely to be stakeholders in a program - participants, other researchers, program staff, other community members, and so on.
Then we put all data in single framework & apply various statistical tools to find out the dynamic on the market.
During the analysis stage, feedback from the stakeholder groups would be compared to determine areas of agreement as well as areas of divergence