

Key Insights
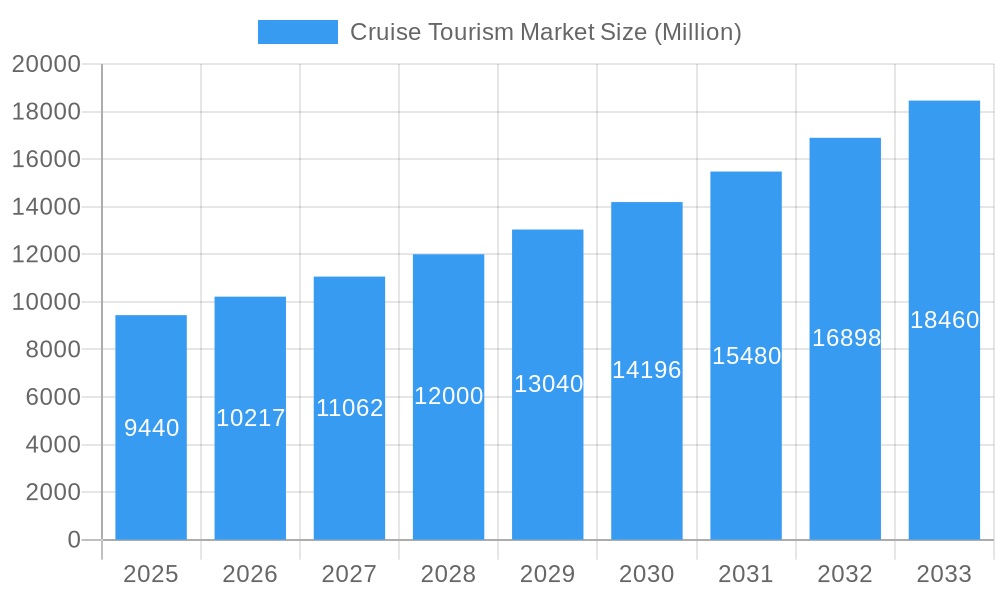
The global cruise tourism market, valued at $9.44 billion in 2025, is projected to experience robust growth, exhibiting a Compound Annual Growth Rate (CAGR) of 8.67% from 2025 to 2033. This expansion is fueled by several key drivers. Rising disposable incomes, particularly in emerging economies, are enabling more individuals to afford luxury travel experiences like cruises. The increasing popularity of unique cruise itineraries, such as expedition cruises and themed cruises catering to specific interests (e.g., culinary, historical, adventure), is diversifying the market and attracting a wider range of travelers. Furthermore, advancements in cruise ship technology and amenities, including enhanced onboard entertainment and improved sustainability initiatives, contribute to the market's growth. However, the market faces certain constraints. Economic downturns can significantly impact discretionary spending on leisure travel, including cruises. Concerns about environmental impact, particularly regarding marine pollution and ecosystem disruption, present a challenge that the industry is actively addressing through stricter regulations and sustainable practices. The fluctuating global political climate and potential geopolitical instability can also influence travel decisions and impact demand. Segmentation analysis reveals that the 20-39 age group constitutes a significant portion of cruise passengers, driven by a desire for experiential travel. Ocean cruises remain the dominant type, but expedition and theme cruises are witnessing notable growth. Cruises lasting 8-14 days are the most popular duration. Major players, such as Carnival Corporation, Royal Caribbean Group, and MSC Cruises, dominate the market, competing through innovative offerings and expansion strategies. Regional analysis indicates North America and Europe as currently the largest markets, with Asia-Pacific exhibiting significant growth potential due to increasing middle-class affluence and a rising interest in international travel.
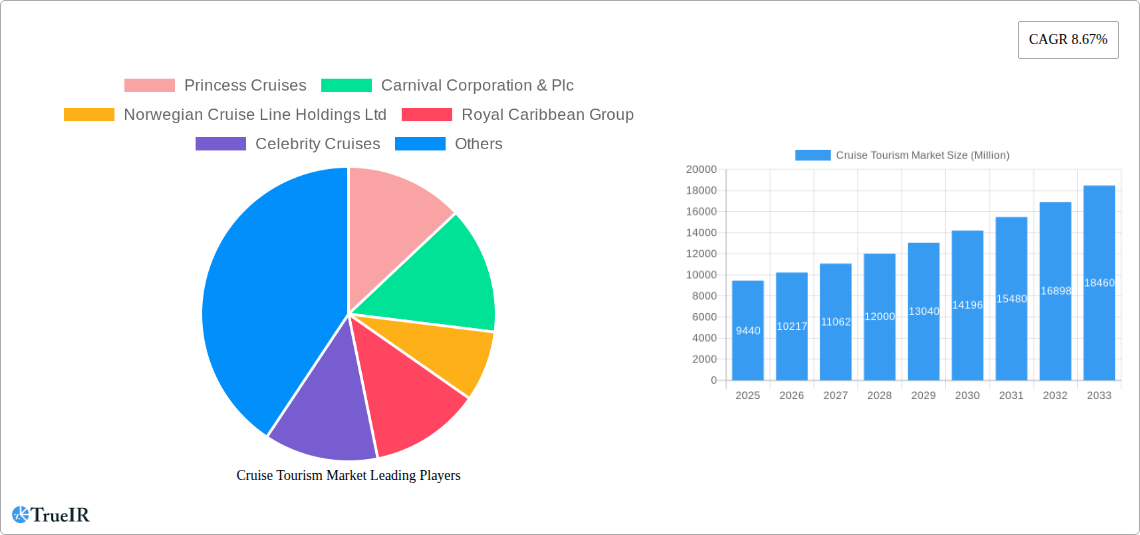
Cruise Tourism Market Market Size (In Billion)
The forecast period (2025-2033) anticipates a substantial market expansion, driven by continued growth in disposable incomes and a sustained interest in cruise vacations. However, the industry must proactively manage environmental concerns and adapt to changing consumer preferences to maintain sustainable growth. Effective marketing strategies targeting diverse demographics and geographic regions will also play a vital role. The competition among established players and new entrants will likely intensify, emphasizing the need for continuous innovation and operational efficiency to maintain a competitive edge. The evolution of cruise itineraries and service offerings will remain crucial in catering to evolving traveler demands, including an increased focus on personalized experiences and sustainable practices. Successful navigation of these dynamics will be key to achieving the predicted growth trajectory.
Cruise Tourism Market Company Market Share
Cruise Tourism Market Report: 2019-2033 Forecast
This comprehensive report provides a detailed analysis of the global cruise tourism market, offering invaluable insights for investors, industry professionals, and strategic decision-makers. Covering the period 2019-2033, with a focus on 2025, this report meticulously examines market size, segmentation, competitive dynamics, and future growth prospects. The study leverages robust data analysis and expert insights to deliver a clear understanding of this dynamic sector.
Cruise Tourism Market Market Structure & Competitive Landscape
The cruise tourism market is characterized by a moderately concentrated structure, with a handful of major players commanding significant market share. The Herfindahl-Hirschman Index (HHI) for 2025 is estimated at xx, indicating a moderately concentrated market. This concentration is driven by high barriers to entry, including substantial capital investments required for ship construction and operation, and the need for extensive global distribution networks. However, the market is also witnessing increasing innovation, particularly in areas such as sustainable cruising and personalized onboard experiences, leading to product differentiation and competition.
Key innovation drivers include technological advancements in ship design, entertainment offerings, and operational efficiency. Regulatory impacts, such as environmental regulations and safety standards, significantly shape market operations. Product substitutes, such as land-based vacations and alternative forms of travel, exert competitive pressure. End-user segmentation is crucial, with different age groups and travel preferences influencing market demand. The market has also seen a moderate level of mergers and acquisitions (M&A) activity in recent years, with xx Million in M&A volume recorded in 2024.
- Market Concentration: Moderately concentrated, with a HHI of xx in 2025.
- Innovation Drivers: Technological advancements in ship design, entertainment, and sustainability.
- Regulatory Impacts: Stringent environmental and safety regulations.
- Product Substitutes: Land-based tourism, alternative travel options.
- End-User Segmentation: Diverse age groups and travel preferences.
- M&A Trends: Moderate activity, with xx Million in M&A volume in 2024.
Cruise Tourism Market Market Trends & Opportunities
The global cruise tourism market is experiencing a dynamic phase of robust growth, with projections indicating a significant expansion to reach [Insert Projected Market Value Here] Million by 2033, demonstrating a Compound Annual Growth Rate (CAGR) of [Insert CAGR Percentage Here]% over the forecast period of 2025-2033. This upward trajectory is propelled by a confluence of factors, including a steady increase in disposable incomes, particularly evident in rapidly developing economies, and a heightened appetite for enriching leisure travel experiences. Cruise vacations are increasingly recognized as a compelling and convenient holiday choice, solidifying their appeal. Furthermore, the integration of cutting-edge technologies, such as intuitive booking platforms and highly personalized onboard services, is revolutionizing the passenger journey, thereby stimulating greater demand. Evolving consumer preferences are also playing a pivotal role. A discernible shift towards sustainable and eco-conscious cruise options is prompting cruise lines to significantly invest in environmentally friendly technologies and operational practices. The competitive landscape is characterized by continuous innovation from established market leaders and the emergence of agile new players, particularly within specialized sectors like expedition cruising. Regional market penetration for cruise tourism remains varied, with mature markets in North America and Europe exhibiting higher adoption rates compared to the burgeoning markets in Asia and Latin America.
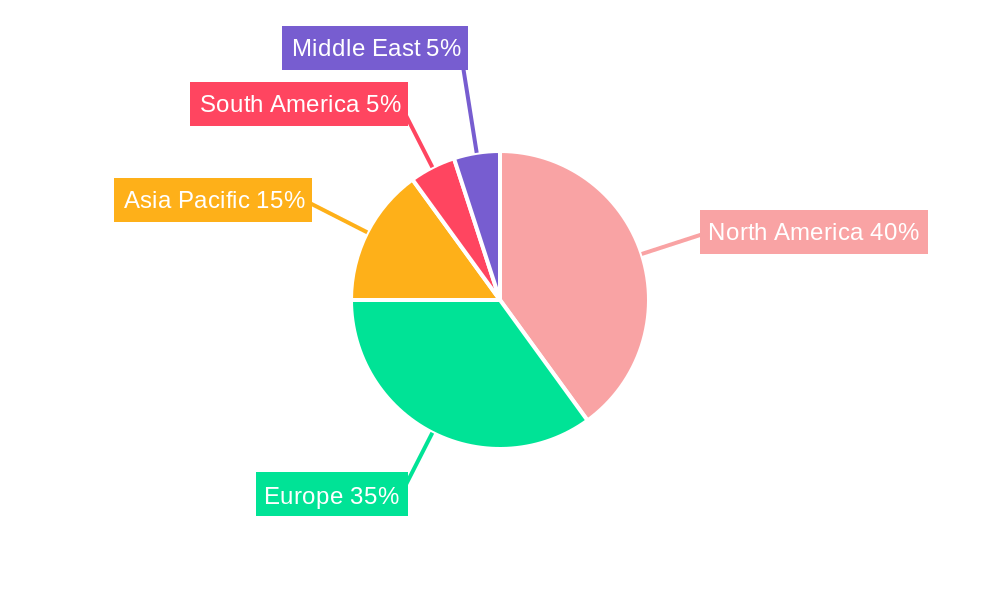
Dominant Markets & Segments in Cruise Tourism Market
The North American market currently holds the largest share of the global cruise tourism market, driven by high disposable incomes and established cruise infrastructure. However, the Asia-Pacific region is anticipated to exhibit the fastest growth rate during the forecast period.
By Passenger Age: The 20-39 years age group represents a significant segment, with xx Million passengers in 2025. The above 60 years age group is also a major contributor.
By Type: Ocean cruises remain the dominant segment, accounting for xx% of the market. However, the expedition cruise segment is showing significant growth potential.
By Duration: Cruises lasting 1-7 days are the most popular, followed by 8-14 day cruises.
- Key Growth Drivers (North America): Well-established cruise infrastructure, high disposable incomes.
- Key Growth Drivers (Asia-Pacific): Rapid economic growth, rising disposable incomes, growing middle class.
- Key Growth Drivers (Ocean Cruises): Established infrastructure, diverse offerings, wide appeal.
- Key Growth Drivers (Expedition Cruises): Growing interest in unique experiences, adventure tourism.
Cruise Tourism Market Product Analysis
The cruise industry is at the forefront of innovation, seamlessly integrating advanced technologies to elevate the passenger experience and optimize operational efficiencies. Modern cruise ships are increasingly embracing the Internet of Things (IoT) for intelligent resource management, while Artificial Intelligence (AI) is being leveraged to deliver highly personalized onboard services, from dining recommendations to activity suggestions. The incorporation of Virtual Reality (VR) and Augmented Reality (AR) is further enriching entertainment offerings and creating more immersive, engaging experiences for guests. These technological advancements are not only driving enhanced customer satisfaction but are also significantly bolstering the overall value proposition of cruise vacations, perfectly aligning with contemporary market demands for seamless, personalized, and technologically advanced travel solutions.
Key Drivers, Barriers & Challenges in Cruise Tourism Market
Key Drivers:
- Sustained growth in disposable incomes globally, particularly in emerging economies.
- Increasing consumer demand for diverse and enriching leisure travel experiences.
- Significant advancements in cruise ship technology and onboard amenities, enhancing passenger appeal.
- The evolving perception of cruise vacations as a comprehensive and highly desirable holiday option.
- Growing interest in niche cruise segments such as expedition and luxury travel.
Barriers & Challenges:
- Environmental Stewardship: Escalating global pressure and regulatory scrutiny regarding sustainable practices and the environmental impact of cruise operations.
- Geopolitical Volatility: The potential for regional conflicts, political instability, and global security concerns to impact international travel demand and disrupt operational logistics.
- Economic Fluctuations: Periods of economic downturn can lead to reduced consumer discretionary spending, directly affecting the demand for non-essential travel like cruises.
- Supply Chain Vulnerabilities: Ongoing disruptions in global supply chains can lead to increased operational costs, affect the availability of essential goods and services, and impact the quality of onboard delivery.
- Health and Safety Concerns: The lingering impact of past pandemics and the potential for future health crises can influence traveler confidence and necessitate stringent health protocols.
Growth Drivers in the Cruise Tourism Market Market
The cruise tourism market is being propelled by a robust combination of factors, including relentless technological innovation that enhances onboard experiences and operational efficiency. Economic growth in emerging markets is creating new demographics of potential cruisers with increasing disposable incomes. The progressive relaxation of international travel restrictions has significantly eased the path for global tourism. Furthermore, increasing government support for tourism infrastructure development and favorable policies are creating a more conducive environment for the expansion of the cruise sector.
Challenges Impacting Cruise Tourism Market Growth
Despite strong growth indicators, the cruise tourism market faces several significant challenges. Stringent and evolving environmental regulations necessitate substantial investments in greener technologies and sustainable practices. Volatile global fuel prices directly impact operational costs and profitability. Geopolitical uncertainties can create travel advisories and affect booking patterns. The market also grapples with intensified competition from alternative travel options, requiring continuous differentiation and value creation. Furthermore, persistent supply chain disruptions and the ever-present risk of future pandemics pose substantial threats to stable and predictable growth.
Key Players Shaping the Cruise Tourism Market Market
Significant Cruise Tourism Market Industry Milestones
- November 2023: TravClan and Resorts World Cruises partnered to revolutionize cruise tourism in India, focusing on accessibility and affordability.
- October 2023: Traveltek and Cruise Planners formed a strategic alliance to enhance cruise booking technology nationally.
Future Outlook for Cruise Tourism Market Market
The cruise tourism market is poised for continued growth, driven by sustained economic expansion, technological innovation, and evolving consumer preferences. Strategic partnerships, expansion into new markets, and a focus on sustainable practices will be key success factors for industry players. The market presents significant opportunities for companies that can effectively adapt to changing dynamics and offer innovative, eco-conscious, and personalized travel experiences.
Cruise Tourism Market Segmentation
-
1. Type
- 1.1. River Cruise
- 1.2. Ocean Cruise
- 1.3. Expedition Cruise
- 1.4. Theme Cruise
- 1.5. Adventure Cruise
- 1.6. Others
-
2. Duration
- 2.1. 1-7Days
- 2.2. 8-14 Days
- 2.3. 15-20 Days
- 2.4. More than 21 Days
-
3. Passenger Age
- 3.1. Less than 12 years
- 3.2. 13-19 Years
- 3.3. 20-39 Years
- 3.4. 40-59 Years
- 3.5. Above 60 Years
Cruise Tourism Market Segmentation By Geography
-
1. North America
- 1.1. US
- 1.2. Canada
- 1.3. Mexico
- 1.4. Rest of North America
-
2. Europe
- 2.1. Germany
- 2.2. UK
- 2.3. France
- 2.4. Russia
- 2.5. Spain
- 2.6. Rest of Europe
-
3. Asia Pacific
- 3.1. India
- 3.2. China
- 3.3. Japan
- 3.4. Rest of Asia Pacific
-
4. South America
- 4.1. Brazil
- 4.2. Argentina
- 4.3. Rest of South America
-
5. Middle East
- 5.1. UAE
- 5.2. Saudi Arabia
- 5.3. Rest of Middle East
Cruise Tourism Market Regional Market Share
Geographic Coverage of Cruise Tourism Market
Cruise Tourism Market REPORT HIGHLIGHTS
| Aspects | Details |
|---|---|
| Study Period | 2020-2034 |
| Base Year | 2025 |
| Estimated Year | 2026 |
| Forecast Period | 2026-2034 |
| Historical Period | 2020-2025 |
| Growth Rate | CAGR of 8.67% from 2020-2034 |
| Segmentation |
|
Table of Contents
- 1. Introduction
- 1.1. Research Scope
- 1.2. Market Segmentation
- 1.3. Research Objective
- 1.4. Definitions and Assumptions
- 2. Executive Summary
- 2.1. Market Snapshot
- 3. Market Dynamics
- 3.1. Market Drivers
- 3.2. Market Restrains
- 3.3. Market Trends
- 3.4. Market Opportunities
- 4. Market Factor Analysis
- 4.1. Porters Five Forces
- 4.1.1. Bargaining Power of Suppliers
- 4.1.2. Bargaining Power of Buyers
- 4.1.3. Threat of New Entrants
- 4.1.4. Threat of Substitutes
- 4.1.5. Competitive Rivalry
- 4.2. PESTEL analysis
- 4.3. BCG Analysis
- 4.3.1. Stars (High Growth, High Market Share)
- 4.3.2. Cash Cows (Low Growth, High Market Share)
- 4.3.3. Question Mark (High Growth, Low Market Share)
- 4.3.4. Dogs (Low Growth, Low Market Share)
- 4.4. Ansoff Matrix Analysis
- 4.5. Supply Chain Analysis
- 4.6. Regulatory Landscape
- 4.7. Current Market Potential and Opportunity Assessment (TAM–SAM–SOM Framework)
- 4.8. TIR Analyst Note
- 4.1. Porters Five Forces
- 5. Market Analysis, Insights and Forecast 2021-2033
- 5.1. Market Analysis, Insights and Forecast - by Type
- 5.1.1. River Cruise
- 5.1.2. Ocean Cruise
- 5.1.3. Expedition Cruise
- 5.1.4. Theme Cruise
- 5.1.5. Adventure Cruise
- 5.1.6. Others
- 5.2. Market Analysis, Insights and Forecast - by Duration
- 5.2.1. 1-7Days
- 5.2.2. 8-14 Days
- 5.2.3. 15-20 Days
- 5.2.4. More than 21 Days
- 5.3. Market Analysis, Insights and Forecast - by Passenger Age
- 5.3.1. Less than 12 years
- 5.3.2. 13-19 Years
- 5.3.3. 20-39 Years
- 5.3.4. 40-59 Years
- 5.3.5. Above 60 Years
- 5.4. Market Analysis, Insights and Forecast - by Region
- 5.4.1. North America
- 5.4.2. Europe
- 5.4.3. Asia Pacific
- 5.4.4. South America
- 5.4.5. Middle East
- 5.1. Market Analysis, Insights and Forecast - by Type
- 6. Global Cruise Tourism Market Analysis, Insights and Forecast, 2021-2033
- 6.1. Market Analysis, Insights and Forecast - by Type
- 6.1.1. River Cruise
- 6.1.2. Ocean Cruise
- 6.1.3. Expedition Cruise
- 6.1.4. Theme Cruise
- 6.1.5. Adventure Cruise
- 6.1.6. Others
- 6.2. Market Analysis, Insights and Forecast - by Duration
- 6.2.1. 1-7Days
- 6.2.2. 8-14 Days
- 6.2.3. 15-20 Days
- 6.2.4. More than 21 Days
- 6.3. Market Analysis, Insights and Forecast - by Passenger Age
- 6.3.1. Less than 12 years
- 6.3.2. 13-19 Years
- 6.3.3. 20-39 Years
- 6.3.4. 40-59 Years
- 6.3.5. Above 60 Years
- 6.1. Market Analysis, Insights and Forecast - by Type
- 7. North America Cruise Tourism Market Analysis, Insights and Forecast, 2020-2032
- 7.1. Market Analysis, Insights and Forecast - by Type
- 7.1.1. River Cruise
- 7.1.2. Ocean Cruise
- 7.1.3. Expedition Cruise
- 7.1.4. Theme Cruise
- 7.1.5. Adventure Cruise
- 7.1.6. Others
- 7.2. Market Analysis, Insights and Forecast - by Duration
- 7.2.1. 1-7Days
- 7.2.2. 8-14 Days
- 7.2.3. 15-20 Days
- 7.2.4. More than 21 Days
- 7.3. Market Analysis, Insights and Forecast - by Passenger Age
- 7.3.1. Less than 12 years
- 7.3.2. 13-19 Years
- 7.3.3. 20-39 Years
- 7.3.4. 40-59 Years
- 7.3.5. Above 60 Years
- 7.1. Market Analysis, Insights and Forecast - by Type
- 8. Europe Cruise Tourism Market Analysis, Insights and Forecast, 2020-2032
- 8.1. Market Analysis, Insights and Forecast - by Type
- 8.1.1. River Cruise
- 8.1.2. Ocean Cruise
- 8.1.3. Expedition Cruise
- 8.1.4. Theme Cruise
- 8.1.5. Adventure Cruise
- 8.1.6. Others
- 8.2. Market Analysis, Insights and Forecast - by Duration
- 8.2.1. 1-7Days
- 8.2.2. 8-14 Days
- 8.2.3. 15-20 Days
- 8.2.4. More than 21 Days
- 8.3. Market Analysis, Insights and Forecast - by Passenger Age
- 8.3.1. Less than 12 years
- 8.3.2. 13-19 Years
- 8.3.3. 20-39 Years
- 8.3.4. 40-59 Years
- 8.3.5. Above 60 Years
- 8.1. Market Analysis, Insights and Forecast - by Type
- 9. Asia Pacific Cruise Tourism Market Analysis, Insights and Forecast, 2020-2032
- 9.1. Market Analysis, Insights and Forecast - by Type
- 9.1.1. River Cruise
- 9.1.2. Ocean Cruise
- 9.1.3. Expedition Cruise
- 9.1.4. Theme Cruise
- 9.1.5. Adventure Cruise
- 9.1.6. Others
- 9.2. Market Analysis, Insights and Forecast - by Duration
- 9.2.1. 1-7Days
- 9.2.2. 8-14 Days
- 9.2.3. 15-20 Days
- 9.2.4. More than 21 Days
- 9.3. Market Analysis, Insights and Forecast - by Passenger Age
- 9.3.1. Less than 12 years
- 9.3.2. 13-19 Years
- 9.3.3. 20-39 Years
- 9.3.4. 40-59 Years
- 9.3.5. Above 60 Years
- 9.1. Market Analysis, Insights and Forecast - by Type
- 10. South America Cruise Tourism Market Analysis, Insights and Forecast, 2020-2032
- 10.1. Market Analysis, Insights and Forecast - by Type
- 10.1.1. River Cruise
- 10.1.2. Ocean Cruise
- 10.1.3. Expedition Cruise
- 10.1.4. Theme Cruise
- 10.1.5. Adventure Cruise
- 10.1.6. Others
- 10.2. Market Analysis, Insights and Forecast - by Duration
- 10.2.1. 1-7Days
- 10.2.2. 8-14 Days
- 10.2.3. 15-20 Days
- 10.2.4. More than 21 Days
- 10.3. Market Analysis, Insights and Forecast - by Passenger Age
- 10.3.1. Less than 12 years
- 10.3.2. 13-19 Years
- 10.3.3. 20-39 Years
- 10.3.4. 40-59 Years
- 10.3.5. Above 60 Years
- 10.1. Market Analysis, Insights and Forecast - by Type
- 11. Middle East Cruise Tourism Market Analysis, Insights and Forecast, 2020-2032
- 11.1. Market Analysis, Insights and Forecast - by Type
- 11.1.1. River Cruise
- 11.1.2. Ocean Cruise
- 11.1.3. Expedition Cruise
- 11.1.4. Theme Cruise
- 11.1.5. Adventure Cruise
- 11.1.6. Others
- 11.2. Market Analysis, Insights and Forecast - by Duration
- 11.2.1. 1-7Days
- 11.2.2. 8-14 Days
- 11.2.3. 15-20 Days
- 11.2.4. More than 21 Days
- 11.3. Market Analysis, Insights and Forecast - by Passenger Age
- 11.3.1. Less than 12 years
- 11.3.2. 13-19 Years
- 11.3.3. 20-39 Years
- 11.3.4. 40-59 Years
- 11.3.5. Above 60 Years
- 11.1. Market Analysis, Insights and Forecast - by Type
- 12. Competitive Analysis
- 12.1. Company Profiles
- 12.1.1 Princess Cruises
- 12.1.1.1. Company Overview
- 12.1.1.2. Products
- 12.1.1.3. Company Financials
- 12.1.1.4. SWOT Analysis
- 12.1.2 Carnival Corporation & Plc
- 12.1.2.1. Company Overview
- 12.1.2.2. Products
- 12.1.2.3. Company Financials
- 12.1.2.4. SWOT Analysis
- 12.1.3 Norwegian Cruise Line Holdings Ltd
- 12.1.3.1. Company Overview
- 12.1.3.2. Products
- 12.1.3.3. Company Financials
- 12.1.3.4. SWOT Analysis
- 12.1.4 Royal Caribbean Group
- 12.1.4.1. Company Overview
- 12.1.4.2. Products
- 12.1.4.3. Company Financials
- 12.1.4.4. SWOT Analysis
- 12.1.5 Celebrity Cruises
- 12.1.5.1. Company Overview
- 12.1.5.2. Products
- 12.1.5.3. Company Financials
- 12.1.5.4. SWOT Analysis
- 12.1.6 Costa Cruises
- 12.1.6.1. Company Overview
- 12.1.6.2. Products
- 12.1.6.3. Company Financials
- 12.1.6.4. SWOT Analysis
- 12.1.7 Holland America Line
- 12.1.7.1. Company Overview
- 12.1.7.2. Products
- 12.1.7.3. Company Financials
- 12.1.7.4. SWOT Analysis
- 12.1.8 MSC Cruises
- 12.1.8.1. Company Overview
- 12.1.8.2. Products
- 12.1.8.3. Company Financials
- 12.1.8.4. SWOT Analysis
- 12.1.9 Disney Cruise Line
- 12.1.9.1. Company Overview
- 12.1.9.2. Products
- 12.1.9.3. Company Financials
- 12.1.9.4. SWOT Analysis
- 12.1.10 Cunard Line**List Not Exhaustive
- 12.1.10.1. Company Overview
- 12.1.10.2. Products
- 12.1.10.3. Company Financials
- 12.1.10.4. SWOT Analysis
- 12.1.1 Princess Cruises
- 12.2. Market Entropy
- 12.2.1 Company's Key Areas Served
- 12.2.2 Recent Developments
- 12.3. Company Market Share Analysis 2025
- 12.3.1 Top 5 Companies Market Share Analysis
- 12.3.2 Top 3 Companies Market Share Analysis
- 12.4. List of Potential Customers
- 13. Research Methodology
List of Figures
- Figure 1: Global Cruise Tourism Market Revenue Breakdown (Million, %) by Region 2025 & 2033
- Figure 2: North America Cruise Tourism Market Revenue (Million), by Type 2025 & 2033
- Figure 3: North America Cruise Tourism Market Revenue Share (%), by Type 2025 & 2033
- Figure 4: North America Cruise Tourism Market Revenue (Million), by Duration 2025 & 2033
- Figure 5: North America Cruise Tourism Market Revenue Share (%), by Duration 2025 & 2033
- Figure 6: North America Cruise Tourism Market Revenue (Million), by Passenger Age 2025 & 2033
- Figure 7: North America Cruise Tourism Market Revenue Share (%), by Passenger Age 2025 & 2033
- Figure 8: North America Cruise Tourism Market Revenue (Million), by Country 2025 & 2033
- Figure 9: North America Cruise Tourism Market Revenue Share (%), by Country 2025 & 2033
- Figure 10: Europe Cruise Tourism Market Revenue (Million), by Type 2025 & 2033
- Figure 11: Europe Cruise Tourism Market Revenue Share (%), by Type 2025 & 2033
- Figure 12: Europe Cruise Tourism Market Revenue (Million), by Duration 2025 & 2033
- Figure 13: Europe Cruise Tourism Market Revenue Share (%), by Duration 2025 & 2033
- Figure 14: Europe Cruise Tourism Market Revenue (Million), by Passenger Age 2025 & 2033
- Figure 15: Europe Cruise Tourism Market Revenue Share (%), by Passenger Age 2025 & 2033
- Figure 16: Europe Cruise Tourism Market Revenue (Million), by Country 2025 & 2033
- Figure 17: Europe Cruise Tourism Market Revenue Share (%), by Country 2025 & 2033
- Figure 18: Asia Pacific Cruise Tourism Market Revenue (Million), by Type 2025 & 2033
- Figure 19: Asia Pacific Cruise Tourism Market Revenue Share (%), by Type 2025 & 2033
- Figure 20: Asia Pacific Cruise Tourism Market Revenue (Million), by Duration 2025 & 2033
- Figure 21: Asia Pacific Cruise Tourism Market Revenue Share (%), by Duration 2025 & 2033
- Figure 22: Asia Pacific Cruise Tourism Market Revenue (Million), by Passenger Age 2025 & 2033
- Figure 23: Asia Pacific Cruise Tourism Market Revenue Share (%), by Passenger Age 2025 & 2033
- Figure 24: Asia Pacific Cruise Tourism Market Revenue (Million), by Country 2025 & 2033
- Figure 25: Asia Pacific Cruise Tourism Market Revenue Share (%), by Country 2025 & 2033
- Figure 26: South America Cruise Tourism Market Revenue (Million), by Type 2025 & 2033
- Figure 27: South America Cruise Tourism Market Revenue Share (%), by Type 2025 & 2033
- Figure 28: South America Cruise Tourism Market Revenue (Million), by Duration 2025 & 2033
- Figure 29: South America Cruise Tourism Market Revenue Share (%), by Duration 2025 & 2033
- Figure 30: South America Cruise Tourism Market Revenue (Million), by Passenger Age 2025 & 2033
- Figure 31: South America Cruise Tourism Market Revenue Share (%), by Passenger Age 2025 & 2033
- Figure 32: South America Cruise Tourism Market Revenue (Million), by Country 2025 & 2033
- Figure 33: South America Cruise Tourism Market Revenue Share (%), by Country 2025 & 2033
- Figure 34: Middle East Cruise Tourism Market Revenue (Million), by Type 2025 & 2033
- Figure 35: Middle East Cruise Tourism Market Revenue Share (%), by Type 2025 & 2033
- Figure 36: Middle East Cruise Tourism Market Revenue (Million), by Duration 2025 & 2033
- Figure 37: Middle East Cruise Tourism Market Revenue Share (%), by Duration 2025 & 2033
- Figure 38: Middle East Cruise Tourism Market Revenue (Million), by Passenger Age 2025 & 2033
- Figure 39: Middle East Cruise Tourism Market Revenue Share (%), by Passenger Age 2025 & 2033
- Figure 40: Middle East Cruise Tourism Market Revenue (Million), by Country 2025 & 2033
- Figure 41: Middle East Cruise Tourism Market Revenue Share (%), by Country 2025 & 2033
List of Tables
- Table 1: Global Cruise Tourism Market Revenue Million Forecast, by Type 2020 & 2033
- Table 2: Global Cruise Tourism Market Revenue Million Forecast, by Duration 2020 & 2033
- Table 3: Global Cruise Tourism Market Revenue Million Forecast, by Passenger Age 2020 & 2033
- Table 4: Global Cruise Tourism Market Revenue Million Forecast, by Region 2020 & 2033
- Table 5: Global Cruise Tourism Market Revenue Million Forecast, by Type 2020 & 2033
- Table 6: Global Cruise Tourism Market Revenue Million Forecast, by Duration 2020 & 2033
- Table 7: Global Cruise Tourism Market Revenue Million Forecast, by Passenger Age 2020 & 2033
- Table 8: Global Cruise Tourism Market Revenue Million Forecast, by Country 2020 & 2033
- Table 9: US Cruise Tourism Market Revenue (Million) Forecast, by Application 2020 & 2033
- Table 10: Canada Cruise Tourism Market Revenue (Million) Forecast, by Application 2020 & 2033
- Table 11: Mexico Cruise Tourism Market Revenue (Million) Forecast, by Application 2020 & 2033
- Table 12: Rest of North America Cruise Tourism Market Revenue (Million) Forecast, by Application 2020 & 2033
- Table 13: Global Cruise Tourism Market Revenue Million Forecast, by Type 2020 & 2033
- Table 14: Global Cruise Tourism Market Revenue Million Forecast, by Duration 2020 & 2033
- Table 15: Global Cruise Tourism Market Revenue Million Forecast, by Passenger Age 2020 & 2033
- Table 16: Global Cruise Tourism Market Revenue Million Forecast, by Country 2020 & 2033
- Table 17: Germany Cruise Tourism Market Revenue (Million) Forecast, by Application 2020 & 2033
- Table 18: UK Cruise Tourism Market Revenue (Million) Forecast, by Application 2020 & 2033
- Table 19: France Cruise Tourism Market Revenue (Million) Forecast, by Application 2020 & 2033
- Table 20: Russia Cruise Tourism Market Revenue (Million) Forecast, by Application 2020 & 2033
- Table 21: Spain Cruise Tourism Market Revenue (Million) Forecast, by Application 2020 & 2033
- Table 22: Rest of Europe Cruise Tourism Market Revenue (Million) Forecast, by Application 2020 & 2033
- Table 23: Global Cruise Tourism Market Revenue Million Forecast, by Type 2020 & 2033
- Table 24: Global Cruise Tourism Market Revenue Million Forecast, by Duration 2020 & 2033
- Table 25: Global Cruise Tourism Market Revenue Million Forecast, by Passenger Age 2020 & 2033
- Table 26: Global Cruise Tourism Market Revenue Million Forecast, by Country 2020 & 2033
- Table 27: India Cruise Tourism Market Revenue (Million) Forecast, by Application 2020 & 2033
- Table 28: China Cruise Tourism Market Revenue (Million) Forecast, by Application 2020 & 2033
- Table 29: Japan Cruise Tourism Market Revenue (Million) Forecast, by Application 2020 & 2033
- Table 30: Rest of Asia Pacific Cruise Tourism Market Revenue (Million) Forecast, by Application 2020 & 2033
- Table 31: Global Cruise Tourism Market Revenue Million Forecast, by Type 2020 & 2033
- Table 32: Global Cruise Tourism Market Revenue Million Forecast, by Duration 2020 & 2033
- Table 33: Global Cruise Tourism Market Revenue Million Forecast, by Passenger Age 2020 & 2033
- Table 34: Global Cruise Tourism Market Revenue Million Forecast, by Country 2020 & 2033
- Table 35: Brazil Cruise Tourism Market Revenue (Million) Forecast, by Application 2020 & 2033
- Table 36: Argentina Cruise Tourism Market Revenue (Million) Forecast, by Application 2020 & 2033
- Table 37: Rest of South America Cruise Tourism Market Revenue (Million) Forecast, by Application 2020 & 2033
- Table 38: Global Cruise Tourism Market Revenue Million Forecast, by Type 2020 & 2033
- Table 39: Global Cruise Tourism Market Revenue Million Forecast, by Duration 2020 & 2033
- Table 40: Global Cruise Tourism Market Revenue Million Forecast, by Passenger Age 2020 & 2033
- Table 41: Global Cruise Tourism Market Revenue Million Forecast, by Country 2020 & 2033
- Table 42: UAE Cruise Tourism Market Revenue (Million) Forecast, by Application 2020 & 2033
- Table 43: Saudi Arabia Cruise Tourism Market Revenue (Million) Forecast, by Application 2020 & 2033
- Table 44: Rest of Middle East Cruise Tourism Market Revenue (Million) Forecast, by Application 2020 & 2033
Frequently Asked Questions
1. What is the projected Compound Annual Growth Rate (CAGR) of the Cruise Tourism Market?
The projected CAGR is approximately 8.67%.
2. Which companies are prominent players in the Cruise Tourism Market?
Key companies in the market include Princess Cruises, Carnival Corporation & Plc, Norwegian Cruise Line Holdings Ltd, Royal Caribbean Group, Celebrity Cruises, Costa Cruises, Holland America Line, MSC Cruises, Disney Cruise Line, Cunard Line**List Not Exhaustive.
3. What are the main segments of the Cruise Tourism Market?
The market segments include Type, Duration, Passenger Age.
4. Can you provide details about the market size?
The market size is estimated to be USD 9.44 Million as of 2022.
5. What are some drivers contributing to market growth?
Increasing Disposable Income is Driving the Market.
6. What are the notable trends driving market growth?
Increase in Number of Ocean Cruise Passengers in North America.
7. Are there any restraints impacting market growth?
High Costs is Restraining the Market.
8. Can you provide examples of recent developments in the market?
November 2023: TravClan and Resorts World Cruises joined forces in a groundbreaking partnership aimed at revolutionizing cruise tourism in India. Through this collaboration, TravClan embarks on a transformative journey that promises to redefine the landscape of cruise vacations in India, ensuring accessibility and affordability for all.
9. What pricing options are available for accessing the report?
Pricing options include single-user, multi-user, and enterprise licenses priced at USD 4750, USD 5250, and USD 8750 respectively.
10. Is the market size provided in terms of value or volume?
The market size is provided in terms of value, measured in Million.
11. Are there any specific market keywords associated with the report?
Yes, the market keyword associated with the report is "Cruise Tourism Market," which aids in identifying and referencing the specific market segment covered.
12. How do I determine which pricing option suits my needs best?
The pricing options vary based on user requirements and access needs. Individual users may opt for single-user licenses, while businesses requiring broader access may choose multi-user or enterprise licenses for cost-effective access to the report.
13. Are there any additional resources or data provided in the Cruise Tourism Market report?
While the report offers comprehensive insights, it's advisable to review the specific contents or supplementary materials provided to ascertain if additional resources or data are available.
14. How can I stay updated on further developments or reports in the Cruise Tourism Market?
To stay informed about further developments, trends, and reports in the Cruise Tourism Market, consider subscribing to industry newsletters, following relevant companies and organizations, or regularly checking reputable industry news sources and publications.
Methodology
Step 1 - Identification of Relevant Samples Size from Population Database


Step 2 - Approaches for Defining Global Market Size (Value, Volume* & Price*)

Note*: In applicable scenarios
Step 3 - Data Sources
Primary Research
- Web Analytics
- Survey Reports
- Research Institute
- Latest Research Reports
- Opinion Leaders
Secondary Research
- Annual Reports
- White Paper
- Latest Press Release
- Industry Association
- Paid Database
- Investor Presentations

Step 4 - Data Triangulation
Involves using different sources of information in order to increase the validity of a study
These sources are likely to be stakeholders in a program - participants, other researchers, program staff, other community members, and so on.
Then we put all data in single framework & apply various statistical tools to find out the dynamic on the market.
During the analysis stage, feedback from the stakeholder groups would be compared to determine areas of agreement as well as areas of divergence