

Key Insights
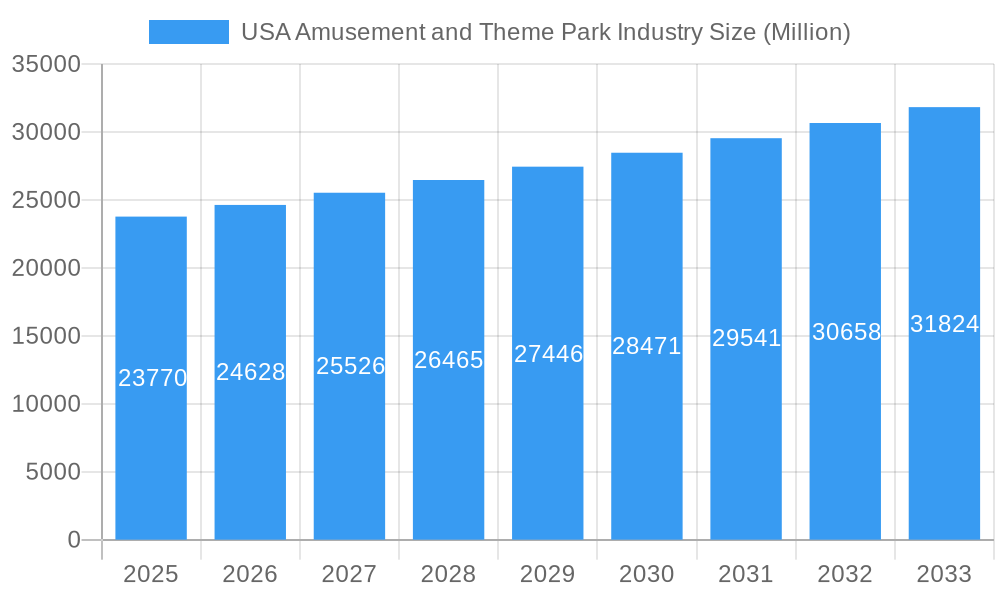
The US amusement and theme park industry, a significant contributor to the entertainment sector, is experiencing robust growth. With a 2025 market size of $23.77 billion and a Compound Annual Growth Rate (CAGR) exceeding 3.50%, the industry is projected to reach substantial heights by 2033. Several factors drive this expansion, including rising disposable incomes, increasing tourism, technological advancements enhancing the visitor experience (e.g., immersive technologies and personalized offerings), and the enduring appeal of family-friendly entertainment. The industry's segmentation, encompassing land and water rides, diverse revenue streams (tickets, food & beverage, merchandise, hospitality), and geographically dispersed operations across the United States (Northeast, Southeast, Midwest, Southwest, West), contributes to its resilience and growth potential. While challenges like economic fluctuations and competition exist, the industry’s ability to innovate and cater to evolving consumer preferences positions it for continued success.
USA Amusement and Theme Park Industry Market Size (In Billion)
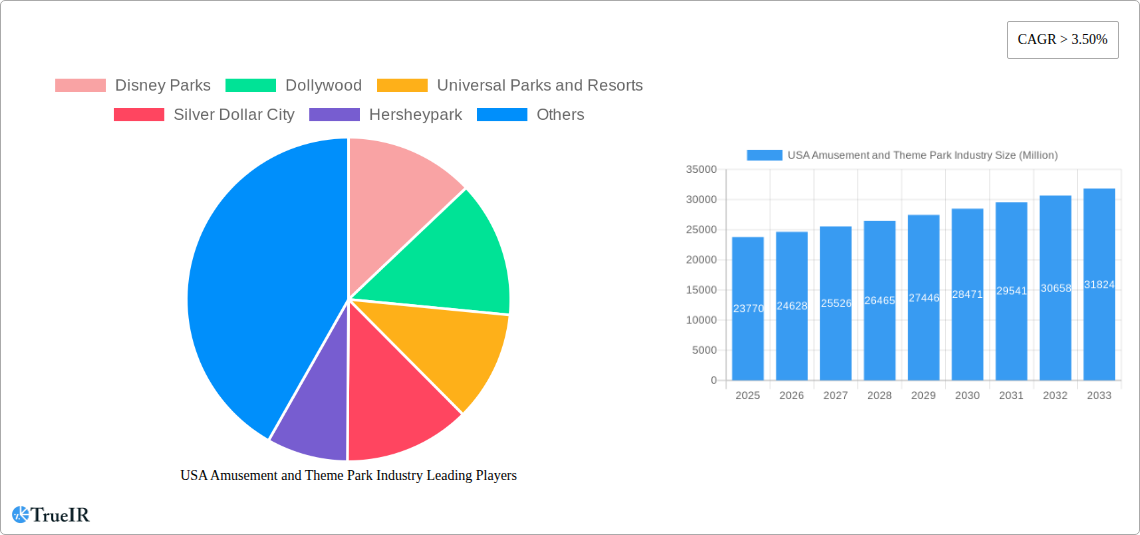
However, the industry faces certain constraints. Seasonal variations in attendance, rising operational costs (including labor and maintenance), and the need for continuous investment in new attractions to maintain visitor interest present ongoing challenges. Competition amongst established players like Disney Parks, Universal Parks and Resorts, Six Flags, and regional parks like Dollywood and Silver Dollar City necessitates ongoing innovation and strategic marketing. The industry's response to these challenges involves strategic pricing models, diversification of revenue streams, and targeted marketing campaigns to attract diverse demographic groups. The successful players will be those who effectively manage costs, adapt to changing consumer preferences, and leverage technological advancements to enhance the overall guest experience, creating memorable and repeat visits.
USA Amusement and Theme Park Industry Company Market Share
USA Amusement and Theme Park Industry Report: 2019-2033
This comprehensive report provides a detailed analysis of the USA amusement and theme park industry, covering market size, trends, competitive landscape, and future outlook from 2019 to 2033. The study period spans 2019-2024 (Historical Period), with 2025 as the base and estimated year. The forecast period extends to 2033. This report is crucial for investors, industry professionals, and anyone seeking a deep understanding of this dynamic sector. The analysis includes key players like Disney Parks, Universal Parks & Resorts, Six Flags Inc., and many more, providing a complete view of the market's structure and performance. Expect detailed segmentation by ride type (land, water, other) and revenue source (tickets, food & beverage, merchandise, hospitality, and other). The report incorporates recent industry milestones, enabling informed strategic decision-making.
USA Amusement and Theme Park Industry Market Structure & Competitive Landscape
The US amusement and theme park industry exhibits a moderately concentrated market structure, dominated by a few large players like Disney Parks, Universal Parks & Resorts, and Six Flags Inc. However, regional players and smaller niche parks also contribute significantly to the overall market. The Herfindahl-Hirschman Index (HHI) for 2024 is estimated at xx, indicating a moderately concentrated market. Innovation drivers include technological advancements in ride technology, immersive experiences (e.g., virtual reality integration), and enhanced guest services (e.g., mobile ordering, personalized experiences). Regulatory impacts, particularly concerning safety standards and environmental regulations, significantly influence operational costs and expansion strategies. Product substitutes include other forms of entertainment such as gaming, sporting events, and home entertainment systems. The industry witnesses considerable M&A activity, with recent deals focused on expansion, diversification, and accessing new technologies. The total value of M&A transactions in 2024 was approximately $xx Million. End-user segmentation is primarily based on demographics (age, income, family structure), with a substantial portion of revenue generated from family visits.
- Market Concentration: Moderately concentrated, with a few dominant players and numerous smaller players. HHI (2024): xx
- Innovation Drivers: Technological advancements in ride technology, immersive experiences, and enhanced guest services.
- Regulatory Impacts: Safety standards, environmental regulations, and labor laws impact operational costs.
- Product Substitutes: Gaming, sporting events, and home entertainment compete for consumer spending.
- M&A Trends: Significant activity focusing on expansion, diversification, and technological access. Total M&A value in 2024: $xx Million.
- End-User Segmentation: Primarily based on demographics (age, income, family size).
USA Amusement and Theme Park Industry Market Trends & Opportunities
The US amusement and theme park industry is experiencing steady growth, driven by increasing disposable incomes, a rising preference for leisure activities, and continuous innovation. The market size was valued at $xx Million in 2024 and is projected to reach $xx Million by 2033, exhibiting a CAGR of xx% during the forecast period. Technological advancements, such as the incorporation of augmented reality and virtual reality experiences, enhance customer engagement and create new revenue streams. Consumer preferences are shifting towards personalized experiences, themed attractions, and enhanced safety and hygiene protocols. The competitive dynamics are characterized by intense rivalry among major players, necessitating continuous innovation and strategic investments to maintain market share. Market penetration rates for theme parks remain relatively high in urban and suburban areas, with untapped potential in rural areas and under-served demographics.
Dominant Markets & Segments in USA Amusement and Theme Park Industry
The Florida and California regions dominate the US amusement and theme park market, owing to the presence of major players like Disney Parks and Universal Parks & Resorts. Within market segmentation, land rides continue to be the most significant revenue generator, followed by water rides and other types of attractions. Ticket sales constitute the largest source of revenue, followed by food and beverages, merchandise, and hospitality services.
Key Growth Drivers:
- Florida and California: Established tourist destinations with high visitor traffic.
- Land Rides: High demand and diverse offerings, including thrill rides and family-friendly attractions.
- Ticket Sales: Primary revenue source, enhanced by dynamic pricing and bundled offerings.
- Infrastructure Investments: Continued infrastructure development and expansion support the growth.
Market Dominance Analysis: Florida and California benefit from existing tourism infrastructure and a large pool of potential visitors. Land rides benefit from consistently high demand and the opportunity to expand with innovative technology. Ticket sales benefit from effective pricing strategies and the bundling of various offerings.
USA Amusement and Theme Park Industry Product Analysis
Product innovations focus on enhancing guest experience through technological advancements, such as immersive storytelling, interactive rides, and personalized mobile apps. These innovations aim to create more engaging and memorable experiences, leading to increased customer satisfaction and repeat visits. Competitive advantages are derived from unique themed experiences, high-quality ride technologies, and effective marketing strategies.
Key Drivers, Barriers & Challenges in USA Amusement and Theme Park Industry
Key Drivers: Rising disposable incomes, increasing demand for leisure activities, technological advancements (VR, AR), and strategic investments in new attractions propel market growth.
Challenges: Economic downturns, intense competition, seasonality, regulatory hurdles (safety standards, environmental concerns), and supply chain disruptions pose significant challenges. For example, fluctuating fuel costs can substantially impact operational expenses.
Growth Drivers in the USA Amusement and Theme Park Industry Market
Continued innovation in ride technology, increasing disposable incomes fueling leisure spending, and the development of immersive experiences drive market growth. Strategic marketing and expansion into new locations also play a crucial role.
Challenges Impacting USA Amusement and Theme Park Industry Growth
Economic recessions significantly impact disposable income, reducing consumer spending on leisure activities. Intense competition for market share requires continuous investment in innovative attractions and experiences. Regulatory compliance with safety and environmental standards adds to operational costs.
Key Players Shaping the USA Amusement and Theme Park Industry Market
- Disney Parks
- Dollywood
- Universal Parks and Resorts
- Silver Dollar City
- Hersheypark
- Six Flags Inc
- Busch Gardens
- The Island in Pigeon Forge
- Cedar Fair Entertainment Company
- Magic Kingdom Park
- Dells Waterpark
- Seaworld Parks and Entertainment
Significant USA Amusement and Theme Park Industry Industry Milestones
- July 2023: Asacha Media Group acquired a majority share in Arrow International Media, the producer of Disney's Animal Kingdom, impacting Disney's operational structure and potentially influencing future attraction development.
- September 2023: Crescent Real Estate LLC acquired the Element Orlando Universal Blvd. hotel, enhancing lodging options near Universal Studios and Icon Park, boosting visitor accessibility and potentially increasing tourism.
Future Outlook for USA Amusement and Theme Park Industry Market
The US amusement and theme park industry is poised for continued growth, driven by technological innovations, increasing consumer demand, and strategic investments by major players. Opportunities exist in expanding into new markets, enhancing guest experiences through technological integration, and developing sustainable and environmentally friendly operations. The market is expected to show strong growth in the coming years, driven by factors such as increased disposable income, a growing population, and a rise in tourism.
USA Amusement and Theme Park Industry Segmentation
-
1. Type
- 1.1. Land Rides
- 1.2. Water Rides
- 1.3. Other Types
-
2. Source of Revenue
- 2.1. Tickets
- 2.2. Foods & Beverages
- 2.3. Merchandise
- 2.4. Hospitality
- 2.5. Other Source of Revenues
USA Amusement and Theme Park Industry Segmentation By Geography
-
1. North America
- 1.1. United States
- 1.2. Canada
- 1.3. Mexico
-
2. South America
- 2.1. Brazil
- 2.2. Argentina
- 2.3. Rest of South America
-
3. Europe
- 3.1. United Kingdom
- 3.2. Germany
- 3.3. France
- 3.4. Italy
- 3.5. Spain
- 3.6. Russia
- 3.7. Benelux
- 3.8. Nordics
- 3.9. Rest of Europe
-
4. Middle East & Africa
- 4.1. Turkey
- 4.2. Israel
- 4.3. GCC
- 4.4. North Africa
- 4.5. South Africa
- 4.6. Rest of Middle East & Africa
-
5. Asia Pacific
- 5.1. China
- 5.2. India
- 5.3. Japan
- 5.4. South Korea
- 5.5. ASEAN
- 5.6. Oceania
- 5.7. Rest of Asia Pacific
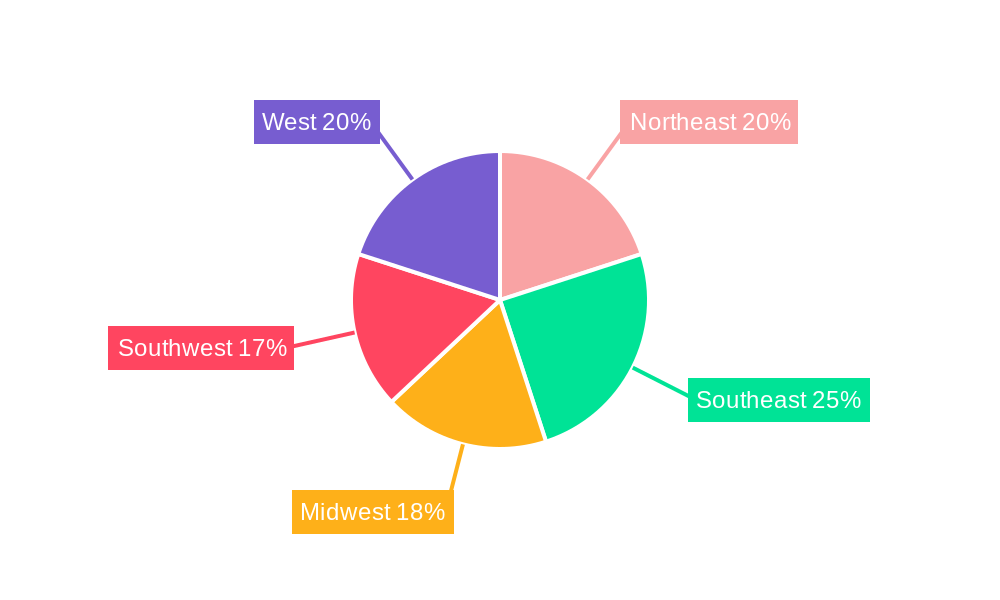
USA Amusement and Theme Park Industry Regional Market Share
Geographic Coverage of USA Amusement and Theme Park Industry
USA Amusement and Theme Park Industry REPORT HIGHLIGHTS
| Aspects | Details |
|---|---|
| Study Period | 2020-2034 |
| Base Year | 2025 |
| Estimated Year | 2026 |
| Forecast Period | 2026-2034 |
| Historical Period | 2020-2025 |
| Growth Rate | CAGR of > 3.50% from 2020-2034 |
| Segmentation |
|
Table of Contents
- 1. Introduction
- 1.1. Research Scope
- 1.2. Market Segmentation
- 1.3. Research Objective
- 1.4. Definitions and Assumptions
- 2. Executive Summary
- 2.1. Market Snapshot
- 3. Market Dynamics
- 3.1. Market Drivers
- 3.2. Market Restrains
- 3.3. Market Trends
- 3.4. Market Opportunities
- 4. Market Factor Analysis
- 4.1. Porters Five Forces
- 4.1.1. Bargaining Power of Suppliers
- 4.1.2. Bargaining Power of Buyers
- 4.1.3. Threat of New Entrants
- 4.1.4. Threat of Substitutes
- 4.1.5. Competitive Rivalry
- 4.2. PESTEL analysis
- 4.3. BCG Analysis
- 4.3.1. Stars (High Growth, High Market Share)
- 4.3.2. Cash Cows (Low Growth, High Market Share)
- 4.3.3. Question Mark (High Growth, Low Market Share)
- 4.3.4. Dogs (Low Growth, Low Market Share)
- 4.4. Ansoff Matrix Analysis
- 4.5. Supply Chain Analysis
- 4.6. Regulatory Landscape
- 4.7. Current Market Potential and Opportunity Assessment (TAM–SAM–SOM Framework)
- 4.8. TIR Analyst Note
- 4.1. Porters Five Forces
- 5. Market Analysis, Insights and Forecast 2021-2033
- 5.1. Market Analysis, Insights and Forecast - by Type
- 5.1.1. Land Rides
- 5.1.2. Water Rides
- 5.1.3. Other Types
- 5.2. Market Analysis, Insights and Forecast - by Source of Revenue
- 5.2.1. Tickets
- 5.2.2. Foods & Beverages
- 5.2.3. Merchandise
- 5.2.4. Hospitality
- 5.2.5. Other Source of Revenues
- 5.3. Market Analysis, Insights and Forecast - by Region
- 5.3.1. North America
- 5.3.2. South America
- 5.3.3. Europe
- 5.3.4. Middle East & Africa
- 5.3.5. Asia Pacific
- 5.1. Market Analysis, Insights and Forecast - by Type
- 6. Global USA Amusement and Theme Park Industry Analysis, Insights and Forecast, 2021-2033
- 6.1. Market Analysis, Insights and Forecast - by Type
- 6.1.1. Land Rides
- 6.1.2. Water Rides
- 6.1.3. Other Types
- 6.2. Market Analysis, Insights and Forecast - by Source of Revenue
- 6.2.1. Tickets
- 6.2.2. Foods & Beverages
- 6.2.3. Merchandise
- 6.2.4. Hospitality
- 6.2.5. Other Source of Revenues
- 6.1. Market Analysis, Insights and Forecast - by Type
- 7. North America USA Amusement and Theme Park Industry Analysis, Insights and Forecast, 2020-2032
- 7.1. Market Analysis, Insights and Forecast - by Type
- 7.1.1. Land Rides
- 7.1.2. Water Rides
- 7.1.3. Other Types
- 7.2. Market Analysis, Insights and Forecast - by Source of Revenue
- 7.2.1. Tickets
- 7.2.2. Foods & Beverages
- 7.2.3. Merchandise
- 7.2.4. Hospitality
- 7.2.5. Other Source of Revenues
- 7.1. Market Analysis, Insights and Forecast - by Type
- 8. South America USA Amusement and Theme Park Industry Analysis, Insights and Forecast, 2020-2032
- 8.1. Market Analysis, Insights and Forecast - by Type
- 8.1.1. Land Rides
- 8.1.2. Water Rides
- 8.1.3. Other Types
- 8.2. Market Analysis, Insights and Forecast - by Source of Revenue
- 8.2.1. Tickets
- 8.2.2. Foods & Beverages
- 8.2.3. Merchandise
- 8.2.4. Hospitality
- 8.2.5. Other Source of Revenues
- 8.1. Market Analysis, Insights and Forecast - by Type
- 9. Europe USA Amusement and Theme Park Industry Analysis, Insights and Forecast, 2020-2032
- 9.1. Market Analysis, Insights and Forecast - by Type
- 9.1.1. Land Rides
- 9.1.2. Water Rides
- 9.1.3. Other Types
- 9.2. Market Analysis, Insights and Forecast - by Source of Revenue
- 9.2.1. Tickets
- 9.2.2. Foods & Beverages
- 9.2.3. Merchandise
- 9.2.4. Hospitality
- 9.2.5. Other Source of Revenues
- 9.1. Market Analysis, Insights and Forecast - by Type
- 10. Middle East & Africa USA Amusement and Theme Park Industry Analysis, Insights and Forecast, 2020-2032
- 10.1. Market Analysis, Insights and Forecast - by Type
- 10.1.1. Land Rides
- 10.1.2. Water Rides
- 10.1.3. Other Types
- 10.2. Market Analysis, Insights and Forecast - by Source of Revenue
- 10.2.1. Tickets
- 10.2.2. Foods & Beverages
- 10.2.3. Merchandise
- 10.2.4. Hospitality
- 10.2.5. Other Source of Revenues
- 10.1. Market Analysis, Insights and Forecast - by Type
- 11. Asia Pacific USA Amusement and Theme Park Industry Analysis, Insights and Forecast, 2020-2032
- 11.1. Market Analysis, Insights and Forecast - by Type
- 11.1.1. Land Rides
- 11.1.2. Water Rides
- 11.1.3. Other Types
- 11.2. Market Analysis, Insights and Forecast - by Source of Revenue
- 11.2.1. Tickets
- 11.2.2. Foods & Beverages
- 11.2.3. Merchandise
- 11.2.4. Hospitality
- 11.2.5. Other Source of Revenues
- 11.1. Market Analysis, Insights and Forecast - by Type
- 12. Competitive Analysis
- 12.1. Company Profiles
- 12.1.1 Disney Parks
- 12.1.1.1. Company Overview
- 12.1.1.2. Products
- 12.1.1.3. Company Financials
- 12.1.1.4. SWOT Analysis
- 12.1.2 Dollywood
- 12.1.2.1. Company Overview
- 12.1.2.2. Products
- 12.1.2.3. Company Financials
- 12.1.2.4. SWOT Analysis
- 12.1.3 Universal Parks and Resorts
- 12.1.3.1. Company Overview
- 12.1.3.2. Products
- 12.1.3.3. Company Financials
- 12.1.3.4. SWOT Analysis
- 12.1.4 Silver Dollar City
- 12.1.4.1. Company Overview
- 12.1.4.2. Products
- 12.1.4.3. Company Financials
- 12.1.4.4. SWOT Analysis
- 12.1.5 Hersheypark
- 12.1.5.1. Company Overview
- 12.1.5.2. Products
- 12.1.5.3. Company Financials
- 12.1.5.4. SWOT Analysis
- 12.1.6 Six Flags Inc
- 12.1.6.1. Company Overview
- 12.1.6.2. Products
- 12.1.6.3. Company Financials
- 12.1.6.4. SWOT Analysis
- 12.1.7 Busch Garden
- 12.1.7.1. Company Overview
- 12.1.7.2. Products
- 12.1.7.3. Company Financials
- 12.1.7.4. SWOT Analysis
- 12.1.8 The Island in Pigeon Forge
- 12.1.8.1. Company Overview
- 12.1.8.2. Products
- 12.1.8.3. Company Financials
- 12.1.8.4. SWOT Analysis
- 12.1.9 Cedar Fair Entertainment Company
- 12.1.9.1. Company Overview
- 12.1.9.2. Products
- 12.1.9.3. Company Financials
- 12.1.9.4. SWOT Analysis
- 12.1.10 Magic Kingdom Park
- 12.1.10.1. Company Overview
- 12.1.10.2. Products
- 12.1.10.3. Company Financials
- 12.1.10.4. SWOT Analysis
- 12.1.11 Dells Waterpark**List Not Exhaustive
- 12.1.11.1. Company Overview
- 12.1.11.2. Products
- 12.1.11.3. Company Financials
- 12.1.11.4. SWOT Analysis
- 12.1.12 Seaworld Parks and Entertainment
- 12.1.12.1. Company Overview
- 12.1.12.2. Products
- 12.1.12.3. Company Financials
- 12.1.12.4. SWOT Analysis
- 12.1.1 Disney Parks
- 12.2. Market Entropy
- 12.2.1 Company's Key Areas Served
- 12.2.2 Recent Developments
- 12.3. Company Market Share Analysis 2025
- 12.3.1 Top 5 Companies Market Share Analysis
- 12.3.2 Top 3 Companies Market Share Analysis
- 12.4. List of Potential Customers
- 13. Research Methodology
List of Figures
- Figure 1: Global USA Amusement and Theme Park Industry Revenue Breakdown (Million, %) by Region 2025 & 2033
- Figure 2: North America USA Amusement and Theme Park Industry Revenue (Million), by Type 2025 & 2033
- Figure 3: North America USA Amusement and Theme Park Industry Revenue Share (%), by Type 2025 & 2033
- Figure 4: North America USA Amusement and Theme Park Industry Revenue (Million), by Source of Revenue 2025 & 2033
- Figure 5: North America USA Amusement and Theme Park Industry Revenue Share (%), by Source of Revenue 2025 & 2033
- Figure 6: North America USA Amusement and Theme Park Industry Revenue (Million), by Country 2025 & 2033
- Figure 7: North America USA Amusement and Theme Park Industry Revenue Share (%), by Country 2025 & 2033
- Figure 8: South America USA Amusement and Theme Park Industry Revenue (Million), by Type 2025 & 2033
- Figure 9: South America USA Amusement and Theme Park Industry Revenue Share (%), by Type 2025 & 2033
- Figure 10: South America USA Amusement and Theme Park Industry Revenue (Million), by Source of Revenue 2025 & 2033
- Figure 11: South America USA Amusement and Theme Park Industry Revenue Share (%), by Source of Revenue 2025 & 2033
- Figure 12: South America USA Amusement and Theme Park Industry Revenue (Million), by Country 2025 & 2033
- Figure 13: South America USA Amusement and Theme Park Industry Revenue Share (%), by Country 2025 & 2033
- Figure 14: Europe USA Amusement and Theme Park Industry Revenue (Million), by Type 2025 & 2033
- Figure 15: Europe USA Amusement and Theme Park Industry Revenue Share (%), by Type 2025 & 2033
- Figure 16: Europe USA Amusement and Theme Park Industry Revenue (Million), by Source of Revenue 2025 & 2033
- Figure 17: Europe USA Amusement and Theme Park Industry Revenue Share (%), by Source of Revenue 2025 & 2033
- Figure 18: Europe USA Amusement and Theme Park Industry Revenue (Million), by Country 2025 & 2033
- Figure 19: Europe USA Amusement and Theme Park Industry Revenue Share (%), by Country 2025 & 2033
- Figure 20: Middle East & Africa USA Amusement and Theme Park Industry Revenue (Million), by Type 2025 & 2033
- Figure 21: Middle East & Africa USA Amusement and Theme Park Industry Revenue Share (%), by Type 2025 & 2033
- Figure 22: Middle East & Africa USA Amusement and Theme Park Industry Revenue (Million), by Source of Revenue 2025 & 2033
- Figure 23: Middle East & Africa USA Amusement and Theme Park Industry Revenue Share (%), by Source of Revenue 2025 & 2033
- Figure 24: Middle East & Africa USA Amusement and Theme Park Industry Revenue (Million), by Country 2025 & 2033
- Figure 25: Middle East & Africa USA Amusement and Theme Park Industry Revenue Share (%), by Country 2025 & 2033
- Figure 26: Asia Pacific USA Amusement and Theme Park Industry Revenue (Million), by Type 2025 & 2033
- Figure 27: Asia Pacific USA Amusement and Theme Park Industry Revenue Share (%), by Type 2025 & 2033
- Figure 28: Asia Pacific USA Amusement and Theme Park Industry Revenue (Million), by Source of Revenue 2025 & 2033
- Figure 29: Asia Pacific USA Amusement and Theme Park Industry Revenue Share (%), by Source of Revenue 2025 & 2033
- Figure 30: Asia Pacific USA Amusement and Theme Park Industry Revenue (Million), by Country 2025 & 2033
- Figure 31: Asia Pacific USA Amusement and Theme Park Industry Revenue Share (%), by Country 2025 & 2033
List of Tables
- Table 1: Global USA Amusement and Theme Park Industry Revenue Million Forecast, by Type 2020 & 2033
- Table 2: Global USA Amusement and Theme Park Industry Revenue Million Forecast, by Source of Revenue 2020 & 2033
- Table 3: Global USA Amusement and Theme Park Industry Revenue Million Forecast, by Region 2020 & 2033
- Table 4: Global USA Amusement and Theme Park Industry Revenue Million Forecast, by Type 2020 & 2033
- Table 5: Global USA Amusement and Theme Park Industry Revenue Million Forecast, by Source of Revenue 2020 & 2033
- Table 6: Global USA Amusement and Theme Park Industry Revenue Million Forecast, by Country 2020 & 2033
- Table 7: United States USA Amusement and Theme Park Industry Revenue (Million) Forecast, by Application 2020 & 2033
- Table 8: Canada USA Amusement and Theme Park Industry Revenue (Million) Forecast, by Application 2020 & 2033
- Table 9: Mexico USA Amusement and Theme Park Industry Revenue (Million) Forecast, by Application 2020 & 2033
- Table 10: Global USA Amusement and Theme Park Industry Revenue Million Forecast, by Type 2020 & 2033
- Table 11: Global USA Amusement and Theme Park Industry Revenue Million Forecast, by Source of Revenue 2020 & 2033
- Table 12: Global USA Amusement and Theme Park Industry Revenue Million Forecast, by Country 2020 & 2033
- Table 13: Brazil USA Amusement and Theme Park Industry Revenue (Million) Forecast, by Application 2020 & 2033
- Table 14: Argentina USA Amusement and Theme Park Industry Revenue (Million) Forecast, by Application 2020 & 2033
- Table 15: Rest of South America USA Amusement and Theme Park Industry Revenue (Million) Forecast, by Application 2020 & 2033
- Table 16: Global USA Amusement and Theme Park Industry Revenue Million Forecast, by Type 2020 & 2033
- Table 17: Global USA Amusement and Theme Park Industry Revenue Million Forecast, by Source of Revenue 2020 & 2033
- Table 18: Global USA Amusement and Theme Park Industry Revenue Million Forecast, by Country 2020 & 2033
- Table 19: United Kingdom USA Amusement and Theme Park Industry Revenue (Million) Forecast, by Application 2020 & 2033
- Table 20: Germany USA Amusement and Theme Park Industry Revenue (Million) Forecast, by Application 2020 & 2033
- Table 21: France USA Amusement and Theme Park Industry Revenue (Million) Forecast, by Application 2020 & 2033
- Table 22: Italy USA Amusement and Theme Park Industry Revenue (Million) Forecast, by Application 2020 & 2033
- Table 23: Spain USA Amusement and Theme Park Industry Revenue (Million) Forecast, by Application 2020 & 2033
- Table 24: Russia USA Amusement and Theme Park Industry Revenue (Million) Forecast, by Application 2020 & 2033
- Table 25: Benelux USA Amusement and Theme Park Industry Revenue (Million) Forecast, by Application 2020 & 2033
- Table 26: Nordics USA Amusement and Theme Park Industry Revenue (Million) Forecast, by Application 2020 & 2033
- Table 27: Rest of Europe USA Amusement and Theme Park Industry Revenue (Million) Forecast, by Application 2020 & 2033
- Table 28: Global USA Amusement and Theme Park Industry Revenue Million Forecast, by Type 2020 & 2033
- Table 29: Global USA Amusement and Theme Park Industry Revenue Million Forecast, by Source of Revenue 2020 & 2033
- Table 30: Global USA Amusement and Theme Park Industry Revenue Million Forecast, by Country 2020 & 2033
- Table 31: Turkey USA Amusement and Theme Park Industry Revenue (Million) Forecast, by Application 2020 & 2033
- Table 32: Israel USA Amusement and Theme Park Industry Revenue (Million) Forecast, by Application 2020 & 2033
- Table 33: GCC USA Amusement and Theme Park Industry Revenue (Million) Forecast, by Application 2020 & 2033
- Table 34: North Africa USA Amusement and Theme Park Industry Revenue (Million) Forecast, by Application 2020 & 2033
- Table 35: South Africa USA Amusement and Theme Park Industry Revenue (Million) Forecast, by Application 2020 & 2033
- Table 36: Rest of Middle East & Africa USA Amusement and Theme Park Industry Revenue (Million) Forecast, by Application 2020 & 2033
- Table 37: Global USA Amusement and Theme Park Industry Revenue Million Forecast, by Type 2020 & 2033
- Table 38: Global USA Amusement and Theme Park Industry Revenue Million Forecast, by Source of Revenue 2020 & 2033
- Table 39: Global USA Amusement and Theme Park Industry Revenue Million Forecast, by Country 2020 & 2033
- Table 40: China USA Amusement and Theme Park Industry Revenue (Million) Forecast, by Application 2020 & 2033
- Table 41: India USA Amusement and Theme Park Industry Revenue (Million) Forecast, by Application 2020 & 2033
- Table 42: Japan USA Amusement and Theme Park Industry Revenue (Million) Forecast, by Application 2020 & 2033
- Table 43: South Korea USA Amusement and Theme Park Industry Revenue (Million) Forecast, by Application 2020 & 2033
- Table 44: ASEAN USA Amusement and Theme Park Industry Revenue (Million) Forecast, by Application 2020 & 2033
- Table 45: Oceania USA Amusement and Theme Park Industry Revenue (Million) Forecast, by Application 2020 & 2033
- Table 46: Rest of Asia Pacific USA Amusement and Theme Park Industry Revenue (Million) Forecast, by Application 2020 & 2033
Frequently Asked Questions
1. What is the projected Compound Annual Growth Rate (CAGR) of the USA Amusement and Theme Park Industry?
The projected CAGR is approximately > 3.50%.
2. Which companies are prominent players in the USA Amusement and Theme Park Industry?
Key companies in the market include Disney Parks, Dollywood, Universal Parks and Resorts, Silver Dollar City, Hersheypark, Six Flags Inc, Busch Garden, The Island in Pigeon Forge, Cedar Fair Entertainment Company, Magic Kingdom Park, Dells Waterpark**List Not Exhaustive, Seaworld Parks and Entertainment.
3. What are the main segments of the USA Amusement and Theme Park Industry?
The market segments include Type, Source of Revenue.
4. Can you provide details about the market size?
The market size is estimated to be USD 23.77 Million as of 2022.
5. What are some drivers contributing to market growth?
The number of baby-boomer tourists is expected to increase. which will fuel the growth of the worldwide amusement park market.; Incorporating energy-saving innovations like LED lighting and solar panels.
6. What are the notable trends driving market growth?
Increase in the number of visitors in amusement and theme parks.
7. Are there any restraints impacting market growth?
Theme parks are raising admission costs and letting guests ride every ride without waiting in queue; Theme parks utilising virtual reality are becoming more and more common..
8. Can you provide examples of recent developments in the market?
September 2023: Crescent Real Estate LLC acquired the Element Orlando Universal Blvd., a 165-key hotel operated under a franchise agreement with Marriott International. Located just outside the confines of the mixed-use development known as Icon Park, Element Orlando hotel guests have immediate access to 20 acres of entertainment opportunities.
9. What pricing options are available for accessing the report?
Pricing options include single-user, multi-user, and enterprise licenses priced at USD 3800, USD 4500, and USD 5800 respectively.
10. Is the market size provided in terms of value or volume?
The market size is provided in terms of value, measured in Million.
11. Are there any specific market keywords associated with the report?
Yes, the market keyword associated with the report is "USA Amusement and Theme Park Industry," which aids in identifying and referencing the specific market segment covered.
12. How do I determine which pricing option suits my needs best?
The pricing options vary based on user requirements and access needs. Individual users may opt for single-user licenses, while businesses requiring broader access may choose multi-user or enterprise licenses for cost-effective access to the report.
13. Are there any additional resources or data provided in the USA Amusement and Theme Park Industry report?
While the report offers comprehensive insights, it's advisable to review the specific contents or supplementary materials provided to ascertain if additional resources or data are available.
14. How can I stay updated on further developments or reports in the USA Amusement and Theme Park Industry?
To stay informed about further developments, trends, and reports in the USA Amusement and Theme Park Industry, consider subscribing to industry newsletters, following relevant companies and organizations, or regularly checking reputable industry news sources and publications.
Methodology
Step 1 - Identification of Relevant Samples Size from Population Database


Step 2 - Approaches for Defining Global Market Size (Value, Volume* & Price*)

Note*: In applicable scenarios
Step 3 - Data Sources
Primary Research
- Web Analytics
- Survey Reports
- Research Institute
- Latest Research Reports
- Opinion Leaders
Secondary Research
- Annual Reports
- White Paper
- Latest Press Release
- Industry Association
- Paid Database
- Investor Presentations

Step 4 - Data Triangulation
Involves using different sources of information in order to increase the validity of a study
These sources are likely to be stakeholders in a program - participants, other researchers, program staff, other community members, and so on.
Then we put all data in single framework & apply various statistical tools to find out the dynamic on the market.
During the analysis stage, feedback from the stakeholder groups would be compared to determine areas of agreement as well as areas of divergence