

Key Insights
The global excipients market is experiencing robust growth, projected to reach approximately USD 255.01 billion in 2024, and is anticipated to expand at a healthy Compound Annual Growth Rate (CAGR) of 5.85% during the forecast period of 2025-2033. This expansion is primarily driven by the increasing global demand for pharmaceuticals, a growing elderly population requiring consistent medication, and the continuous development of novel drug delivery systems. The pharmaceutical industry's relentless pursuit of innovative formulations, particularly in areas like biologics and complex generics, necessitates advanced excipients that can enhance drug stability, bioavailability, and patient compliance. Furthermore, the rising prevalence of chronic diseases worldwide fuels the demand for a wider array of pharmaceutical products, directly impacting the excipient market.

Excipients Market Size (In Billion)
Key trends shaping the excipient landscape include a significant shift towards organic excipients, driven by their perceived safety, sustainability, and versatile functionality in various drug formulations. Technological advancements in manufacturing processes are enabling the production of high-purity and specialized excipients, catering to the stringent requirements of the pharmaceutical sector. Geographically, the Asia Pacific region, led by China and India, is emerging as a major growth hub due to its expanding pharmaceutical manufacturing capabilities and increasing healthcare expenditure. However, the market also faces challenges, including stringent regulatory hurdles for new excipient introductions and price volatility of raw materials, which can impact profit margins for manufacturers. Despite these restraints, the overall outlook for the excipients market remains highly positive, underscoring its critical role in the advancement of healthcare.

Excipients Company Market Share
Excipients Market: Comprehensive Analysis and Future Outlook (2019–2033)
This in-depth report provides a detailed analysis of the global excipients market, offering critical insights into its structure, trends, and future trajectory. Covering a study period from 2019 to 2033, with a base year of 2025 and a forecast period from 2025 to 2033, this report is an indispensable resource for stakeholders seeking to understand the dynamics of this rapidly evolving sector. The market is projected to reach billions in value by the end of the forecast period, driven by robust growth in pharmaceutical formulations and an increasing demand for advanced drug delivery systems.
Excipients Market Structure & Competitive Landscape
The global excipients market is characterized by a moderately consolidated structure, with a few major players holding a significant market share, while a large number of smaller companies cater to niche segments. Innovation drivers are primarily focused on enhancing drug bioavailability, improving patient compliance, and developing novel drug delivery systems. Regulatory impacts, such as stringent quality standards and approval processes, play a crucial role in shaping market entry and product development. Product substitutes, though limited, can emerge in the form of alternative drug formulations or novel therapeutic approaches. End-user segmentation is dominated by pharmaceutical manufacturers, followed by nutraceutical and cosmetic industries. Mergers and acquisitions (M&A) trends are notable, with larger entities acquiring innovative startups to expand their product portfolios and market reach. M&A volumes are estimated to be in the billions, indicating significant consolidation activity aimed at achieving economies of scale and strengthening competitive positions. Key concentration ratios highlight the dominance of top players, while the growing number of patent filings underscores the intense R&D efforts.
Excipients Market Trends & Opportunities
The global excipients market is poised for substantial growth, projected to reach trillions in value by 2033, exhibiting a compound annual growth rate (CAGR) of approximately 7.5% from 2025 to 2033. This growth is fueled by several converging trends. A primary driver is the escalating global demand for pharmaceuticals, propelled by an aging population, increasing prevalence of chronic diseases, and growing healthcare expenditure worldwide. This, in turn, directly translates to a higher demand for excipients, which are indispensable components in the formulation of virtually all dosage forms. Technological shifts are revolutionizing the excipient landscape. The development of novel excipients with improved functionality, such as enhanced solubility, controlled release capabilities, and improved stability, is opening up new avenues for drug development and delivery. For instance, advances in nanotechnology and advanced polymer science are enabling the creation of excipients for targeted drug delivery and personalized medicine.
Consumer preferences are also playing a significant role. There is a rising demand for patient-friendly dosage forms, leading to an increased use of orally disintegrating tablets, chewable formulations, and liquid suspensions, all of which rely on specific types of excipients. Furthermore, the growing awareness and demand for high-quality, safe, and effective medications are pushing manufacturers to invest in premium excipients with proven track records. The competitive dynamics within the market are intensifying, with companies focusing on product differentiation through innovation, strategic partnerships, and backward integration to secure supply chains. The rise of biologics and complex molecule drugs necessitates the development of specialized excipients, creating significant opportunities for manufacturers capable of meeting these advanced requirements. Market penetration rates for advanced excipients are expected to rise significantly as pharmaceutical companies seek to improve drug efficacy and patient outcomes.
Dominant Markets & Segments in Excipients
The dominant market segment within the excipients industry, based on application, is overwhelmingly Oral Formulations. This segment accounts for a substantial share of the global market, estimated to be over 70% of the total value, projected to reach trillions by 2033. The widespread use of oral dosage forms like tablets, capsules, and syrups in the pharmaceutical and nutraceutical industries, coupled with their cost-effectiveness and ease of administration, underpins this dominance. Key growth drivers for oral formulations include:
- High Patient Compliance: Oral medications are generally well-accepted by patients, leading to better adherence to treatment regimens.
- Cost-Effectiveness: Manufacturing processes for oral dosage forms are often more economical compared to parenteral or injectable formulations.
- Established Infrastructure: A well-developed manufacturing and distribution infrastructure supports the production and delivery of oral medications on a global scale.
- Technological Advancements: Continuous innovation in tablet compression technology, granulation techniques, and film-coating materials enhances the performance and stability of oral excipients.
Within the Types of excipients, Organic Excipients represent the larger and more dynamic segment, projected to command a market value in the trillions by 2033. This category includes a vast array of substances such as celluloses, starches, sugars, polymers, and lipids, which are vital for drug binding, disintegration, lubrication, and controlled release. Key growth drivers for organic excipients include:
- Versatility and Functionality: Organic excipients offer a wide range of functional properties, making them suitable for diverse drug delivery challenges.
- Biocompatibility and Safety: Many organic excipients are derived from natural sources and are well-tolerated by the human body, meeting stringent regulatory requirements.
- Innovation in Polymer Science: Advancements in polymer chemistry are leading to the development of novel organic excipients for complex applications like sustained-release formulations and targeted drug delivery.
Geographically, North America and Europe are currently the leading regions in the excipients market, driven by their well-established pharmaceutical industries, high R&D investments, and stringent quality standards. However, the Asia Pacific region is emerging as the fastest-growing market, fueled by expanding pharmaceutical manufacturing capabilities, increasing healthcare access, and a growing generic drug market, with an estimated market value in the hundreds of billions. Countries like China and India are significant contributors to this growth, driven by government initiatives supporting domestic pharmaceutical production and a large patient population.
Excipients Product Analysis
Recent product innovations in the excipients market center on enhanced functionality and specialized applications. Advancements in cellulosic derivatives and polymer science are yielding excipients with superior binding, controlled-release, and solubilizing properties, crucial for improving drug efficacy and patient compliance. For example, novel co-processed excipients are designed to provide unique flow and compressibility characteristics, streamlining tablet manufacturing. The competitive advantage lies in offering excipients that address unmet needs in complex drug formulations, such as those for poorly soluble drugs or biologics, thereby enabling pharmaceutical companies to develop next-generation therapies.
Key Drivers, Barriers & Challenges in Excipients
Key Drivers: The excipients market is propelled by a surge in global pharmaceutical demand, driven by an aging population and rising chronic disease incidence, expected to boost market value to trillions. Technological advancements in drug delivery, such as sustained-release formulations and personalized medicine, necessitate innovative excipient solutions. Favorable regulatory policies in emerging economies are also opening up new market opportunities, contributing billions in potential growth.
Key Barriers & Challenges: Stringent regulatory compliance and evolving quality standards present significant hurdles, requiring substantial investment in R&D and manufacturing. Supply chain complexities, including raw material sourcing and geopolitical instability, can lead to disruptions and increased costs, impacting market stability by billions. Intense competitive pressure from established players and the threat of new entrants also challenge profit margins. The cost of R&D for novel excipients and the lengthy approval processes can further restrain growth, with potential lost revenue in the hundreds of billions.
Growth Drivers in the Excipients Market
Several key growth drivers are shaping the excipients market, projected to reach trillions in value. Technologically, the escalating demand for novel drug delivery systems, including controlled-release and targeted drug delivery, fuels the need for advanced excipients. Economically, the robust growth of the global pharmaceutical industry, particularly in emerging markets, provides a substantial base for excipient consumption. Regulatory-wise, favorable policies supporting pharmaceutical manufacturing and innovation in regions like Asia Pacific are creating significant expansion opportunities, contributing billions in market potential. Furthermore, the increasing prevalence of chronic diseases necessitates a wider array of effective and patient-friendly drug formulations, directly benefiting the excipient sector.
Challenges Impacting Excipients Growth
The excipients market faces several critical challenges impacting its growth trajectory. Regulatory complexities and the continuous evolution of quality standards demand significant investment and can lead to prolonged product development cycles. Supply chain vulnerabilities, exacerbated by geopolitical factors and the reliance on specific raw materials, pose risks of shortages and price volatility, potentially impacting market value by billions. Intense competitive pressures, both from established global players and emerging regional manufacturers, necessitate constant innovation and cost optimization to maintain market share. Furthermore, the high cost associated with developing and gaining regulatory approval for novel excipients can act as a significant restraint, with the potential to delay the introduction of groundbreaking products.
Key Players Shaping the Excipients Market
DuPont Roquette Ashland BASF Evonik Associated British Foods Lubrizol DOW Croda International Archer Daniels Midland Innophos Kerry Group Wacker Chemie DFE Pharma Colorcon JRS Pharma Air Liquide Hunan ER-Kang pharmaceutical Anhui Sunhere Pharmaceutical Excipients Toudongbao Biotechnology Shandong Head Co.,Ltd
Significant Excipients Industry Milestones
- 2019: Launch of novel biodegradable polymers for controlled drug release, impacting specialized formulations.
- 2020: Major acquisition of a biotech firm specializing in functional excipients, expanding product portfolios.
- 2021: Introduction of advanced co-processed excipients offering improved tablet compression properties, enhancing manufacturing efficiency.
- 2022: Increased investment in sustainable sourcing of plant-derived excipients, aligning with environmental trends.
- 2023: Regulatory approval of a new class of disintegrants designed for orally disintegrating tablets, catering to patient preference.
- 2024: Significant R&D breakthroughs in excipients for mRNA-based therapies, signaling future growth in biologics.
Future Outlook for Excipients Market
The future outlook for the excipients market is exceptionally promising, with growth catalysts pointing towards continued expansion into trillions. Strategic opportunities lie in the burgeoning demand for biologics and complex generics, requiring highly specialized and functional excipients. The increasing focus on personalized medicine and advanced drug delivery systems will further drive innovation and market penetration. Emerging economies, with their rapidly developing pharmaceutical sectors and growing healthcare access, represent significant untapped potential. Companies that invest in novel excipient development, ensure robust supply chains, and adhere to evolving regulatory landscapes are well-positioned to capitalize on the substantial market opportunities in the coming years.
Excipients Segmentation
-
1. Application
- 1.1. Oral Formulations
- 1.2. Topical Formulations
- 1.3. Parenteral Formulations
- 1.4. Other Formulations
-
2. Types
- 2.1. Organic Excipients
- 2.2. Inorganic Excipients
Excipients Segmentation By Geography
-
1. North America
- 1.1. United States
- 1.2. Canada
- 1.3. Mexico
-
2. South America
- 2.1. Brazil
- 2.2. Argentina
- 2.3. Rest of South America
-
3. Europe
- 3.1. United Kingdom
- 3.2. Germany
- 3.3. France
- 3.4. Italy
- 3.5. Spain
- 3.6. Russia
- 3.7. Benelux
- 3.8. Nordics
- 3.9. Rest of Europe
-
4. Middle East & Africa
- 4.1. Turkey
- 4.2. Israel
- 4.3. GCC
- 4.4. North Africa
- 4.5. South Africa
- 4.6. Rest of Middle East & Africa
-
5. Asia Pacific
- 5.1. China
- 5.2. India
- 5.3. Japan
- 5.4. South Korea
- 5.5. ASEAN
- 5.6. Oceania
- 5.7. Rest of Asia Pacific
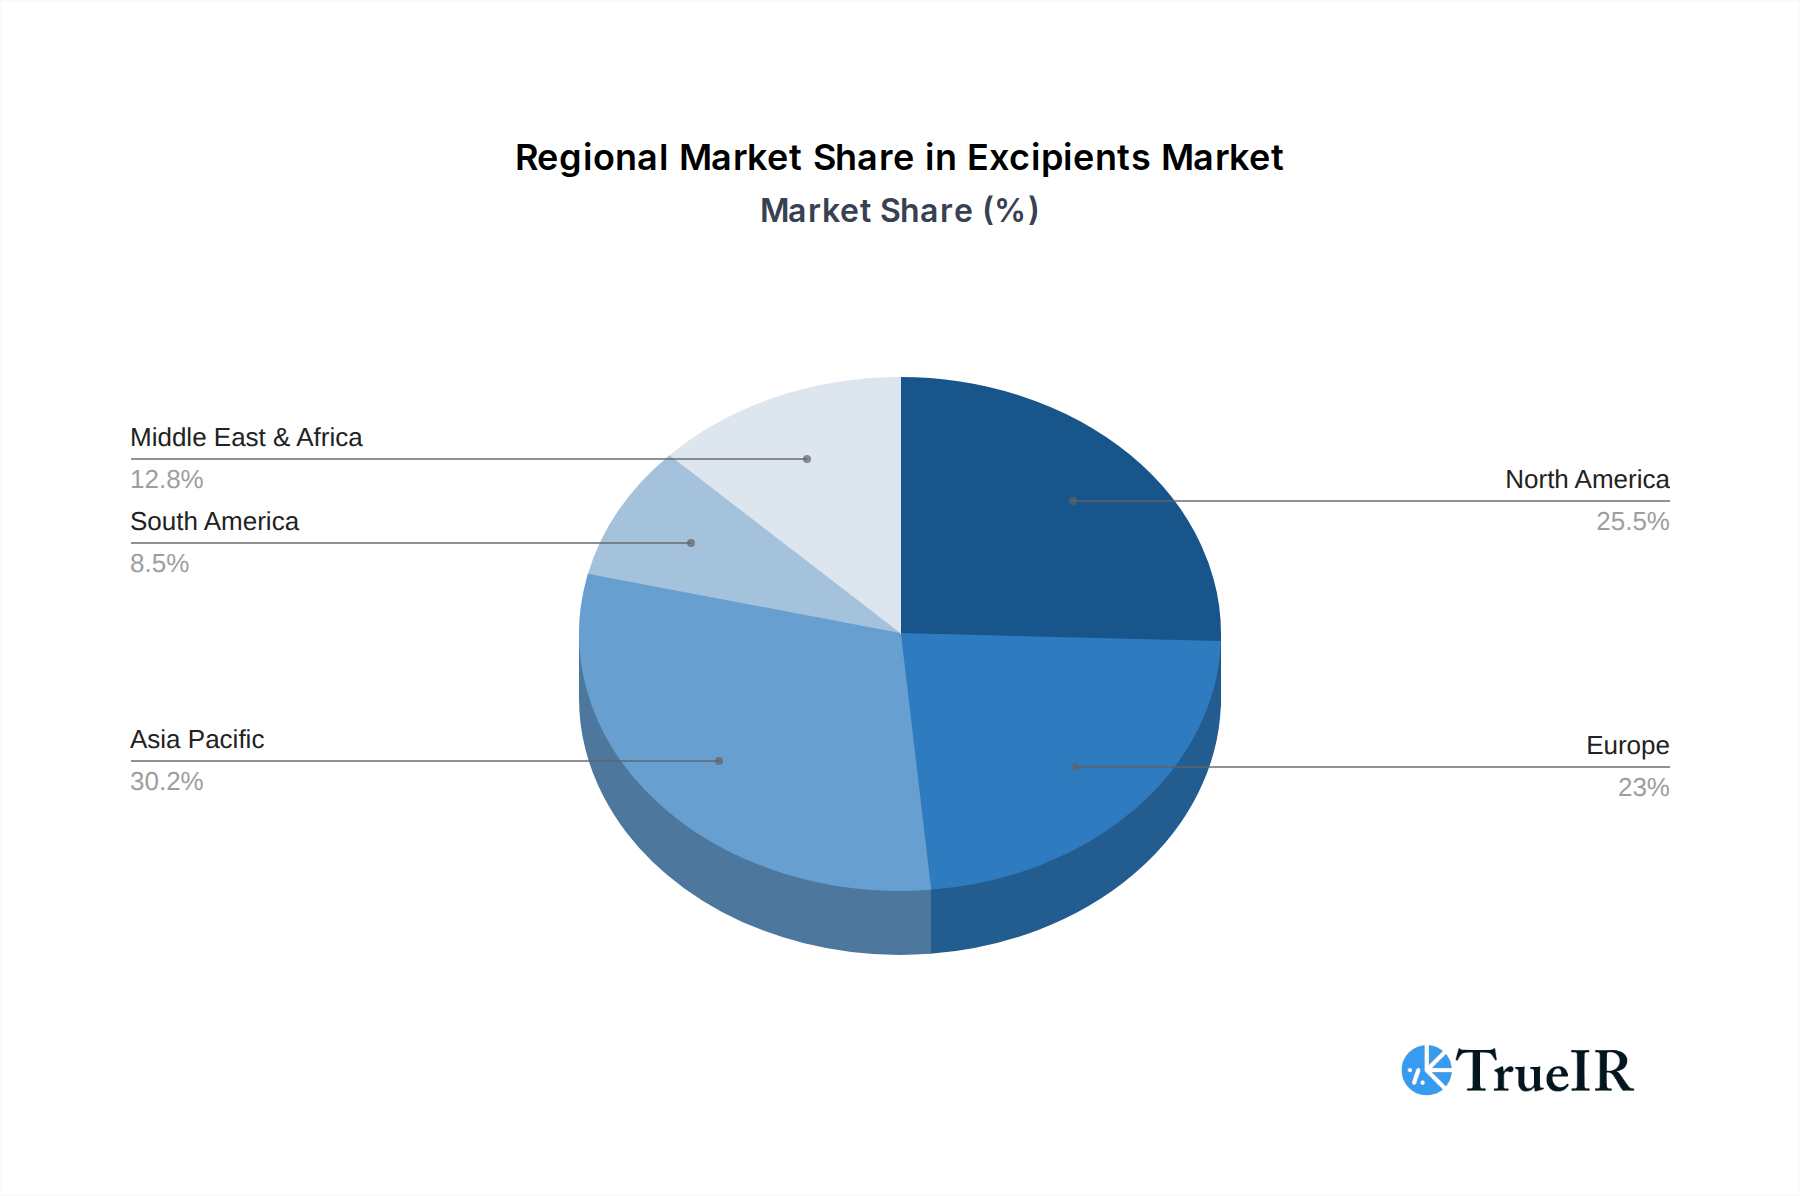
Excipients Regional Market Share
Geographic Coverage of Excipients
Excipients REPORT HIGHLIGHTS
| Aspects | Details |
|---|---|
| Study Period | 2020-2034 |
| Base Year | 2025 |
| Estimated Year | 2026 |
| Forecast Period | 2026-2034 |
| Historical Period | 2020-2025 |
| Growth Rate | CAGR of 5.85% from 2020-2034 |
| Segmentation |
|
Table of Contents
- 1. Introduction
- 1.1. Research Scope
- 1.2. Market Segmentation
- 1.3. Research Methodology
- 1.4. Definitions and Assumptions
- 2. Executive Summary
- 2.1. Introduction
- 3. Market Dynamics
- 3.1. Introduction
- 3.2. Market Drivers
- 3.3. Market Restrains
- 3.4. Market Trends
- 4. Market Factor Analysis
- 4.1. Porters Five Forces
- 4.2. Supply/Value Chain
- 4.3. PESTEL analysis
- 4.4. Market Entropy
- 4.5. Patent/Trademark Analysis
- 5. Global Excipients Analysis, Insights and Forecast, 2020-2032
- 5.1. Market Analysis, Insights and Forecast - by Application
- 5.1.1. Oral Formulations
- 5.1.2. Topical Formulations
- 5.1.3. Parenteral Formulations
- 5.1.4. Other Formulations
- 5.2. Market Analysis, Insights and Forecast - by Types
- 5.2.1. Organic Excipients
- 5.2.2. Inorganic Excipients
- 5.3. Market Analysis, Insights and Forecast - by Region
- 5.3.1. North America
- 5.3.2. South America
- 5.3.3. Europe
- 5.3.4. Middle East & Africa
- 5.3.5. Asia Pacific
- 5.1. Market Analysis, Insights and Forecast - by Application
- 6. North America Excipients Analysis, Insights and Forecast, 2020-2032
- 6.1. Market Analysis, Insights and Forecast - by Application
- 6.1.1. Oral Formulations
- 6.1.2. Topical Formulations
- 6.1.3. Parenteral Formulations
- 6.1.4. Other Formulations
- 6.2. Market Analysis, Insights and Forecast - by Types
- 6.2.1. Organic Excipients
- 6.2.2. Inorganic Excipients
- 6.1. Market Analysis, Insights and Forecast - by Application
- 7. South America Excipients Analysis, Insights and Forecast, 2020-2032
- 7.1. Market Analysis, Insights and Forecast - by Application
- 7.1.1. Oral Formulations
- 7.1.2. Topical Formulations
- 7.1.3. Parenteral Formulations
- 7.1.4. Other Formulations
- 7.2. Market Analysis, Insights and Forecast - by Types
- 7.2.1. Organic Excipients
- 7.2.2. Inorganic Excipients
- 7.1. Market Analysis, Insights and Forecast - by Application
- 8. Europe Excipients Analysis, Insights and Forecast, 2020-2032
- 8.1. Market Analysis, Insights and Forecast - by Application
- 8.1.1. Oral Formulations
- 8.1.2. Topical Formulations
- 8.1.3. Parenteral Formulations
- 8.1.4. Other Formulations
- 8.2. Market Analysis, Insights and Forecast - by Types
- 8.2.1. Organic Excipients
- 8.2.2. Inorganic Excipients
- 8.1. Market Analysis, Insights and Forecast - by Application
- 9. Middle East & Africa Excipients Analysis, Insights and Forecast, 2020-2032
- 9.1. Market Analysis, Insights and Forecast - by Application
- 9.1.1. Oral Formulations
- 9.1.2. Topical Formulations
- 9.1.3. Parenteral Formulations
- 9.1.4. Other Formulations
- 9.2. Market Analysis, Insights and Forecast - by Types
- 9.2.1. Organic Excipients
- 9.2.2. Inorganic Excipients
- 9.1. Market Analysis, Insights and Forecast - by Application
- 10. Asia Pacific Excipients Analysis, Insights and Forecast, 2020-2032
- 10.1. Market Analysis, Insights and Forecast - by Application
- 10.1.1. Oral Formulations
- 10.1.2. Topical Formulations
- 10.1.3. Parenteral Formulations
- 10.1.4. Other Formulations
- 10.2. Market Analysis, Insights and Forecast - by Types
- 10.2.1. Organic Excipients
- 10.2.2. Inorganic Excipients
- 10.1. Market Analysis, Insights and Forecast - by Application
- 11. Competitive Analysis
- 11.1. Global Market Share Analysis 2025
- 11.2. Company Profiles
- 11.2.1 DuPont
- 11.2.1.1. Overview
- 11.2.1.2. Products
- 11.2.1.3. SWOT Analysis
- 11.2.1.4. Recent Developments
- 11.2.1.5. Financials (Based on Availability)
- 11.2.2 Roquette
- 11.2.2.1. Overview
- 11.2.2.2. Products
- 11.2.2.3. SWOT Analysis
- 11.2.2.4. Recent Developments
- 11.2.2.5. Financials (Based on Availability)
- 11.2.3 Ashland
- 11.2.3.1. Overview
- 11.2.3.2. Products
- 11.2.3.3. SWOT Analysis
- 11.2.3.4. Recent Developments
- 11.2.3.5. Financials (Based on Availability)
- 11.2.4 BASF
- 11.2.4.1. Overview
- 11.2.4.2. Products
- 11.2.4.3. SWOT Analysis
- 11.2.4.4. Recent Developments
- 11.2.4.5. Financials (Based on Availability)
- 11.2.5 Evonik
- 11.2.5.1. Overview
- 11.2.5.2. Products
- 11.2.5.3. SWOT Analysis
- 11.2.5.4. Recent Developments
- 11.2.5.5. Financials (Based on Availability)
- 11.2.6 Associated British Foods
- 11.2.6.1. Overview
- 11.2.6.2. Products
- 11.2.6.3. SWOT Analysis
- 11.2.6.4. Recent Developments
- 11.2.6.5. Financials (Based on Availability)
- 11.2.7 Lubrizol
- 11.2.7.1. Overview
- 11.2.7.2. Products
- 11.2.7.3. SWOT Analysis
- 11.2.7.4. Recent Developments
- 11.2.7.5. Financials (Based on Availability)
- 11.2.8 DOW
- 11.2.8.1. Overview
- 11.2.8.2. Products
- 11.2.8.3. SWOT Analysis
- 11.2.8.4. Recent Developments
- 11.2.8.5. Financials (Based on Availability)
- 11.2.9 Croda International
- 11.2.9.1. Overview
- 11.2.9.2. Products
- 11.2.9.3. SWOT Analysis
- 11.2.9.4. Recent Developments
- 11.2.9.5. Financials (Based on Availability)
- 11.2.10 Archer Daniels Midland
- 11.2.10.1. Overview
- 11.2.10.2. Products
- 11.2.10.3. SWOT Analysis
- 11.2.10.4. Recent Developments
- 11.2.10.5. Financials (Based on Availability)
- 11.2.11 Innophos
- 11.2.11.1. Overview
- 11.2.11.2. Products
- 11.2.11.3. SWOT Analysis
- 11.2.11.4. Recent Developments
- 11.2.11.5. Financials (Based on Availability)
- 11.2.12 Kerry Group
- 11.2.12.1. Overview
- 11.2.12.2. Products
- 11.2.12.3. SWOT Analysis
- 11.2.12.4. Recent Developments
- 11.2.12.5. Financials (Based on Availability)
- 11.2.13 Wacker Chemie
- 11.2.13.1. Overview
- 11.2.13.2. Products
- 11.2.13.3. SWOT Analysis
- 11.2.13.4. Recent Developments
- 11.2.13.5. Financials (Based on Availability)
- 11.2.14 DFE Pharma
- 11.2.14.1. Overview
- 11.2.14.2. Products
- 11.2.14.3. SWOT Analysis
- 11.2.14.4. Recent Developments
- 11.2.14.5. Financials (Based on Availability)
- 11.2.15 Colorcon
- 11.2.15.1. Overview
- 11.2.15.2. Products
- 11.2.15.3. SWOT Analysis
- 11.2.15.4. Recent Developments
- 11.2.15.5. Financials (Based on Availability)
- 11.2.16 JRS Pharma
- 11.2.16.1. Overview
- 11.2.16.2. Products
- 11.2.16.3. SWOT Analysis
- 11.2.16.4. Recent Developments
- 11.2.16.5. Financials (Based on Availability)
- 11.2.17 Air Liquide
- 11.2.17.1. Overview
- 11.2.17.2. Products
- 11.2.17.3. SWOT Analysis
- 11.2.17.4. Recent Developments
- 11.2.17.5. Financials (Based on Availability)
- 11.2.18 Hunan ER-Kang pharmaceutical
- 11.2.18.1. Overview
- 11.2.18.2. Products
- 11.2.18.3. SWOT Analysis
- 11.2.18.4. Recent Developments
- 11.2.18.5. Financials (Based on Availability)
- 11.2.19 Anhui Sunhere Pharmaceutical Excipients
- 11.2.19.1. Overview
- 11.2.19.2. Products
- 11.2.19.3. SWOT Analysis
- 11.2.19.4. Recent Developments
- 11.2.19.5. Financials (Based on Availability)
- 11.2.20 Toudongbao Biotechnology
- 11.2.20.1. Overview
- 11.2.20.2. Products
- 11.2.20.3. SWOT Analysis
- 11.2.20.4. Recent Developments
- 11.2.20.5. Financials (Based on Availability)
- 11.2.21 Shandong Head Co.
- 11.2.21.1. Overview
- 11.2.21.2. Products
- 11.2.21.3. SWOT Analysis
- 11.2.21.4. Recent Developments
- 11.2.21.5. Financials (Based on Availability)
- 11.2.22 Ltd
- 11.2.22.1. Overview
- 11.2.22.2. Products
- 11.2.22.3. SWOT Analysis
- 11.2.22.4. Recent Developments
- 11.2.22.5. Financials (Based on Availability)
- 11.2.1 DuPont
List of Figures
- Figure 1: Global Excipients Revenue Breakdown (undefined, %) by Region 2025 & 2033
- Figure 2: Global Excipients Volume Breakdown (K, %) by Region 2025 & 2033
- Figure 3: North America Excipients Revenue (undefined), by Application 2025 & 2033
- Figure 4: North America Excipients Volume (K), by Application 2025 & 2033
- Figure 5: North America Excipients Revenue Share (%), by Application 2025 & 2033
- Figure 6: North America Excipients Volume Share (%), by Application 2025 & 2033
- Figure 7: North America Excipients Revenue (undefined), by Types 2025 & 2033
- Figure 8: North America Excipients Volume (K), by Types 2025 & 2033
- Figure 9: North America Excipients Revenue Share (%), by Types 2025 & 2033
- Figure 10: North America Excipients Volume Share (%), by Types 2025 & 2033
- Figure 11: North America Excipients Revenue (undefined), by Country 2025 & 2033
- Figure 12: North America Excipients Volume (K), by Country 2025 & 2033
- Figure 13: North America Excipients Revenue Share (%), by Country 2025 & 2033
- Figure 14: North America Excipients Volume Share (%), by Country 2025 & 2033
- Figure 15: South America Excipients Revenue (undefined), by Application 2025 & 2033
- Figure 16: South America Excipients Volume (K), by Application 2025 & 2033
- Figure 17: South America Excipients Revenue Share (%), by Application 2025 & 2033
- Figure 18: South America Excipients Volume Share (%), by Application 2025 & 2033
- Figure 19: South America Excipients Revenue (undefined), by Types 2025 & 2033
- Figure 20: South America Excipients Volume (K), by Types 2025 & 2033
- Figure 21: South America Excipients Revenue Share (%), by Types 2025 & 2033
- Figure 22: South America Excipients Volume Share (%), by Types 2025 & 2033
- Figure 23: South America Excipients Revenue (undefined), by Country 2025 & 2033
- Figure 24: South America Excipients Volume (K), by Country 2025 & 2033
- Figure 25: South America Excipients Revenue Share (%), by Country 2025 & 2033
- Figure 26: South America Excipients Volume Share (%), by Country 2025 & 2033
- Figure 27: Europe Excipients Revenue (undefined), by Application 2025 & 2033
- Figure 28: Europe Excipients Volume (K), by Application 2025 & 2033
- Figure 29: Europe Excipients Revenue Share (%), by Application 2025 & 2033
- Figure 30: Europe Excipients Volume Share (%), by Application 2025 & 2033
- Figure 31: Europe Excipients Revenue (undefined), by Types 2025 & 2033
- Figure 32: Europe Excipients Volume (K), by Types 2025 & 2033
- Figure 33: Europe Excipients Revenue Share (%), by Types 2025 & 2033
- Figure 34: Europe Excipients Volume Share (%), by Types 2025 & 2033
- Figure 35: Europe Excipients Revenue (undefined), by Country 2025 & 2033
- Figure 36: Europe Excipients Volume (K), by Country 2025 & 2033
- Figure 37: Europe Excipients Revenue Share (%), by Country 2025 & 2033
- Figure 38: Europe Excipients Volume Share (%), by Country 2025 & 2033
- Figure 39: Middle East & Africa Excipients Revenue (undefined), by Application 2025 & 2033
- Figure 40: Middle East & Africa Excipients Volume (K), by Application 2025 & 2033
- Figure 41: Middle East & Africa Excipients Revenue Share (%), by Application 2025 & 2033
- Figure 42: Middle East & Africa Excipients Volume Share (%), by Application 2025 & 2033
- Figure 43: Middle East & Africa Excipients Revenue (undefined), by Types 2025 & 2033
- Figure 44: Middle East & Africa Excipients Volume (K), by Types 2025 & 2033
- Figure 45: Middle East & Africa Excipients Revenue Share (%), by Types 2025 & 2033
- Figure 46: Middle East & Africa Excipients Volume Share (%), by Types 2025 & 2033
- Figure 47: Middle East & Africa Excipients Revenue (undefined), by Country 2025 & 2033
- Figure 48: Middle East & Africa Excipients Volume (K), by Country 2025 & 2033
- Figure 49: Middle East & Africa Excipients Revenue Share (%), by Country 2025 & 2033
- Figure 50: Middle East & Africa Excipients Volume Share (%), by Country 2025 & 2033
- Figure 51: Asia Pacific Excipients Revenue (undefined), by Application 2025 & 2033
- Figure 52: Asia Pacific Excipients Volume (K), by Application 2025 & 2033
- Figure 53: Asia Pacific Excipients Revenue Share (%), by Application 2025 & 2033
- Figure 54: Asia Pacific Excipients Volume Share (%), by Application 2025 & 2033
- Figure 55: Asia Pacific Excipients Revenue (undefined), by Types 2025 & 2033
- Figure 56: Asia Pacific Excipients Volume (K), by Types 2025 & 2033
- Figure 57: Asia Pacific Excipients Revenue Share (%), by Types 2025 & 2033
- Figure 58: Asia Pacific Excipients Volume Share (%), by Types 2025 & 2033
- Figure 59: Asia Pacific Excipients Revenue (undefined), by Country 2025 & 2033
- Figure 60: Asia Pacific Excipients Volume (K), by Country 2025 & 2033
- Figure 61: Asia Pacific Excipients Revenue Share (%), by Country 2025 & 2033
- Figure 62: Asia Pacific Excipients Volume Share (%), by Country 2025 & 2033
List of Tables
- Table 1: Global Excipients Revenue undefined Forecast, by Application 2020 & 2033
- Table 2: Global Excipients Volume K Forecast, by Application 2020 & 2033
- Table 3: Global Excipients Revenue undefined Forecast, by Types 2020 & 2033
- Table 4: Global Excipients Volume K Forecast, by Types 2020 & 2033
- Table 5: Global Excipients Revenue undefined Forecast, by Region 2020 & 2033
- Table 6: Global Excipients Volume K Forecast, by Region 2020 & 2033
- Table 7: Global Excipients Revenue undefined Forecast, by Application 2020 & 2033
- Table 8: Global Excipients Volume K Forecast, by Application 2020 & 2033
- Table 9: Global Excipients Revenue undefined Forecast, by Types 2020 & 2033
- Table 10: Global Excipients Volume K Forecast, by Types 2020 & 2033
- Table 11: Global Excipients Revenue undefined Forecast, by Country 2020 & 2033
- Table 12: Global Excipients Volume K Forecast, by Country 2020 & 2033
- Table 13: United States Excipients Revenue (undefined) Forecast, by Application 2020 & 2033
- Table 14: United States Excipients Volume (K) Forecast, by Application 2020 & 2033
- Table 15: Canada Excipients Revenue (undefined) Forecast, by Application 2020 & 2033
- Table 16: Canada Excipients Volume (K) Forecast, by Application 2020 & 2033
- Table 17: Mexico Excipients Revenue (undefined) Forecast, by Application 2020 & 2033
- Table 18: Mexico Excipients Volume (K) Forecast, by Application 2020 & 2033
- Table 19: Global Excipients Revenue undefined Forecast, by Application 2020 & 2033
- Table 20: Global Excipients Volume K Forecast, by Application 2020 & 2033
- Table 21: Global Excipients Revenue undefined Forecast, by Types 2020 & 2033
- Table 22: Global Excipients Volume K Forecast, by Types 2020 & 2033
- Table 23: Global Excipients Revenue undefined Forecast, by Country 2020 & 2033
- Table 24: Global Excipients Volume K Forecast, by Country 2020 & 2033
- Table 25: Brazil Excipients Revenue (undefined) Forecast, by Application 2020 & 2033
- Table 26: Brazil Excipients Volume (K) Forecast, by Application 2020 & 2033
- Table 27: Argentina Excipients Revenue (undefined) Forecast, by Application 2020 & 2033
- Table 28: Argentina Excipients Volume (K) Forecast, by Application 2020 & 2033
- Table 29: Rest of South America Excipients Revenue (undefined) Forecast, by Application 2020 & 2033
- Table 30: Rest of South America Excipients Volume (K) Forecast, by Application 2020 & 2033
- Table 31: Global Excipients Revenue undefined Forecast, by Application 2020 & 2033
- Table 32: Global Excipients Volume K Forecast, by Application 2020 & 2033
- Table 33: Global Excipients Revenue undefined Forecast, by Types 2020 & 2033
- Table 34: Global Excipients Volume K Forecast, by Types 2020 & 2033
- Table 35: Global Excipients Revenue undefined Forecast, by Country 2020 & 2033
- Table 36: Global Excipients Volume K Forecast, by Country 2020 & 2033
- Table 37: United Kingdom Excipients Revenue (undefined) Forecast, by Application 2020 & 2033
- Table 38: United Kingdom Excipients Volume (K) Forecast, by Application 2020 & 2033
- Table 39: Germany Excipients Revenue (undefined) Forecast, by Application 2020 & 2033
- Table 40: Germany Excipients Volume (K) Forecast, by Application 2020 & 2033
- Table 41: France Excipients Revenue (undefined) Forecast, by Application 2020 & 2033
- Table 42: France Excipients Volume (K) Forecast, by Application 2020 & 2033
- Table 43: Italy Excipients Revenue (undefined) Forecast, by Application 2020 & 2033
- Table 44: Italy Excipients Volume (K) Forecast, by Application 2020 & 2033
- Table 45: Spain Excipients Revenue (undefined) Forecast, by Application 2020 & 2033
- Table 46: Spain Excipients Volume (K) Forecast, by Application 2020 & 2033
- Table 47: Russia Excipients Revenue (undefined) Forecast, by Application 2020 & 2033
- Table 48: Russia Excipients Volume (K) Forecast, by Application 2020 & 2033
- Table 49: Benelux Excipients Revenue (undefined) Forecast, by Application 2020 & 2033
- Table 50: Benelux Excipients Volume (K) Forecast, by Application 2020 & 2033
- Table 51: Nordics Excipients Revenue (undefined) Forecast, by Application 2020 & 2033
- Table 52: Nordics Excipients Volume (K) Forecast, by Application 2020 & 2033
- Table 53: Rest of Europe Excipients Revenue (undefined) Forecast, by Application 2020 & 2033
- Table 54: Rest of Europe Excipients Volume (K) Forecast, by Application 2020 & 2033
- Table 55: Global Excipients Revenue undefined Forecast, by Application 2020 & 2033
- Table 56: Global Excipients Volume K Forecast, by Application 2020 & 2033
- Table 57: Global Excipients Revenue undefined Forecast, by Types 2020 & 2033
- Table 58: Global Excipients Volume K Forecast, by Types 2020 & 2033
- Table 59: Global Excipients Revenue undefined Forecast, by Country 2020 & 2033
- Table 60: Global Excipients Volume K Forecast, by Country 2020 & 2033
- Table 61: Turkey Excipients Revenue (undefined) Forecast, by Application 2020 & 2033
- Table 62: Turkey Excipients Volume (K) Forecast, by Application 2020 & 2033
- Table 63: Israel Excipients Revenue (undefined) Forecast, by Application 2020 & 2033
- Table 64: Israel Excipients Volume (K) Forecast, by Application 2020 & 2033
- Table 65: GCC Excipients Revenue (undefined) Forecast, by Application 2020 & 2033
- Table 66: GCC Excipients Volume (K) Forecast, by Application 2020 & 2033
- Table 67: North Africa Excipients Revenue (undefined) Forecast, by Application 2020 & 2033
- Table 68: North Africa Excipients Volume (K) Forecast, by Application 2020 & 2033
- Table 69: South Africa Excipients Revenue (undefined) Forecast, by Application 2020 & 2033
- Table 70: South Africa Excipients Volume (K) Forecast, by Application 2020 & 2033
- Table 71: Rest of Middle East & Africa Excipients Revenue (undefined) Forecast, by Application 2020 & 2033
- Table 72: Rest of Middle East & Africa Excipients Volume (K) Forecast, by Application 2020 & 2033
- Table 73: Global Excipients Revenue undefined Forecast, by Application 2020 & 2033
- Table 74: Global Excipients Volume K Forecast, by Application 2020 & 2033
- Table 75: Global Excipients Revenue undefined Forecast, by Types 2020 & 2033
- Table 76: Global Excipients Volume K Forecast, by Types 2020 & 2033
- Table 77: Global Excipients Revenue undefined Forecast, by Country 2020 & 2033
- Table 78: Global Excipients Volume K Forecast, by Country 2020 & 2033
- Table 79: China Excipients Revenue (undefined) Forecast, by Application 2020 & 2033
- Table 80: China Excipients Volume (K) Forecast, by Application 2020 & 2033
- Table 81: India Excipients Revenue (undefined) Forecast, by Application 2020 & 2033
- Table 82: India Excipients Volume (K) Forecast, by Application 2020 & 2033
- Table 83: Japan Excipients Revenue (undefined) Forecast, by Application 2020 & 2033
- Table 84: Japan Excipients Volume (K) Forecast, by Application 2020 & 2033
- Table 85: South Korea Excipients Revenue (undefined) Forecast, by Application 2020 & 2033
- Table 86: South Korea Excipients Volume (K) Forecast, by Application 2020 & 2033
- Table 87: ASEAN Excipients Revenue (undefined) Forecast, by Application 2020 & 2033
- Table 88: ASEAN Excipients Volume (K) Forecast, by Application 2020 & 2033
- Table 89: Oceania Excipients Revenue (undefined) Forecast, by Application 2020 & 2033
- Table 90: Oceania Excipients Volume (K) Forecast, by Application 2020 & 2033
- Table 91: Rest of Asia Pacific Excipients Revenue (undefined) Forecast, by Application 2020 & 2033
- Table 92: Rest of Asia Pacific Excipients Volume (K) Forecast, by Application 2020 & 2033
Frequently Asked Questions
1. What is the projected Compound Annual Growth Rate (CAGR) of the Excipients?
The projected CAGR is approximately 5.85%.
2. Which companies are prominent players in the Excipients?
Key companies in the market include DuPont, Roquette, Ashland, BASF, Evonik, Associated British Foods, Lubrizol, DOW, Croda International, Archer Daniels Midland, Innophos, Kerry Group, Wacker Chemie, DFE Pharma, Colorcon, JRS Pharma, Air Liquide, Hunan ER-Kang pharmaceutical, Anhui Sunhere Pharmaceutical Excipients, Toudongbao Biotechnology, Shandong Head Co., Ltd.
3. What are the main segments of the Excipients?
The market segments include Application, Types.
4. Can you provide details about the market size?
The market size is estimated to be USD XXX N/A as of 2022.
5. What are some drivers contributing to market growth?
N/A
6. What are the notable trends driving market growth?
N/A
7. Are there any restraints impacting market growth?
N/A
8. Can you provide examples of recent developments in the market?
N/A
9. What pricing options are available for accessing the report?
Pricing options include single-user, multi-user, and enterprise licenses priced at USD 3350.00, USD 5025.00, and USD 6700.00 respectively.
10. Is the market size provided in terms of value or volume?
The market size is provided in terms of value, measured in N/A and volume, measured in K.
11. Are there any specific market keywords associated with the report?
Yes, the market keyword associated with the report is "Excipients," which aids in identifying and referencing the specific market segment covered.
12. How do I determine which pricing option suits my needs best?
The pricing options vary based on user requirements and access needs. Individual users may opt for single-user licenses, while businesses requiring broader access may choose multi-user or enterprise licenses for cost-effective access to the report.
13. Are there any additional resources or data provided in the Excipients report?
While the report offers comprehensive insights, it's advisable to review the specific contents or supplementary materials provided to ascertain if additional resources or data are available.
14. How can I stay updated on further developments or reports in the Excipients?
To stay informed about further developments, trends, and reports in the Excipients, consider subscribing to industry newsletters, following relevant companies and organizations, or regularly checking reputable industry news sources and publications.
Methodology
Step 1 - Identification of Relevant Samples Size from Population Database


Step 2 - Approaches for Defining Global Market Size (Value, Volume* & Price*)

Note*: In applicable scenarios
Step 3 - Data Sources
Primary Research
- Web Analytics
- Survey Reports
- Research Institute
- Latest Research Reports
- Opinion Leaders
Secondary Research
- Annual Reports
- White Paper
- Latest Press Release
- Industry Association
- Paid Database
- Investor Presentations

Step 4 - Data Triangulation
Involves using different sources of information in order to increase the validity of a study
These sources are likely to be stakeholders in a program - participants, other researchers, program staff, other community members, and so on.
Then we put all data in single framework & apply various statistical tools to find out the dynamic on the market.
During the analysis stage, feedback from the stakeholder groups would be compared to determine areas of agreement as well as areas of divergence