

Key Insights
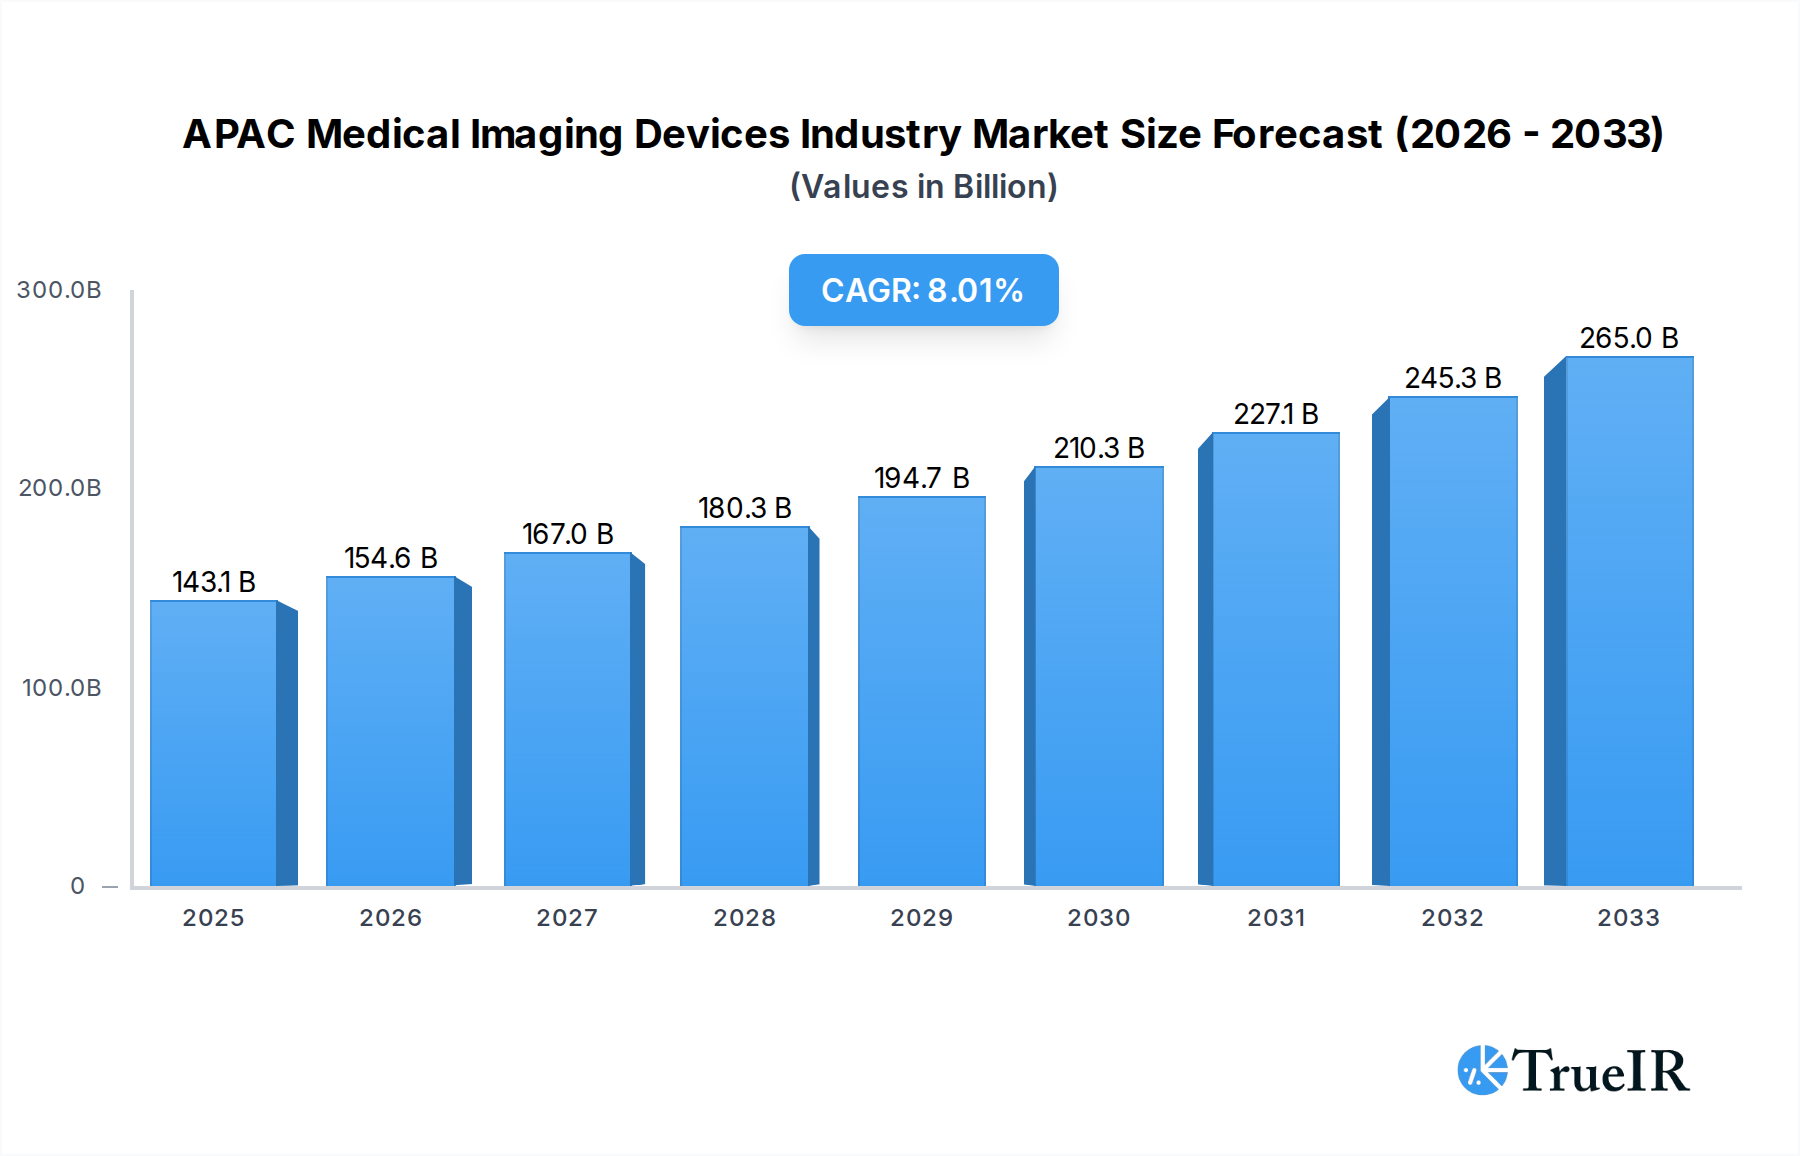
The APAC Medical Imaging Devices market is poised for robust expansion, projected to reach an estimated USD 143.12 billion in 2025. This growth is fueled by several compelling drivers, including the escalating prevalence of chronic diseases across the region, a growing demand for minimally invasive diagnostic procedures, and significant advancements in imaging technology. Governments in many APAC nations are also increasing healthcare expenditure and focusing on improving diagnostic capabilities, further bolstering market prospects. The increasing adoption of AI and machine learning in medical imaging is revolutionizing diagnostic accuracy and efficiency, creating new avenues for market penetration. Furthermore, a rising aging population necessitates more frequent and sophisticated diagnostic imaging, underpinning sustained demand.

APAC Medical Imaging Devices Industry Market Size (In Billion)
The market is expected to witness a CAGR of 8% over the forecast period of 2025-2033, indicating sustained and dynamic growth. Key segments contributing to this expansion include MRI systems, particularly low and mid-field MRI systems, which are becoming more accessible and affordable in emerging economies. Trends such as the increasing integration of cloud-based solutions for data management and remote diagnostics are also shaping the market landscape. While the market is generally optimistic, certain restraints like the high cost of advanced imaging equipment and a shortage of skilled radiologists in some developing countries could pose challenges. However, the overarching positive market dynamics, driven by technological innovation and increasing healthcare access, are expected to outweigh these limitations, ensuring a strong trajectory for the APAC Medical Imaging Devices Industry.
APAC Medical Imaging Devices Industry Company Market Share
APAC Medical Imaging Devices Industry Market Structure & Competitive Landscape
The APAC Medical Imaging Devices industry exhibits a moderately concentrated market structure, characterized by the presence of several global giants and a growing number of regional players. Innovation drivers are primarily fueled by advancements in AI-powered diagnostics, miniaturization of devices, and the increasing demand for minimally invasive imaging solutions. Regulatory impacts are significant, with varying approval processes and standards across different APAC nations influencing market entry and product adoption. Potential product substitutes include advancements in non-imaging diagnostic techniques and evolving telehealth platforms that may reduce the reliance on traditional imaging. End-user segmentation spans hospitals, diagnostic imaging centers, and specialty clinics, each with distinct purchasing behaviors and technology adoption rates. Mergers and acquisitions (M&A) activity, estimated to be in the billions, is a notable trend as larger companies seek to expand their market share, acquire innovative technologies, and gain access to emerging markets within the APAC region. Concentration ratios are gradually shifting with the rise of domestic manufacturers, particularly in China and South Korea, impacting the dominance of established players.
APAC Medical Imaging Devices Industry Market Trends & Opportunities
The APAC Medical Imaging Devices industry is experiencing robust growth, with an estimated market size projected to reach hundreds of billions by 2033. This expansion is driven by a confluence of factors including an aging population, increasing prevalence of chronic diseases, rising healthcare expenditure, and growing patient awareness of early disease detection. The market is witnessing a significant technological shift towards digital imaging solutions, with an emphasis on Artificial Intelligence (AI) and machine learning to enhance image analysis, improve diagnostic accuracy, and streamline workflows. These AI-driven insights are revolutionizing radiology, enabling faster and more precise disease identification. Furthermore, there is a growing consumer preference for less invasive imaging modalities and point-of-care diagnostic devices that offer convenience and accessibility, especially in remote or underserved areas. The competitive dynamics are intensifying, with global leaders like GE Healthcare, Siemens AG, and Koninklijke Philips N.V. competing fiercely with emerging regional powerhouses such as Shanghai United Imaging Healthcare Co. Ltd. and FUJIFILM Holdings Corporation. The market penetration rates for advanced imaging technologies are steadily increasing, indicating a strong demand for sophisticated diagnostic tools across the region. The Compound Annual Growth Rate (CAGR) is projected to remain in the high single digits, underscoring the sustained growth trajectory of this vital sector. Opportunities abound for companies that can offer cost-effective, technologically advanced, and user-friendly imaging solutions tailored to the specific needs of the diverse APAC healthcare landscape. The development of portable and connected imaging devices is also a key trend, facilitating remote diagnostics and improving healthcare access in expanding economies.
Dominant Markets & Segments in APAC Medical Imaging Devices Industry
The dominant region in the APAC Medical Imaging Devices industry, particularly within the Modality: MRI segment focusing on Low and Mid-field MRI systems, is Asia-Pacific. Within this vast region, China stands out as the leading country, driven by its massive population, burgeoning healthcare infrastructure investments, and a strong push for technological self-sufficiency in medical devices. The Modality: MRI segment itself is experiencing significant expansion, with a particular surge in demand for Low and Mid-field MRI systems. These systems offer a more cost-effective and accessible alternative to high-field MRI, making them ideal for a wider range of clinical applications and a broader patient base, especially in developing economies within APAC. The increasing adoption of these systems is attributed to their ability to address a growing need for detailed diagnostic imaging for conditions like musculoskeletal disorders, neurological issues, and abdominal pathologies, without the prohibitive costs associated with high-field machines. The focus on these lower-field MRI systems aligns with the region's efforts to democratize access to advanced medical diagnostics.
APAC Medical Imaging Devices Industry Product Analysis
Product innovation in the APAC Medical Imaging Devices industry is characterized by a drive towards enhanced imaging resolution, reduced scan times, and improved patient comfort. Key product innovations include AI-powered image reconstruction algorithms that deliver clearer images with lower radiation doses and advanced portable MRI systems that increase accessibility in remote areas. Competitive advantages are being carved out through superior image quality, user-friendly interfaces, and integrated data management solutions. The application of these devices is expanding from traditional diagnostics to include interventional procedures and real-time monitoring. Market fit is being achieved by tailoring solutions to the specific economic and clinical needs of the APAC region, focusing on affordability and versatility.
Key Drivers, Barriers & Challenges in APAC Medical Imaging Devices Industry
Key Drivers:
- Technological Advancements: Continuous innovation in AI, digital imaging, and sensor technology drives the development of more sophisticated and efficient medical imaging devices.
- Rising Healthcare Expenditure: Growing economies and increased disposable income in APAC countries lead to higher investments in healthcare infrastructure and advanced medical equipment.
- Increasing Prevalence of Chronic Diseases: The aging population and lifestyle changes contribute to a higher incidence of diseases requiring regular diagnostic imaging, such as cancer, cardiovascular diseases, and neurological disorders.
- Government Initiatives & Policies: Supportive government policies promoting medical device manufacturing and adoption, along with increased funding for public healthcare, are significant growth catalysts.
Key Challenges:
- Regulatory Complexities: Navigating diverse and often stringent regulatory frameworks across different APAC countries poses a significant hurdle for market entry and product approval.
- Supply Chain Disruptions: Global supply chain volatility, geopolitical tensions, and logistical challenges can impact the availability and cost of essential components, affecting production timelines and pricing.
- High Cost of Advanced Technology: While demand is high, the initial investment for sophisticated imaging equipment can be a barrier for smaller healthcare facilities, particularly in price-sensitive markets.
- Skilled Workforce Shortage: A lack of trained personnel to operate and maintain advanced imaging equipment can limit the full utilization of these technologies.
Growth Drivers in the APAC Medical Imaging Devices Industry Market
Key growth drivers for the APAC Medical Imaging Devices industry are predominantly technological, economic, and policy-driven. Technologically, the integration of Artificial Intelligence (AI) and Machine Learning (ML) into imaging devices is revolutionizing diagnostic accuracy and efficiency, enabling faster disease detection and personalized treatment plans. Economically, rising healthcare expenditures across the APAC region, fueled by growing middle-class populations and increased government investment in healthcare infrastructure, are directly translating into higher demand for advanced medical imaging solutions. Furthermore, favorable government initiatives and regulatory reforms in countries like China, India, and South Korea are actively encouraging domestic manufacturing and the adoption of cutting-edge medical technologies, creating a fertile ground for market expansion. The increasing prevalence of lifestyle-related diseases and an aging demographic also contribute significantly to the sustained demand for diagnostic imaging.
Challenges Impacting APAC Medical Imaging Devices Industry Growth
Several barriers and restraints are impacting the growth of the APAC Medical Imaging Devices industry. Regulatory complexities remain a significant challenge, with varying approval processes and standards across different nations hindering seamless market entry and expansion. Supply chain issues, exacerbated by global disruptions and geopolitical uncertainties, continue to affect the availability of critical components and increase manufacturing costs, potentially impacting pricing strategies and product accessibility. Competitive pressures are also intensifying, with both established global players and increasingly capable local manufacturers vying for market share, leading to price wars and the need for constant innovation. The high cost of sophisticated imaging equipment, while decreasing, still presents a barrier for some healthcare providers in price-sensitive markets. Furthermore, a shortage of skilled radiologists and technicians to operate and interpret complex imaging technologies can limit the effective adoption of these devices.
Key Players Shaping the APAC Medical Imaging Devices Industry Market
- Esaote SpA
- Hologic Inc
- GE Healthcare
- Shanghai United Imaging Healthcare Co Ltd
- Koninklijke Philips N V
- Siemens AG
- FUJIFILM Holdings Corporation
- Carestream Health
- J Morita Corporation
- Canon Medical Systems Corporation
- Teknova Medical Systems Limited
- Shimadzu Corporation
Significant APAC Medical Imaging Devices Industry Industry Milestones
- October 2022: Luxonus Inc. received approval to market its photoacoustic 3D imaging system in Japan.
- February 2022: Siemens Healthineers and Universal Medical Imaging signed a strategic collaboration agreement to help primary healthcare facilities in China improve the accuracy of their image screening and disease diagnosis using cutting-edge imaging diagnostic tools and remote scanning assistant equipment from Siemens Healthineers and the local medical imaging experts at Universal Medical Imaging.
Future Outlook for APAC Medical Imaging Devices Industry Market
The future outlook for the APAC Medical Imaging Devices industry is exceptionally promising, driven by sustained demand for advanced diagnostic solutions and continuous technological innovation. Key growth catalysts include the widespread adoption of AI and ML for enhanced diagnostic capabilities, the expansion of portable and point-of-care imaging devices to improve healthcare accessibility, and the increasing focus on personalized medicine. Strategic opportunities lie in developing cost-effective, user-friendly, and interoperable imaging systems that cater to the diverse needs of emerging economies within the region. The market potential is further amplified by increasing healthcare investments and supportive government policies aimed at boosting domestic medical device manufacturing and adoption. The trend towards telehealth and remote diagnostics will also play a crucial role in expanding market reach and enhancing patient care across the vast APAC landscape.
APAC Medical Imaging Devices Industry Segmentation
-
1. Modality
-
1.1. MRI
- 1.1.1. Low and mid field MRI systems (<1.5 T)
- 1.1.2. High field MRI systems (1.5-3 T)
- 1.1.3. Very Hig
-
1.2. Computed Tomography
- 1.2.1. Low End Scanners (~16-Slice)
- 1.2.2. Mid Range Scanners (~64-Slice)
- 1.2.3. High End Scanners (128-Slice and More)
-
1.3. Ultrasound
- 1.3.1. 2D Ultrasound
- 1.3.2. 3D Ultrasound
- 1.3.3. Other Types of Ultrasound
-
1.4. X-Ray
- 1.4.1. Analog Systems
- 1.4.2. Digital Systems
-
1.5. Nuclear Imaging
- 1.5.1. Positron Emission Tomography (PET)
- 1.5.2. Single Photon Emission Computed Tomography (SPECT)
- 1.6. Fluoroscopy
- 1.7. Mammography
-
1.1. MRI
-
2. Application
- 2.1. Cardiology
- 2.2. Oncology
- 2.3. Neurology
- 2.4. Orthopedics
- 2.5. Gastroenterology
- 2.6. Gynecology
- 2.7. Other Applications
-
3. End-User
- 3.1. Hospital
- 3.2. Diagnostic Centers
- 3.3. Other End-Users
-
4. Geography
- 4.1. China
- 4.2. Japan
- 4.3. India
- 4.4. Australia
- 4.5. South Korea
- 4.6. Rest of Asia-Pacific
APAC Medical Imaging Devices Industry Segmentation By Geography
- 1. China
- 2. Japan
- 3. India
- 4. Australia
- 5. South Korea
- 6. Rest of Asia Pacific
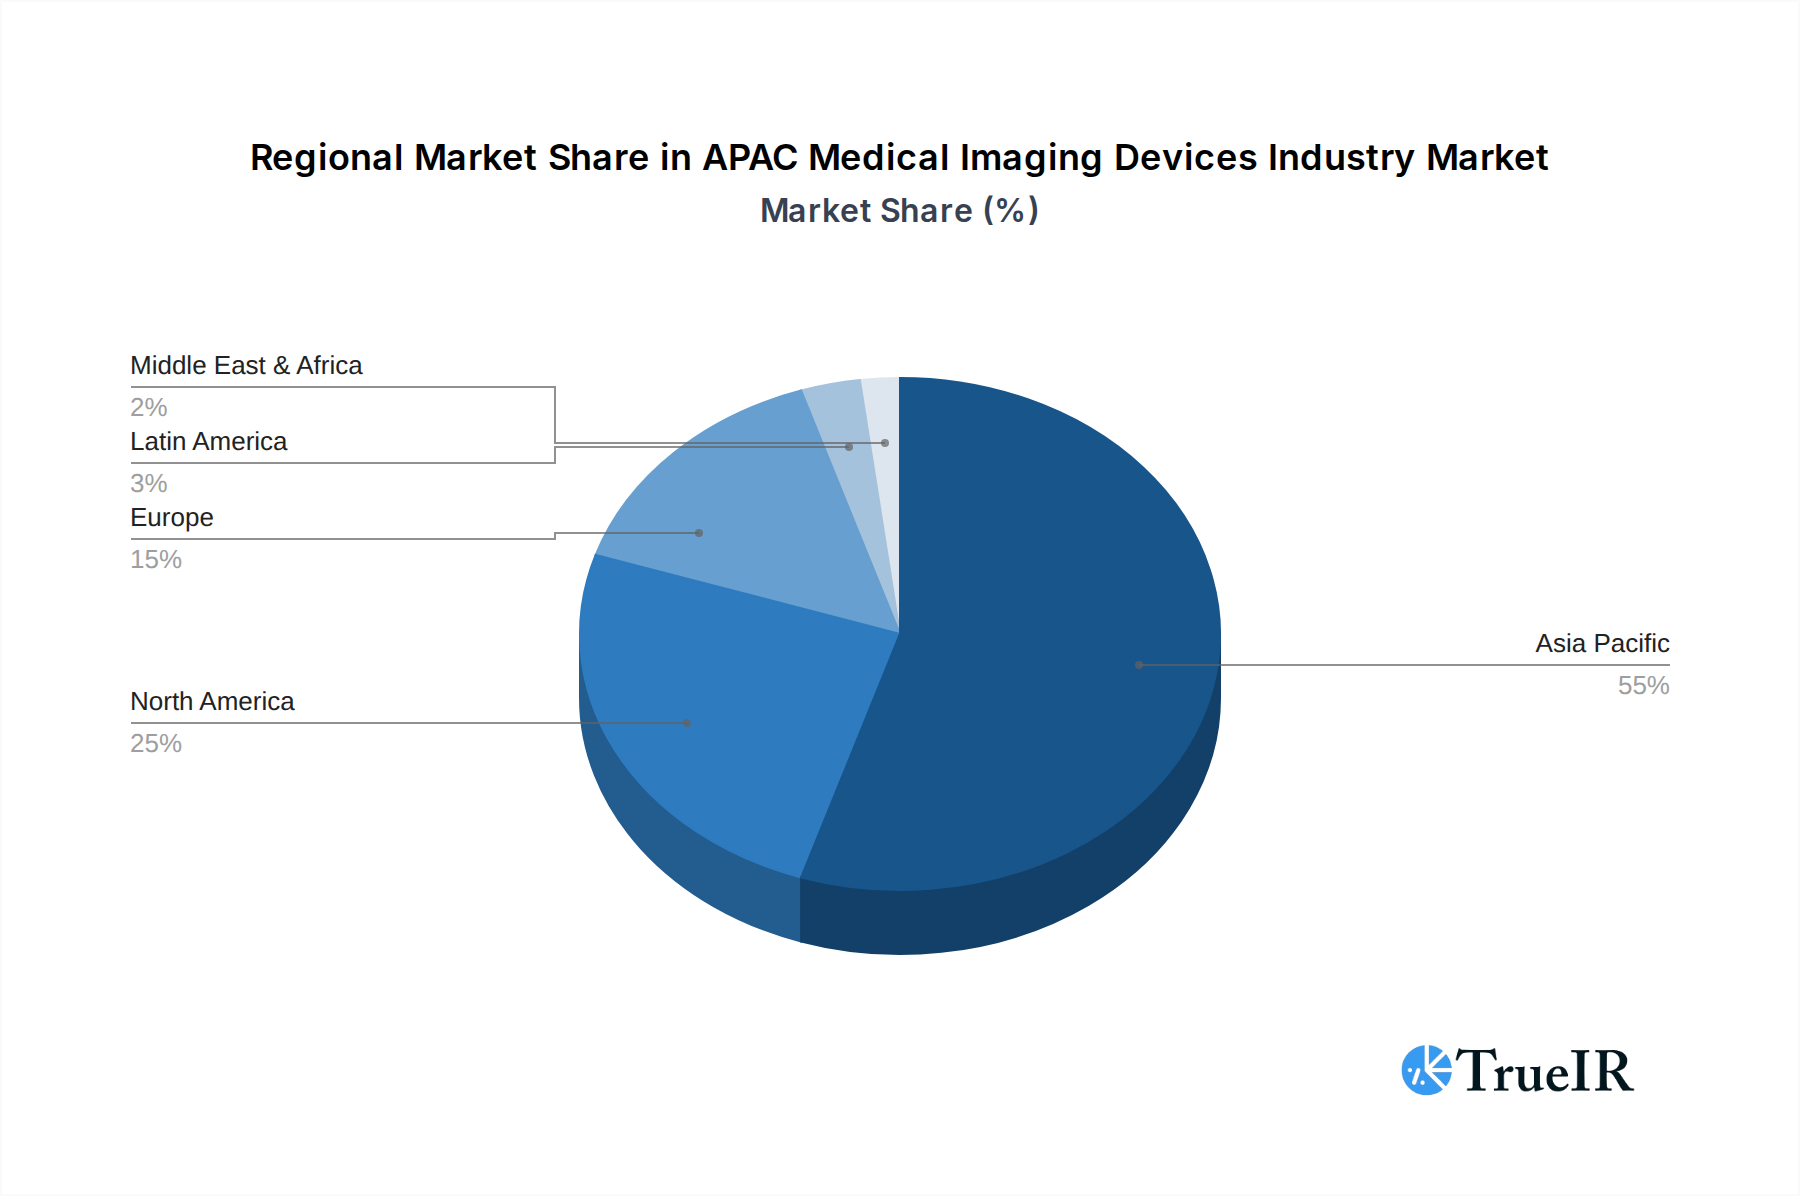
APAC Medical Imaging Devices Industry Regional Market Share
Geographic Coverage of APAC Medical Imaging Devices Industry
APAC Medical Imaging Devices Industry REPORT HIGHLIGHTS
| Aspects | Details |
|---|---|
| Study Period | 2020-2034 |
| Base Year | 2025 |
| Estimated Year | 2026 |
| Forecast Period | 2026-2034 |
| Historical Period | 2020-2025 |
| Growth Rate | CAGR of 8% from 2020-2034 |
| Segmentation |
|
Table of Contents
- 1. Introduction
- 1.1. Research Scope
- 1.2. Market Segmentation
- 1.3. Research Objective
- 1.4. Definitions and Assumptions
- 2. Executive Summary
- 2.1. Market Snapshot
- 3. Market Dynamics
- 3.1. Market Drivers
- 3.2. Market Restrains
- 3.3. Market Trends
- 3.4. Market Opportunities
- 4. Market Factor Analysis
- 4.1. Porters Five Forces
- 4.1.1. Bargaining Power of Suppliers
- 4.1.2. Bargaining Power of Buyers
- 4.1.3. Threat of New Entrants
- 4.1.4. Threat of Substitutes
- 4.1.5. Competitive Rivalry
- 4.2. PESTEL analysis
- 4.3. BCG Analysis
- 4.3.1. Stars (High Growth, High Market Share)
- 4.3.2. Cash Cows (Low Growth, High Market Share)
- 4.3.3. Question Mark (High Growth, Low Market Share)
- 4.3.4. Dogs (Low Growth, Low Market Share)
- 4.4. Ansoff Matrix Analysis
- 4.5. Supply Chain Analysis
- 4.6. Regulatory Landscape
- 4.7. Current Market Potential and Opportunity Assessment (TAM–SAM–SOM Framework)
- 4.8. TIR Analyst Note
- 4.1. Porters Five Forces
- 5. Market Analysis, Insights and Forecast 2021-2033
- 5.1. Market Analysis, Insights and Forecast - by Modality
- 5.1.1. MRI
- 5.1.1.1. Low and mid field MRI systems (<1.5 T)
- 5.1.1.2. High field MRI systems (1.5-3 T)
- 5.1.1.3. Very Hig
- 5.1.2. Computed Tomography
- 5.1.2.1. Low End Scanners (~16-Slice)
- 5.1.2.2. Mid Range Scanners (~64-Slice)
- 5.1.2.3. High End Scanners (128-Slice and More)
- 5.1.3. Ultrasound
- 5.1.3.1. 2D Ultrasound
- 5.1.3.2. 3D Ultrasound
- 5.1.3.3. Other Types of Ultrasound
- 5.1.4. X-Ray
- 5.1.4.1. Analog Systems
- 5.1.4.2. Digital Systems
- 5.1.5. Nuclear Imaging
- 5.1.5.1. Positron Emission Tomography (PET)
- 5.1.5.2. Single Photon Emission Computed Tomography (SPECT)
- 5.1.6. Fluoroscopy
- 5.1.7. Mammography
- 5.1.1. MRI
- 5.2. Market Analysis, Insights and Forecast - by Application
- 5.2.1. Cardiology
- 5.2.2. Oncology
- 5.2.3. Neurology
- 5.2.4. Orthopedics
- 5.2.5. Gastroenterology
- 5.2.6. Gynecology
- 5.2.7. Other Applications
- 5.3. Market Analysis, Insights and Forecast - by End-User
- 5.3.1. Hospital
- 5.3.2. Diagnostic Centers
- 5.3.3. Other End-Users
- 5.4. Market Analysis, Insights and Forecast - by Geography
- 5.4.1. China
- 5.4.2. Japan
- 5.4.3. India
- 5.4.4. Australia
- 5.4.5. South Korea
- 5.4.6. Rest of Asia-Pacific
- 5.5. Market Analysis, Insights and Forecast - by Region
- 5.5.1. China
- 5.5.2. Japan
- 5.5.3. India
- 5.5.4. Australia
- 5.5.5. South Korea
- 5.5.6. Rest of Asia Pacific
- 5.1. Market Analysis, Insights and Forecast - by Modality
- 6. Global APAC Medical Imaging Devices Industry Analysis, Insights and Forecast, 2021-2033
- 6.1. Market Analysis, Insights and Forecast - by Modality
- 6.1.1. MRI
- 6.1.1.1. Low and mid field MRI systems (<1.5 T)
- 6.1.1.2. High field MRI systems (1.5-3 T)
- 6.1.1.3. Very Hig
- 6.1.2. Computed Tomography
- 6.1.2.1. Low End Scanners (~16-Slice)
- 6.1.2.2. Mid Range Scanners (~64-Slice)
- 6.1.2.3. High End Scanners (128-Slice and More)
- 6.1.3. Ultrasound
- 6.1.3.1. 2D Ultrasound
- 6.1.3.2. 3D Ultrasound
- 6.1.3.3. Other Types of Ultrasound
- 6.1.4. X-Ray
- 6.1.4.1. Analog Systems
- 6.1.4.2. Digital Systems
- 6.1.5. Nuclear Imaging
- 6.1.5.1. Positron Emission Tomography (PET)
- 6.1.5.2. Single Photon Emission Computed Tomography (SPECT)
- 6.1.6. Fluoroscopy
- 6.1.7. Mammography
- 6.1.1. MRI
- 6.2. Market Analysis, Insights and Forecast - by Application
- 6.2.1. Cardiology
- 6.2.2. Oncology
- 6.2.3. Neurology
- 6.2.4. Orthopedics
- 6.2.5. Gastroenterology
- 6.2.6. Gynecology
- 6.2.7. Other Applications
- 6.3. Market Analysis, Insights and Forecast - by End-User
- 6.3.1. Hospital
- 6.3.2. Diagnostic Centers
- 6.3.3. Other End-Users
- 6.4. Market Analysis, Insights and Forecast - by Geography
- 6.4.1. China
- 6.4.2. Japan
- 6.4.3. India
- 6.4.4. Australia
- 6.4.5. South Korea
- 6.4.6. Rest of Asia-Pacific
- 6.1. Market Analysis, Insights and Forecast - by Modality
- 7. China APAC Medical Imaging Devices Industry Analysis, Insights and Forecast, 2020-2032
- 7.1. Market Analysis, Insights and Forecast - by Modality
- 7.1.1. MRI
- 7.1.1.1. Low and mid field MRI systems (<1.5 T)
- 7.1.1.2. High field MRI systems (1.5-3 T)
- 7.1.1.3. Very Hig
- 7.1.2. Computed Tomography
- 7.1.2.1. Low End Scanners (~16-Slice)
- 7.1.2.2. Mid Range Scanners (~64-Slice)
- 7.1.2.3. High End Scanners (128-Slice and More)
- 7.1.3. Ultrasound
- 7.1.3.1. 2D Ultrasound
- 7.1.3.2. 3D Ultrasound
- 7.1.3.3. Other Types of Ultrasound
- 7.1.4. X-Ray
- 7.1.4.1. Analog Systems
- 7.1.4.2. Digital Systems
- 7.1.5. Nuclear Imaging
- 7.1.5.1. Positron Emission Tomography (PET)
- 7.1.5.2. Single Photon Emission Computed Tomography (SPECT)
- 7.1.6. Fluoroscopy
- 7.1.7. Mammography
- 7.1.1. MRI
- 7.2. Market Analysis, Insights and Forecast - by Application
- 7.2.1. Cardiology
- 7.2.2. Oncology
- 7.2.3. Neurology
- 7.2.4. Orthopedics
- 7.2.5. Gastroenterology
- 7.2.6. Gynecology
- 7.2.7. Other Applications
- 7.3. Market Analysis, Insights and Forecast - by End-User
- 7.3.1. Hospital
- 7.3.2. Diagnostic Centers
- 7.3.3. Other End-Users
- 7.4. Market Analysis, Insights and Forecast - by Geography
- 7.4.1. China
- 7.4.2. Japan
- 7.4.3. India
- 7.4.4. Australia
- 7.4.5. South Korea
- 7.4.6. Rest of Asia-Pacific
- 7.1. Market Analysis, Insights and Forecast - by Modality
- 8. Japan APAC Medical Imaging Devices Industry Analysis, Insights and Forecast, 2020-2032
- 8.1. Market Analysis, Insights and Forecast - by Modality
- 8.1.1. MRI
- 8.1.1.1. Low and mid field MRI systems (<1.5 T)
- 8.1.1.2. High field MRI systems (1.5-3 T)
- 8.1.1.3. Very Hig
- 8.1.2. Computed Tomography
- 8.1.2.1. Low End Scanners (~16-Slice)
- 8.1.2.2. Mid Range Scanners (~64-Slice)
- 8.1.2.3. High End Scanners (128-Slice and More)
- 8.1.3. Ultrasound
- 8.1.3.1. 2D Ultrasound
- 8.1.3.2. 3D Ultrasound
- 8.1.3.3. Other Types of Ultrasound
- 8.1.4. X-Ray
- 8.1.4.1. Analog Systems
- 8.1.4.2. Digital Systems
- 8.1.5. Nuclear Imaging
- 8.1.5.1. Positron Emission Tomography (PET)
- 8.1.5.2. Single Photon Emission Computed Tomography (SPECT)
- 8.1.6. Fluoroscopy
- 8.1.7. Mammography
- 8.1.1. MRI
- 8.2. Market Analysis, Insights and Forecast - by Application
- 8.2.1. Cardiology
- 8.2.2. Oncology
- 8.2.3. Neurology
- 8.2.4. Orthopedics
- 8.2.5. Gastroenterology
- 8.2.6. Gynecology
- 8.2.7. Other Applications
- 8.3. Market Analysis, Insights and Forecast - by End-User
- 8.3.1. Hospital
- 8.3.2. Diagnostic Centers
- 8.3.3. Other End-Users
- 8.4. Market Analysis, Insights and Forecast - by Geography
- 8.4.1. China
- 8.4.2. Japan
- 8.4.3. India
- 8.4.4. Australia
- 8.4.5. South Korea
- 8.4.6. Rest of Asia-Pacific
- 8.1. Market Analysis, Insights and Forecast - by Modality
- 9. India APAC Medical Imaging Devices Industry Analysis, Insights and Forecast, 2020-2032
- 9.1. Market Analysis, Insights and Forecast - by Modality
- 9.1.1. MRI
- 9.1.1.1. Low and mid field MRI systems (<1.5 T)
- 9.1.1.2. High field MRI systems (1.5-3 T)
- 9.1.1.3. Very Hig
- 9.1.2. Computed Tomography
- 9.1.2.1. Low End Scanners (~16-Slice)
- 9.1.2.2. Mid Range Scanners (~64-Slice)
- 9.1.2.3. High End Scanners (128-Slice and More)
- 9.1.3. Ultrasound
- 9.1.3.1. 2D Ultrasound
- 9.1.3.2. 3D Ultrasound
- 9.1.3.3. Other Types of Ultrasound
- 9.1.4. X-Ray
- 9.1.4.1. Analog Systems
- 9.1.4.2. Digital Systems
- 9.1.5. Nuclear Imaging
- 9.1.5.1. Positron Emission Tomography (PET)
- 9.1.5.2. Single Photon Emission Computed Tomography (SPECT)
- 9.1.6. Fluoroscopy
- 9.1.7. Mammography
- 9.1.1. MRI
- 9.2. Market Analysis, Insights and Forecast - by Application
- 9.2.1. Cardiology
- 9.2.2. Oncology
- 9.2.3. Neurology
- 9.2.4. Orthopedics
- 9.2.5. Gastroenterology
- 9.2.6. Gynecology
- 9.2.7. Other Applications
- 9.3. Market Analysis, Insights and Forecast - by End-User
- 9.3.1. Hospital
- 9.3.2. Diagnostic Centers
- 9.3.3. Other End-Users
- 9.4. Market Analysis, Insights and Forecast - by Geography
- 9.4.1. China
- 9.4.2. Japan
- 9.4.3. India
- 9.4.4. Australia
- 9.4.5. South Korea
- 9.4.6. Rest of Asia-Pacific
- 9.1. Market Analysis, Insights and Forecast - by Modality
- 10. Australia APAC Medical Imaging Devices Industry Analysis, Insights and Forecast, 2020-2032
- 10.1. Market Analysis, Insights and Forecast - by Modality
- 10.1.1. MRI
- 10.1.1.1. Low and mid field MRI systems (<1.5 T)
- 10.1.1.2. High field MRI systems (1.5-3 T)
- 10.1.1.3. Very Hig
- 10.1.2. Computed Tomography
- 10.1.2.1. Low End Scanners (~16-Slice)
- 10.1.2.2. Mid Range Scanners (~64-Slice)
- 10.1.2.3. High End Scanners (128-Slice and More)
- 10.1.3. Ultrasound
- 10.1.3.1. 2D Ultrasound
- 10.1.3.2. 3D Ultrasound
- 10.1.3.3. Other Types of Ultrasound
- 10.1.4. X-Ray
- 10.1.4.1. Analog Systems
- 10.1.4.2. Digital Systems
- 10.1.5. Nuclear Imaging
- 10.1.5.1. Positron Emission Tomography (PET)
- 10.1.5.2. Single Photon Emission Computed Tomography (SPECT)
- 10.1.6. Fluoroscopy
- 10.1.7. Mammography
- 10.1.1. MRI
- 10.2. Market Analysis, Insights and Forecast - by Application
- 10.2.1. Cardiology
- 10.2.2. Oncology
- 10.2.3. Neurology
- 10.2.4. Orthopedics
- 10.2.5. Gastroenterology
- 10.2.6. Gynecology
- 10.2.7. Other Applications
- 10.3. Market Analysis, Insights and Forecast - by End-User
- 10.3.1. Hospital
- 10.3.2. Diagnostic Centers
- 10.3.3. Other End-Users
- 10.4. Market Analysis, Insights and Forecast - by Geography
- 10.4.1. China
- 10.4.2. Japan
- 10.4.3. India
- 10.4.4. Australia
- 10.4.5. South Korea
- 10.4.6. Rest of Asia-Pacific
- 10.1. Market Analysis, Insights and Forecast - by Modality
- 11. South Korea APAC Medical Imaging Devices Industry Analysis, Insights and Forecast, 2020-2032
- 11.1. Market Analysis, Insights and Forecast - by Modality
- 11.1.1. MRI
- 11.1.1.1. Low and mid field MRI systems (<1.5 T)
- 11.1.1.2. High field MRI systems (1.5-3 T)
- 11.1.1.3. Very Hig
- 11.1.2. Computed Tomography
- 11.1.2.1. Low End Scanners (~16-Slice)
- 11.1.2.2. Mid Range Scanners (~64-Slice)
- 11.1.2.3. High End Scanners (128-Slice and More)
- 11.1.3. Ultrasound
- 11.1.3.1. 2D Ultrasound
- 11.1.3.2. 3D Ultrasound
- 11.1.3.3. Other Types of Ultrasound
- 11.1.4. X-Ray
- 11.1.4.1. Analog Systems
- 11.1.4.2. Digital Systems
- 11.1.5. Nuclear Imaging
- 11.1.5.1. Positron Emission Tomography (PET)
- 11.1.5.2. Single Photon Emission Computed Tomography (SPECT)
- 11.1.6. Fluoroscopy
- 11.1.7. Mammography
- 11.1.1. MRI
- 11.2. Market Analysis, Insights and Forecast - by Application
- 11.2.1. Cardiology
- 11.2.2. Oncology
- 11.2.3. Neurology
- 11.2.4. Orthopedics
- 11.2.5. Gastroenterology
- 11.2.6. Gynecology
- 11.2.7. Other Applications
- 11.3. Market Analysis, Insights and Forecast - by End-User
- 11.3.1. Hospital
- 11.3.2. Diagnostic Centers
- 11.3.3. Other End-Users
- 11.4. Market Analysis, Insights and Forecast - by Geography
- 11.4.1. China
- 11.4.2. Japan
- 11.4.3. India
- 11.4.4. Australia
- 11.4.5. South Korea
- 11.4.6. Rest of Asia-Pacific
- 11.1. Market Analysis, Insights and Forecast - by Modality
- 12. Rest of Asia Pacific APAC Medical Imaging Devices Industry Analysis, Insights and Forecast, 2020-2032
- 12.1. Market Analysis, Insights and Forecast - by Modality
- 12.1.1. MRI
- 12.1.1.1. Low and mid field MRI systems (<1.5 T)
- 12.1.1.2. High field MRI systems (1.5-3 T)
- 12.1.1.3. Very Hig
- 12.1.2. Computed Tomography
- 12.1.2.1. Low End Scanners (~16-Slice)
- 12.1.2.2. Mid Range Scanners (~64-Slice)
- 12.1.2.3. High End Scanners (128-Slice and More)
- 12.1.3. Ultrasound
- 12.1.3.1. 2D Ultrasound
- 12.1.3.2. 3D Ultrasound
- 12.1.3.3. Other Types of Ultrasound
- 12.1.4. X-Ray
- 12.1.4.1. Analog Systems
- 12.1.4.2. Digital Systems
- 12.1.5. Nuclear Imaging
- 12.1.5.1. Positron Emission Tomography (PET)
- 12.1.5.2. Single Photon Emission Computed Tomography (SPECT)
- 12.1.6. Fluoroscopy
- 12.1.7. Mammography
- 12.1.1. MRI
- 12.2. Market Analysis, Insights and Forecast - by Application
- 12.2.1. Cardiology
- 12.2.2. Oncology
- 12.2.3. Neurology
- 12.2.4. Orthopedics
- 12.2.5. Gastroenterology
- 12.2.6. Gynecology
- 12.2.7. Other Applications
- 12.3. Market Analysis, Insights and Forecast - by End-User
- 12.3.1. Hospital
- 12.3.2. Diagnostic Centers
- 12.3.3. Other End-Users
- 12.4. Market Analysis, Insights and Forecast - by Geography
- 12.4.1. China
- 12.4.2. Japan
- 12.4.3. India
- 12.4.4. Australia
- 12.4.5. South Korea
- 12.4.6. Rest of Asia-Pacific
- 12.1. Market Analysis, Insights and Forecast - by Modality
- 13. Competitive Analysis
- 13.1. Company Profiles
- 13.1.1 Esaote SpA
- 13.1.1.1. Company Overview
- 13.1.1.2. Products
- 13.1.1.3. Company Financials
- 13.1.1.4. SWOT Analysis
- 13.1.2 Hologic Inc
- 13.1.2.1. Company Overview
- 13.1.2.2. Products
- 13.1.2.3. Company Financials
- 13.1.2.4. SWOT Analysis
- 13.1.3 GE Healthcare
- 13.1.3.1. Company Overview
- 13.1.3.2. Products
- 13.1.3.3. Company Financials
- 13.1.3.4. SWOT Analysis
- 13.1.4 Shanghai United Imaging Healthcare Co Ltd
- 13.1.4.1. Company Overview
- 13.1.4.2. Products
- 13.1.4.3. Company Financials
- 13.1.4.4. SWOT Analysis
- 13.1.5 Koninklijke Philips N V
- 13.1.5.1. Company Overview
- 13.1.5.2. Products
- 13.1.5.3. Company Financials
- 13.1.5.4. SWOT Analysis
- 13.1.6 Siemens AG
- 13.1.6.1. Company Overview
- 13.1.6.2. Products
- 13.1.6.3. Company Financials
- 13.1.6.4. SWOT Analysis
- 13.1.7 FUJIFILM Holdings Corporation
- 13.1.7.1. Company Overview
- 13.1.7.2. Products
- 13.1.7.3. Company Financials
- 13.1.7.4. SWOT Analysis
- 13.1.8 Carestream Health
- 13.1.8.1. Company Overview
- 13.1.8.2. Products
- 13.1.8.3. Company Financials
- 13.1.8.4. SWOT Analysis
- 13.1.9 J Morita Corporation
- 13.1.9.1. Company Overview
- 13.1.9.2. Products
- 13.1.9.3. Company Financials
- 13.1.9.4. SWOT Analysis
- 13.1.10 Canon Medical Systems Corporation
- 13.1.10.1. Company Overview
- 13.1.10.2. Products
- 13.1.10.3. Company Financials
- 13.1.10.4. SWOT Analysis
- 13.1.11 Teknova Medical Systems Limited
- 13.1.11.1. Company Overview
- 13.1.11.2. Products
- 13.1.11.3. Company Financials
- 13.1.11.4. SWOT Analysis
- 13.1.12 Shimadzu Corporation
- 13.1.12.1. Company Overview
- 13.1.12.2. Products
- 13.1.12.3. Company Financials
- 13.1.12.4. SWOT Analysis
- 13.1.1 Esaote SpA
- 13.2. Market Entropy
- 13.2.1 Company's Key Areas Served
- 13.2.2 Recent Developments
- 13.3. Company Market Share Analysis 2025
- 13.3.1 Top 5 Companies Market Share Analysis
- 13.3.2 Top 3 Companies Market Share Analysis
- 13.4. List of Potential Customers
- 14. Research Methodology
List of Figures
- Figure 1: Global APAC Medical Imaging Devices Industry Revenue Breakdown (billion, %) by Region 2025 & 2033
- Figure 2: Global APAC Medical Imaging Devices Industry Volume Breakdown (K Unit, %) by Region 2025 & 2033
- Figure 3: China APAC Medical Imaging Devices Industry Revenue (billion), by Modality 2025 & 2033
- Figure 4: China APAC Medical Imaging Devices Industry Volume (K Unit), by Modality 2025 & 2033
- Figure 5: China APAC Medical Imaging Devices Industry Revenue Share (%), by Modality 2025 & 2033
- Figure 6: China APAC Medical Imaging Devices Industry Volume Share (%), by Modality 2025 & 2033
- Figure 7: China APAC Medical Imaging Devices Industry Revenue (billion), by Application 2025 & 2033
- Figure 8: China APAC Medical Imaging Devices Industry Volume (K Unit), by Application 2025 & 2033
- Figure 9: China APAC Medical Imaging Devices Industry Revenue Share (%), by Application 2025 & 2033
- Figure 10: China APAC Medical Imaging Devices Industry Volume Share (%), by Application 2025 & 2033
- Figure 11: China APAC Medical Imaging Devices Industry Revenue (billion), by End-User 2025 & 2033
- Figure 12: China APAC Medical Imaging Devices Industry Volume (K Unit), by End-User 2025 & 2033
- Figure 13: China APAC Medical Imaging Devices Industry Revenue Share (%), by End-User 2025 & 2033
- Figure 14: China APAC Medical Imaging Devices Industry Volume Share (%), by End-User 2025 & 2033
- Figure 15: China APAC Medical Imaging Devices Industry Revenue (billion), by Geography 2025 & 2033
- Figure 16: China APAC Medical Imaging Devices Industry Volume (K Unit), by Geography 2025 & 2033
- Figure 17: China APAC Medical Imaging Devices Industry Revenue Share (%), by Geography 2025 & 2033
- Figure 18: China APAC Medical Imaging Devices Industry Volume Share (%), by Geography 2025 & 2033
- Figure 19: China APAC Medical Imaging Devices Industry Revenue (billion), by Country 2025 & 2033
- Figure 20: China APAC Medical Imaging Devices Industry Volume (K Unit), by Country 2025 & 2033
- Figure 21: China APAC Medical Imaging Devices Industry Revenue Share (%), by Country 2025 & 2033
- Figure 22: China APAC Medical Imaging Devices Industry Volume Share (%), by Country 2025 & 2033
- Figure 23: Japan APAC Medical Imaging Devices Industry Revenue (billion), by Modality 2025 & 2033
- Figure 24: Japan APAC Medical Imaging Devices Industry Volume (K Unit), by Modality 2025 & 2033
- Figure 25: Japan APAC Medical Imaging Devices Industry Revenue Share (%), by Modality 2025 & 2033
- Figure 26: Japan APAC Medical Imaging Devices Industry Volume Share (%), by Modality 2025 & 2033
- Figure 27: Japan APAC Medical Imaging Devices Industry Revenue (billion), by Application 2025 & 2033
- Figure 28: Japan APAC Medical Imaging Devices Industry Volume (K Unit), by Application 2025 & 2033
- Figure 29: Japan APAC Medical Imaging Devices Industry Revenue Share (%), by Application 2025 & 2033
- Figure 30: Japan APAC Medical Imaging Devices Industry Volume Share (%), by Application 2025 & 2033
- Figure 31: Japan APAC Medical Imaging Devices Industry Revenue (billion), by End-User 2025 & 2033
- Figure 32: Japan APAC Medical Imaging Devices Industry Volume (K Unit), by End-User 2025 & 2033
- Figure 33: Japan APAC Medical Imaging Devices Industry Revenue Share (%), by End-User 2025 & 2033
- Figure 34: Japan APAC Medical Imaging Devices Industry Volume Share (%), by End-User 2025 & 2033
- Figure 35: Japan APAC Medical Imaging Devices Industry Revenue (billion), by Geography 2025 & 2033
- Figure 36: Japan APAC Medical Imaging Devices Industry Volume (K Unit), by Geography 2025 & 2033
- Figure 37: Japan APAC Medical Imaging Devices Industry Revenue Share (%), by Geography 2025 & 2033
- Figure 38: Japan APAC Medical Imaging Devices Industry Volume Share (%), by Geography 2025 & 2033
- Figure 39: Japan APAC Medical Imaging Devices Industry Revenue (billion), by Country 2025 & 2033
- Figure 40: Japan APAC Medical Imaging Devices Industry Volume (K Unit), by Country 2025 & 2033
- Figure 41: Japan APAC Medical Imaging Devices Industry Revenue Share (%), by Country 2025 & 2033
- Figure 42: Japan APAC Medical Imaging Devices Industry Volume Share (%), by Country 2025 & 2033
- Figure 43: India APAC Medical Imaging Devices Industry Revenue (billion), by Modality 2025 & 2033
- Figure 44: India APAC Medical Imaging Devices Industry Volume (K Unit), by Modality 2025 & 2033
- Figure 45: India APAC Medical Imaging Devices Industry Revenue Share (%), by Modality 2025 & 2033
- Figure 46: India APAC Medical Imaging Devices Industry Volume Share (%), by Modality 2025 & 2033
- Figure 47: India APAC Medical Imaging Devices Industry Revenue (billion), by Application 2025 & 2033
- Figure 48: India APAC Medical Imaging Devices Industry Volume (K Unit), by Application 2025 & 2033
- Figure 49: India APAC Medical Imaging Devices Industry Revenue Share (%), by Application 2025 & 2033
- Figure 50: India APAC Medical Imaging Devices Industry Volume Share (%), by Application 2025 & 2033
- Figure 51: India APAC Medical Imaging Devices Industry Revenue (billion), by End-User 2025 & 2033
- Figure 52: India APAC Medical Imaging Devices Industry Volume (K Unit), by End-User 2025 & 2033
- Figure 53: India APAC Medical Imaging Devices Industry Revenue Share (%), by End-User 2025 & 2033
- Figure 54: India APAC Medical Imaging Devices Industry Volume Share (%), by End-User 2025 & 2033
- Figure 55: India APAC Medical Imaging Devices Industry Revenue (billion), by Geography 2025 & 2033
- Figure 56: India APAC Medical Imaging Devices Industry Volume (K Unit), by Geography 2025 & 2033
- Figure 57: India APAC Medical Imaging Devices Industry Revenue Share (%), by Geography 2025 & 2033
- Figure 58: India APAC Medical Imaging Devices Industry Volume Share (%), by Geography 2025 & 2033
- Figure 59: India APAC Medical Imaging Devices Industry Revenue (billion), by Country 2025 & 2033
- Figure 60: India APAC Medical Imaging Devices Industry Volume (K Unit), by Country 2025 & 2033
- Figure 61: India APAC Medical Imaging Devices Industry Revenue Share (%), by Country 2025 & 2033
- Figure 62: India APAC Medical Imaging Devices Industry Volume Share (%), by Country 2025 & 2033
- Figure 63: Australia APAC Medical Imaging Devices Industry Revenue (billion), by Modality 2025 & 2033
- Figure 64: Australia APAC Medical Imaging Devices Industry Volume (K Unit), by Modality 2025 & 2033
- Figure 65: Australia APAC Medical Imaging Devices Industry Revenue Share (%), by Modality 2025 & 2033
- Figure 66: Australia APAC Medical Imaging Devices Industry Volume Share (%), by Modality 2025 & 2033
- Figure 67: Australia APAC Medical Imaging Devices Industry Revenue (billion), by Application 2025 & 2033
- Figure 68: Australia APAC Medical Imaging Devices Industry Volume (K Unit), by Application 2025 & 2033
- Figure 69: Australia APAC Medical Imaging Devices Industry Revenue Share (%), by Application 2025 & 2033
- Figure 70: Australia APAC Medical Imaging Devices Industry Volume Share (%), by Application 2025 & 2033
- Figure 71: Australia APAC Medical Imaging Devices Industry Revenue (billion), by End-User 2025 & 2033
- Figure 72: Australia APAC Medical Imaging Devices Industry Volume (K Unit), by End-User 2025 & 2033
- Figure 73: Australia APAC Medical Imaging Devices Industry Revenue Share (%), by End-User 2025 & 2033
- Figure 74: Australia APAC Medical Imaging Devices Industry Volume Share (%), by End-User 2025 & 2033
- Figure 75: Australia APAC Medical Imaging Devices Industry Revenue (billion), by Geography 2025 & 2033
- Figure 76: Australia APAC Medical Imaging Devices Industry Volume (K Unit), by Geography 2025 & 2033
- Figure 77: Australia APAC Medical Imaging Devices Industry Revenue Share (%), by Geography 2025 & 2033
- Figure 78: Australia APAC Medical Imaging Devices Industry Volume Share (%), by Geography 2025 & 2033
- Figure 79: Australia APAC Medical Imaging Devices Industry Revenue (billion), by Country 2025 & 2033
- Figure 80: Australia APAC Medical Imaging Devices Industry Volume (K Unit), by Country 2025 & 2033
- Figure 81: Australia APAC Medical Imaging Devices Industry Revenue Share (%), by Country 2025 & 2033
- Figure 82: Australia APAC Medical Imaging Devices Industry Volume Share (%), by Country 2025 & 2033
- Figure 83: South Korea APAC Medical Imaging Devices Industry Revenue (billion), by Modality 2025 & 2033
- Figure 84: South Korea APAC Medical Imaging Devices Industry Volume (K Unit), by Modality 2025 & 2033
- Figure 85: South Korea APAC Medical Imaging Devices Industry Revenue Share (%), by Modality 2025 & 2033
- Figure 86: South Korea APAC Medical Imaging Devices Industry Volume Share (%), by Modality 2025 & 2033
- Figure 87: South Korea APAC Medical Imaging Devices Industry Revenue (billion), by Application 2025 & 2033
- Figure 88: South Korea APAC Medical Imaging Devices Industry Volume (K Unit), by Application 2025 & 2033
- Figure 89: South Korea APAC Medical Imaging Devices Industry Revenue Share (%), by Application 2025 & 2033
- Figure 90: South Korea APAC Medical Imaging Devices Industry Volume Share (%), by Application 2025 & 2033
- Figure 91: South Korea APAC Medical Imaging Devices Industry Revenue (billion), by End-User 2025 & 2033
- Figure 92: South Korea APAC Medical Imaging Devices Industry Volume (K Unit), by End-User 2025 & 2033
- Figure 93: South Korea APAC Medical Imaging Devices Industry Revenue Share (%), by End-User 2025 & 2033
- Figure 94: South Korea APAC Medical Imaging Devices Industry Volume Share (%), by End-User 2025 & 2033
- Figure 95: South Korea APAC Medical Imaging Devices Industry Revenue (billion), by Geography 2025 & 2033
- Figure 96: South Korea APAC Medical Imaging Devices Industry Volume (K Unit), by Geography 2025 & 2033
- Figure 97: South Korea APAC Medical Imaging Devices Industry Revenue Share (%), by Geography 2025 & 2033
- Figure 98: South Korea APAC Medical Imaging Devices Industry Volume Share (%), by Geography 2025 & 2033
- Figure 99: South Korea APAC Medical Imaging Devices Industry Revenue (billion), by Country 2025 & 2033
- Figure 100: South Korea APAC Medical Imaging Devices Industry Volume (K Unit), by Country 2025 & 2033
- Figure 101: South Korea APAC Medical Imaging Devices Industry Revenue Share (%), by Country 2025 & 2033
- Figure 102: South Korea APAC Medical Imaging Devices Industry Volume Share (%), by Country 2025 & 2033
- Figure 103: Rest of Asia Pacific APAC Medical Imaging Devices Industry Revenue (billion), by Modality 2025 & 2033
- Figure 104: Rest of Asia Pacific APAC Medical Imaging Devices Industry Volume (K Unit), by Modality 2025 & 2033
- Figure 105: Rest of Asia Pacific APAC Medical Imaging Devices Industry Revenue Share (%), by Modality 2025 & 2033
- Figure 106: Rest of Asia Pacific APAC Medical Imaging Devices Industry Volume Share (%), by Modality 2025 & 2033
- Figure 107: Rest of Asia Pacific APAC Medical Imaging Devices Industry Revenue (billion), by Application 2025 & 2033
- Figure 108: Rest of Asia Pacific APAC Medical Imaging Devices Industry Volume (K Unit), by Application 2025 & 2033
- Figure 109: Rest of Asia Pacific APAC Medical Imaging Devices Industry Revenue Share (%), by Application 2025 & 2033
- Figure 110: Rest of Asia Pacific APAC Medical Imaging Devices Industry Volume Share (%), by Application 2025 & 2033
- Figure 111: Rest of Asia Pacific APAC Medical Imaging Devices Industry Revenue (billion), by End-User 2025 & 2033
- Figure 112: Rest of Asia Pacific APAC Medical Imaging Devices Industry Volume (K Unit), by End-User 2025 & 2033
- Figure 113: Rest of Asia Pacific APAC Medical Imaging Devices Industry Revenue Share (%), by End-User 2025 & 2033
- Figure 114: Rest of Asia Pacific APAC Medical Imaging Devices Industry Volume Share (%), by End-User 2025 & 2033
- Figure 115: Rest of Asia Pacific APAC Medical Imaging Devices Industry Revenue (billion), by Geography 2025 & 2033
- Figure 116: Rest of Asia Pacific APAC Medical Imaging Devices Industry Volume (K Unit), by Geography 2025 & 2033
- Figure 117: Rest of Asia Pacific APAC Medical Imaging Devices Industry Revenue Share (%), by Geography 2025 & 2033
- Figure 118: Rest of Asia Pacific APAC Medical Imaging Devices Industry Volume Share (%), by Geography 2025 & 2033
- Figure 119: Rest of Asia Pacific APAC Medical Imaging Devices Industry Revenue (billion), by Country 2025 & 2033
- Figure 120: Rest of Asia Pacific APAC Medical Imaging Devices Industry Volume (K Unit), by Country 2025 & 2033
- Figure 121: Rest of Asia Pacific APAC Medical Imaging Devices Industry Revenue Share (%), by Country 2025 & 2033
- Figure 122: Rest of Asia Pacific APAC Medical Imaging Devices Industry Volume Share (%), by Country 2025 & 2033
List of Tables
- Table 1: Global APAC Medical Imaging Devices Industry Revenue billion Forecast, by Modality 2020 & 2033
- Table 2: Global APAC Medical Imaging Devices Industry Volume K Unit Forecast, by Modality 2020 & 2033
- Table 3: Global APAC Medical Imaging Devices Industry Revenue billion Forecast, by Application 2020 & 2033
- Table 4: Global APAC Medical Imaging Devices Industry Volume K Unit Forecast, by Application 2020 & 2033
- Table 5: Global APAC Medical Imaging Devices Industry Revenue billion Forecast, by End-User 2020 & 2033
- Table 6: Global APAC Medical Imaging Devices Industry Volume K Unit Forecast, by End-User 2020 & 2033
- Table 7: Global APAC Medical Imaging Devices Industry Revenue billion Forecast, by Geography 2020 & 2033
- Table 8: Global APAC Medical Imaging Devices Industry Volume K Unit Forecast, by Geography 2020 & 2033
- Table 9: Global APAC Medical Imaging Devices Industry Revenue billion Forecast, by Region 2020 & 2033
- Table 10: Global APAC Medical Imaging Devices Industry Volume K Unit Forecast, by Region 2020 & 2033
- Table 11: Global APAC Medical Imaging Devices Industry Revenue billion Forecast, by Modality 2020 & 2033
- Table 12: Global APAC Medical Imaging Devices Industry Volume K Unit Forecast, by Modality 2020 & 2033
- Table 13: Global APAC Medical Imaging Devices Industry Revenue billion Forecast, by Application 2020 & 2033
- Table 14: Global APAC Medical Imaging Devices Industry Volume K Unit Forecast, by Application 2020 & 2033
- Table 15: Global APAC Medical Imaging Devices Industry Revenue billion Forecast, by End-User 2020 & 2033
- Table 16: Global APAC Medical Imaging Devices Industry Volume K Unit Forecast, by End-User 2020 & 2033
- Table 17: Global APAC Medical Imaging Devices Industry Revenue billion Forecast, by Geography 2020 & 2033
- Table 18: Global APAC Medical Imaging Devices Industry Volume K Unit Forecast, by Geography 2020 & 2033
- Table 19: Global APAC Medical Imaging Devices Industry Revenue billion Forecast, by Country 2020 & 2033
- Table 20: Global APAC Medical Imaging Devices Industry Volume K Unit Forecast, by Country 2020 & 2033
- Table 21: Global APAC Medical Imaging Devices Industry Revenue billion Forecast, by Modality 2020 & 2033
- Table 22: Global APAC Medical Imaging Devices Industry Volume K Unit Forecast, by Modality 2020 & 2033
- Table 23: Global APAC Medical Imaging Devices Industry Revenue billion Forecast, by Application 2020 & 2033
- Table 24: Global APAC Medical Imaging Devices Industry Volume K Unit Forecast, by Application 2020 & 2033
- Table 25: Global APAC Medical Imaging Devices Industry Revenue billion Forecast, by End-User 2020 & 2033
- Table 26: Global APAC Medical Imaging Devices Industry Volume K Unit Forecast, by End-User 2020 & 2033
- Table 27: Global APAC Medical Imaging Devices Industry Revenue billion Forecast, by Geography 2020 & 2033
- Table 28: Global APAC Medical Imaging Devices Industry Volume K Unit Forecast, by Geography 2020 & 2033
- Table 29: Global APAC Medical Imaging Devices Industry Revenue billion Forecast, by Country 2020 & 2033
- Table 30: Global APAC Medical Imaging Devices Industry Volume K Unit Forecast, by Country 2020 & 2033
- Table 31: Global APAC Medical Imaging Devices Industry Revenue billion Forecast, by Modality 2020 & 2033
- Table 32: Global APAC Medical Imaging Devices Industry Volume K Unit Forecast, by Modality 2020 & 2033
- Table 33: Global APAC Medical Imaging Devices Industry Revenue billion Forecast, by Application 2020 & 2033
- Table 34: Global APAC Medical Imaging Devices Industry Volume K Unit Forecast, by Application 2020 & 2033
- Table 35: Global APAC Medical Imaging Devices Industry Revenue billion Forecast, by End-User 2020 & 2033
- Table 36: Global APAC Medical Imaging Devices Industry Volume K Unit Forecast, by End-User 2020 & 2033
- Table 37: Global APAC Medical Imaging Devices Industry Revenue billion Forecast, by Geography 2020 & 2033
- Table 38: Global APAC Medical Imaging Devices Industry Volume K Unit Forecast, by Geography 2020 & 2033
- Table 39: Global APAC Medical Imaging Devices Industry Revenue billion Forecast, by Country 2020 & 2033
- Table 40: Global APAC Medical Imaging Devices Industry Volume K Unit Forecast, by Country 2020 & 2033
- Table 41: Global APAC Medical Imaging Devices Industry Revenue billion Forecast, by Modality 2020 & 2033
- Table 42: Global APAC Medical Imaging Devices Industry Volume K Unit Forecast, by Modality 2020 & 2033
- Table 43: Global APAC Medical Imaging Devices Industry Revenue billion Forecast, by Application 2020 & 2033
- Table 44: Global APAC Medical Imaging Devices Industry Volume K Unit Forecast, by Application 2020 & 2033
- Table 45: Global APAC Medical Imaging Devices Industry Revenue billion Forecast, by End-User 2020 & 2033
- Table 46: Global APAC Medical Imaging Devices Industry Volume K Unit Forecast, by End-User 2020 & 2033
- Table 47: Global APAC Medical Imaging Devices Industry Revenue billion Forecast, by Geography 2020 & 2033
- Table 48: Global APAC Medical Imaging Devices Industry Volume K Unit Forecast, by Geography 2020 & 2033
- Table 49: Global APAC Medical Imaging Devices Industry Revenue billion Forecast, by Country 2020 & 2033
- Table 50: Global APAC Medical Imaging Devices Industry Volume K Unit Forecast, by Country 2020 & 2033
- Table 51: Global APAC Medical Imaging Devices Industry Revenue billion Forecast, by Modality 2020 & 2033
- Table 52: Global APAC Medical Imaging Devices Industry Volume K Unit Forecast, by Modality 2020 & 2033
- Table 53: Global APAC Medical Imaging Devices Industry Revenue billion Forecast, by Application 2020 & 2033
- Table 54: Global APAC Medical Imaging Devices Industry Volume K Unit Forecast, by Application 2020 & 2033
- Table 55: Global APAC Medical Imaging Devices Industry Revenue billion Forecast, by End-User 2020 & 2033
- Table 56: Global APAC Medical Imaging Devices Industry Volume K Unit Forecast, by End-User 2020 & 2033
- Table 57: Global APAC Medical Imaging Devices Industry Revenue billion Forecast, by Geography 2020 & 2033
- Table 58: Global APAC Medical Imaging Devices Industry Volume K Unit Forecast, by Geography 2020 & 2033
- Table 59: Global APAC Medical Imaging Devices Industry Revenue billion Forecast, by Country 2020 & 2033
- Table 60: Global APAC Medical Imaging Devices Industry Volume K Unit Forecast, by Country 2020 & 2033
- Table 61: Global APAC Medical Imaging Devices Industry Revenue billion Forecast, by Modality 2020 & 2033
- Table 62: Global APAC Medical Imaging Devices Industry Volume K Unit Forecast, by Modality 2020 & 2033
- Table 63: Global APAC Medical Imaging Devices Industry Revenue billion Forecast, by Application 2020 & 2033
- Table 64: Global APAC Medical Imaging Devices Industry Volume K Unit Forecast, by Application 2020 & 2033
- Table 65: Global APAC Medical Imaging Devices Industry Revenue billion Forecast, by End-User 2020 & 2033
- Table 66: Global APAC Medical Imaging Devices Industry Volume K Unit Forecast, by End-User 2020 & 2033
- Table 67: Global APAC Medical Imaging Devices Industry Revenue billion Forecast, by Geography 2020 & 2033
- Table 68: Global APAC Medical Imaging Devices Industry Volume K Unit Forecast, by Geography 2020 & 2033
- Table 69: Global APAC Medical Imaging Devices Industry Revenue billion Forecast, by Country 2020 & 2033
- Table 70: Global APAC Medical Imaging Devices Industry Volume K Unit Forecast, by Country 2020 & 2033
Frequently Asked Questions
1. What is the projected Compound Annual Growth Rate (CAGR) of the APAC Medical Imaging Devices Industry?
The projected CAGR is approximately 8%.
2. Which companies are prominent players in the APAC Medical Imaging Devices Industry?
Key companies in the market include Esaote SpA, Hologic Inc, GE Healthcare, Shanghai United Imaging Healthcare Co Ltd, Koninklijke Philips N V, Siemens AG, FUJIFILM Holdings Corporation, Carestream Health, J Morita Corporation, Canon Medical Systems Corporation, Teknova Medical Systems Limited, Shimadzu Corporation.
3. What are the main segments of the APAC Medical Imaging Devices Industry?
The market segments include Modality, Application, End-User, Geography.
4. Can you provide details about the market size?
The market size is estimated to be USD 143.12 billion as of 2022.
5. What are some drivers contributing to market growth?
Rising Prevalence of Chronic Diseases; Technological Advancement in Imaging Modalities; Growing Emphasis on Early Diagnosis.
6. What are the notable trends driving market growth?
Oncology Segment is Expected to Witness a Healthy Growth in Coming Years.
7. Are there any restraints impacting market growth?
Lack of Skilled Radiologist; High Cost of Advanced Diagnostic Imaging Devices.
8. Can you provide examples of recent developments in the market?
October 2022: Luxonus Inc. received approval to market its photoacoustic 3D imaging system in Japan.
9. What pricing options are available for accessing the report?
Pricing options include single-user, multi-user, and enterprise licenses priced at USD 4750, USD 5250, and USD 8750 respectively.
10. Is the market size provided in terms of value or volume?
The market size is provided in terms of value, measured in billion and volume, measured in K Unit.
11. Are there any specific market keywords associated with the report?
Yes, the market keyword associated with the report is "APAC Medical Imaging Devices Industry," which aids in identifying and referencing the specific market segment covered.
12. How do I determine which pricing option suits my needs best?
The pricing options vary based on user requirements and access needs. Individual users may opt for single-user licenses, while businesses requiring broader access may choose multi-user or enterprise licenses for cost-effective access to the report.
13. Are there any additional resources or data provided in the APAC Medical Imaging Devices Industry report?
While the report offers comprehensive insights, it's advisable to review the specific contents or supplementary materials provided to ascertain if additional resources or data are available.
14. How can I stay updated on further developments or reports in the APAC Medical Imaging Devices Industry?
To stay informed about further developments, trends, and reports in the APAC Medical Imaging Devices Industry, consider subscribing to industry newsletters, following relevant companies and organizations, or regularly checking reputable industry news sources and publications.
Methodology
Step 1 - Identification of Relevant Samples Size from Population Database


Step 2 - Approaches for Defining Global Market Size (Value, Volume* & Price*)

Note*: In applicable scenarios
Step 3 - Data Sources
Primary Research
- Web Analytics
- Survey Reports
- Research Institute
- Latest Research Reports
- Opinion Leaders
Secondary Research
- Annual Reports
- White Paper
- Latest Press Release
- Industry Association
- Paid Database
- Investor Presentations

Step 4 - Data Triangulation
Involves using different sources of information in order to increase the validity of a study
These sources are likely to be stakeholders in a program - participants, other researchers, program staff, other community members, and so on.
Then we put all data in single framework & apply various statistical tools to find out the dynamic on the market.
During the analysis stage, feedback from the stakeholder groups would be compared to determine areas of agreement as well as areas of divergence