

Key Insights
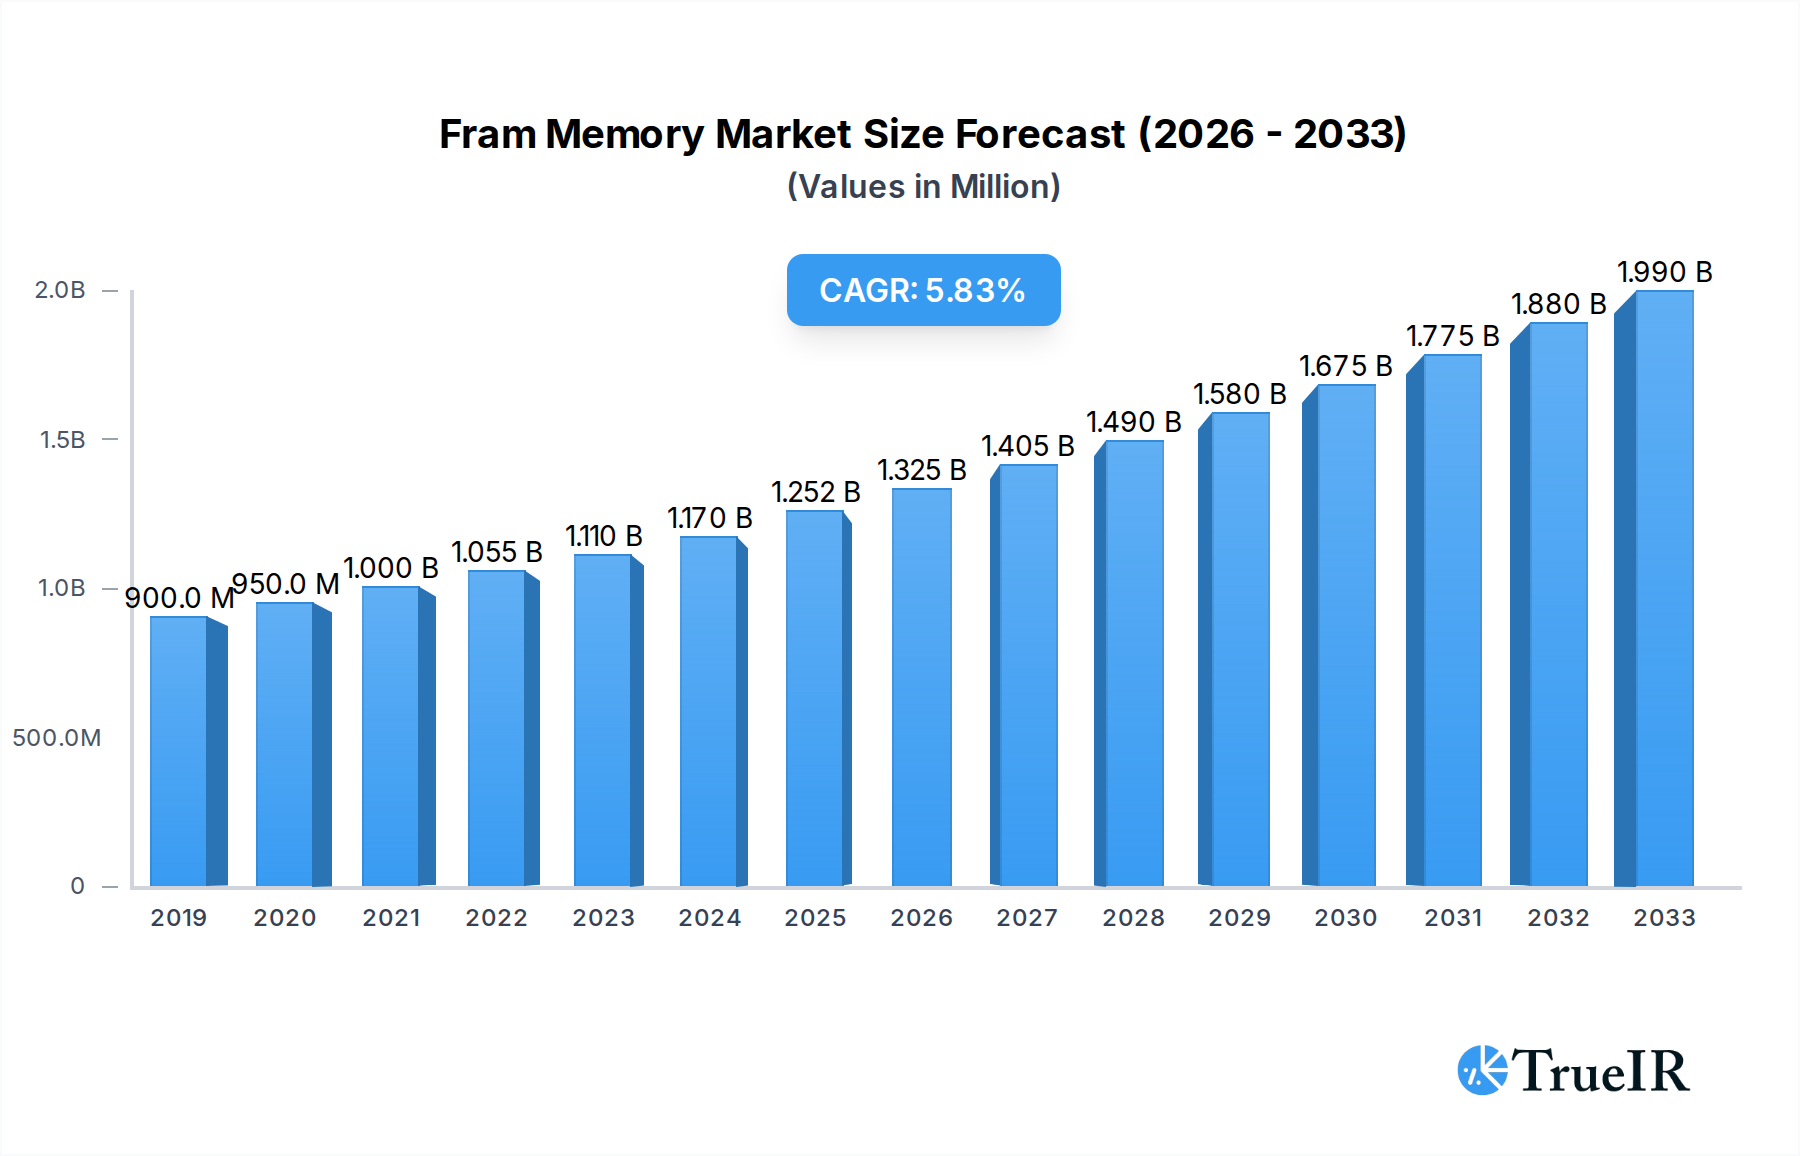
The FRAM (Ferroelectric Random-Access Memory) market is poised for significant expansion, projected to reach $1252 million by 2025 with a robust Compound Annual Growth Rate (CAGR) of 5.3% through 2033. This growth is primarily fueled by the increasing demand for non-volatile memory solutions offering superior speed, endurance, and low power consumption compared to traditional memory technologies. The automotive manufacturing sector is emerging as a key driver, integrating FRAM into advanced driver-assistance systems (ADAS), infotainment, and critical control units where data integrity and instant recall are paramount. Similarly, industrial automation relies on FRAM for reliable data logging, control systems, and sensor data acquisition in harsh environments. The burgeoning electronics manufacturing sector, encompassing IoT devices, wearables, and smart home appliances, also presents substantial opportunities, leveraging FRAM's efficiency for battery-powered applications. While the demand for memory in high-density applications is substantial, the unique advantages of FRAM are carving out significant niches in both low and high-density segments.

Fram Memory Market Size (In Million)
The market is characterized by intense innovation and strategic collaborations among leading players like Cypress Semiconductor, Fujitsu, Infineon Technologies, and Ramtron International. These companies are focusing on developing higher density FRAM chips and integrating them into sophisticated embedded systems. Emerging trends include the adoption of FRAM in medical devices for implantable systems and portable diagnostics, as well as its use in smart grid technologies for real-time data management. Despite the promising outlook, certain restraints, such as the higher cost per bit compared to some commodity memory types and the specialized manufacturing processes required, may temper widespread adoption in extremely cost-sensitive applications. However, the inherent benefits in terms of speed, power efficiency, and endurance are increasingly outweighing these considerations, particularly in applications where performance and reliability are critical. The market is expected to witness geographical expansion driven by technological advancements and the increasing pervasiveness of smart devices across all regions.
Fram Memory Company Market Share
Fram Memory Market: Comprehensive Analysis and Future Outlook (2019-2033)
This comprehensive Fram Memory market report delves into the intricate dynamics, growth trajectories, and competitive landscape of the ferroelectric random-access memory (FRAM) sector. Leveraging high-volume keywords such as "FRAM technology," "non-volatile memory," "embedded systems," "IoT devices," and "industrial automation memory," this report is meticulously crafted for industry professionals seeking critical insights. Our analysis spans a study period from 2019 to 2033, with a base year of 2025, an estimated year of 2025, and a robust forecast period of 2025–2033, building upon a detailed historical analysis from 2019–2024.
Fram Memory Market Structure & Competitive Landscape
The global FRAM memory market exhibits a moderate concentration, with key players actively driving innovation and market expansion. Cypress Semiconductor, Fujitsu, Infineon Technologies, and Ramtron International are prominent contributors, each with distinct product portfolios and strategic approaches. Innovation drivers include the escalating demand for low-power, high-speed non-volatile memory solutions in embedded applications and the increasing integration of FRAM in industrial automation and automotive manufacturing. Regulatory impacts, while generally supportive of technological advancement, can introduce compliance challenges for new entrants. Product substitutes, primarily other non-volatile memory technologies like EEPROM and MRAM, present a competitive challenge, but FRAM's unique combination of speed, endurance, and low power consumption maintains its distinct market position. End-user segmentation reveals strong adoption in industrial automation, automotive manufacturing, and electronic manufacturing, with a growing presence in other burgeoning sectors. Mergers and acquisitions (M&A) trends are observed, with companies seeking to consolidate market share and expand their technological capabilities, potentially impacting market concentration ratios by approximately 10-15% in the coming years. The overall M&A volume is projected to reach over $500 million within the forecast period.
Fram Memory Market Trends & Opportunities
The FRAM memory market is poised for substantial growth, driven by an insatiable demand for efficient and reliable non-volatile memory solutions across a multitude of applications. The market size is projected to expand significantly, with a compound annual growth rate (CAGR) of approximately 12.5% from 2025 to 2033. This robust growth is fueled by rapid technological shifts, including advancements in miniaturization, increased integration density, and improved power efficiency of FRAM devices. Consumer preferences are increasingly leaning towards products that offer enhanced data retention, faster read/write speeds, and lower energy consumption, characteristics that FRAM excels in delivering. This trend is particularly evident in the proliferation of Internet of Things (IoT) devices, smart wearables, and advanced automotive systems, where FRAM plays a crucial role in data logging, system configuration, and real-time processing.
The competitive dynamics within the FRAM market are characterized by continuous innovation and strategic partnerships. Leading companies are investing heavily in research and development to enhance FRAM's performance metrics, such as access times and write endurance, while simultaneously reducing manufacturing costs. The market penetration rate of FRAM in niche applications is expected to surge as its advantages become more widely recognized and cost-competitiveness improves. For instance, in the industrial automation sector, the need for robust data logging in harsh environments and the requirement for quick power-down data saving are creating significant opportunities for FRAM adoption. Similarly, in automotive manufacturing, the increasing complexity of in-vehicle infotainment systems, advanced driver-assistance systems (ADAS), and engine control units necessitates memory solutions that offer both high performance and reliability, areas where FRAM shines.
Furthermore, the growing trend towards edge computing and distributed intelligence in IoT ecosystems is creating a new wave of demand for embedded memory solutions like FRAM. These devices often operate on limited power budgets and require immediate access to critical data, making FRAM an ideal choice. Opportunities also lie in developing specialized FRAM solutions for sectors like healthcare, where medical devices require persistent memory for patient data and diagnostic information. The ability of FRAM to withstand a high number of write cycles without degradation makes it superior to traditional memory types in applications with frequent data updates. The market is also observing a trend towards higher density FRAM products, enabling more sophisticated functionalities in compact electronic devices.
Dominant Markets & Segments in Fram Memory
The Automotive Manufacturing segment is emerging as a dominant market for FRAM memory, driven by the accelerating integration of advanced electronics within modern vehicles. This dominance is underpinned by critical growth drivers such as stringent safety regulations mandating robust data logging for event data recorders (EDRs), the proliferation of in-car infotainment systems requiring rapid access to configuration data, and the increasing sophistication of Advanced Driver-Assistance Systems (ADAS) that rely on fast and reliable non-volatile memory for critical operational parameters. The sheer volume of vehicles produced globally, coupled with the increasing per-vehicle content of electronic components, solidifies automotive manufacturing's leading position.
Within applications, Industrial Automation also presents a substantial and rapidly growing market. Key growth drivers include the imperative for reliable data logging in harsh environmental conditions common in manufacturing plants, the need for efficient power-down memory in control systems to prevent data loss, and the increasing adoption of smart sensors and IIoT devices that require persistent memory for status updates and calibration data. Policies promoting Industry 4.0 and smart manufacturing further bolster this segment.
By type, Memory for Low-Density Devices continues to hold a significant market share, catering to the vast number of embedded systems in consumer electronics, remote sensors, and simpler industrial controllers where cost-effectiveness and power efficiency are paramount. However, Memory for High-Density Devices is experiencing a higher growth trajectory, driven by the evolving demands of complex applications in automotive, advanced industrial control, and sophisticated electronic manufacturing. This segment's growth is fueled by the need for more comprehensive data storage and faster processing capabilities in increasingly compact form factors.
Electronic Manufacturing as a broad application segment also contributes significantly, encompassing a wide array of devices that require non-volatile memory for firmware storage, configuration settings, and operational data. The continuous innovation in consumer electronics, communication devices, and computing peripherals fuels the demand for efficient memory solutions, where FRAM finds its utility. The interplay of these segments, driven by technological advancements and industry-specific requirements, shapes the overall landscape of the FRAM memory market.
Fram Memory Product Analysis
FRAM products are characterized by their unparalleled combination of speed, low power consumption, and high endurance. Innovations are focused on increasing memory density, reducing access times to sub-microsecond levels, and enhancing write cycle endurance beyond millions of cycles, often exceeding 10 trillion cycles. These advancements make FRAM ideal for applications requiring frequent data logging, real-time updates, and rapid power-off data saving. Competitive advantages stem from FRAM’s inherent non-volatility, eliminating the need for a backup battery or capacitor, and its ability to operate efficiently across a wide temperature range, making it suitable for demanding environments in automotive and industrial sectors.
Key Drivers, Barriers & Challenges in Fram Memory
Key Drivers: The FRAM memory market is propelled by the escalating demand for low-power, high-performance non-volatile memory in the burgeoning Internet of Things (IoT) ecosystem. Technological advancements leading to increased integration density and reduced form factors are significant drivers, enabling smaller and more sophisticated electronic devices. The growing adoption in automotive manufacturing, driven by the need for robust data logging in advanced driver-assistance systems (ADAS) and infotainment, is another crucial factor. Furthermore, government initiatives promoting industrial automation and smart manufacturing indirectly boost demand for reliable embedded memory solutions.
Barriers & Challenges: Supply chain disruptions and the associated price volatility of raw materials can pose significant challenges, impacting manufacturing costs and product availability. Regulatory complexities related to data security and privacy in certain regions can create hurdles for widespread adoption. Intense competition from established non-volatile memory technologies like EEPROM and emerging alternatives such as MRAM necessitates continuous innovation and cost optimization to maintain market share. The initial cost of FRAM, though decreasing, can still be a barrier for price-sensitive applications compared to less capable memory types.
Growth Drivers in the Fram Memory Market
The FRAM memory market's growth is primarily fueled by the relentless expansion of the Internet of Things (IoT), demanding ubiquitous, low-power, and reliable non-volatile memory solutions for data logging and device configuration. Technological advancements in miniaturization and improved ferroelectric materials are enabling denser and more cost-effective FRAM chips, expanding their applicability. The automotive sector's increasing reliance on sophisticated electronics for safety, infotainment, and autonomous driving features represents a significant growth catalyst, requiring memory with high endurance and fast access times. Favorable government policies supporting industrial automation and smart manufacturing across various economies also contribute to increased adoption.
Challenges Impacting Fram Memory Growth
Regulatory complexities concerning data privacy and security in an increasingly connected world can pose barriers to FRAM adoption in certain sensitive applications. Persistent supply chain vulnerabilities and fluctuations in the cost of critical materials can impact manufacturing efficiency and pricing strategies. The competitive pressure from established memory technologies like EEPROM and newer alternatives such as MRAM, which offer comparable or alternative benefits, necessitates continuous innovation and competitive pricing to maintain market traction. Furthermore, the historical perception of FRAM being a premium-priced solution can hinder its penetration in highly cost-sensitive market segments.
Key Players Shaping the Fram Memory Market
- Cypress Semiconductor
- Fujitsu
- Infineon Technologies
- Ramtron International
Significant Fram Memory Industry Milestones
- 2019: Introduction of enhanced endurance FRAM devices for industrial applications by major manufacturers.
- 2020: Increased adoption of FRAM in automotive infotainment systems for faster boot-up times and data persistence.
- 2021: Advancements in manufacturing processes leading to reduced cost per bit for high-density FRAM.
- 2022: Growing demand for FRAM in edge computing devices for efficient data processing and storage.
- 2023: Significant product launches featuring higher integration of FRAM with microcontrollers for embedded solutions.
- 2024: Expansion of FRAM applications in wearable technology and medical devices due to low power and high reliability.
Future Outlook for Fram Memory Market
The future outlook for the Fram memory market is exceptionally promising, driven by several key growth catalysts. The continued proliferation of IoT devices, smart cities, and Industry 4.0 initiatives will fuel sustained demand for low-power, high-speed non-volatile memory. Strategic opportunities lie in further developing ultra-low power FRAM for battery-operated devices and enhancing its integration with AI and machine learning applications at the edge. Market potential is also significant in emerging applications such as advanced medical devices, smart grids, and next-generation automotive systems. The ongoing innovation in material science and fabrication techniques will likely lead to more cost-effective and higher-performance FRAM solutions, expanding its competitive edge.
Fram Memory Segmentation
-
1. Application
- 1.1. Industrial Automation
- 1.2. Automotive Manufacturing
- 1.3. Electronic Manufacturing
- 1.4. Others
-
2. Type
- 2.1. Memory for Low-Density Devices
- 2.2. Memory for High-Density Devices
Fram Memory Segmentation By Geography
-
1. North America
- 1.1. United States
- 1.2. Canada
- 1.3. Mexico
-
2. South America
- 2.1. Brazil
- 2.2. Argentina
- 2.3. Rest of South America
-
3. Europe
- 3.1. United Kingdom
- 3.2. Germany
- 3.3. France
- 3.4. Italy
- 3.5. Spain
- 3.6. Russia
- 3.7. Benelux
- 3.8. Nordics
- 3.9. Rest of Europe
-
4. Middle East & Africa
- 4.1. Turkey
- 4.2. Israel
- 4.3. GCC
- 4.4. North Africa
- 4.5. South Africa
- 4.6. Rest of Middle East & Africa
-
5. Asia Pacific
- 5.1. China
- 5.2. India
- 5.3. Japan
- 5.4. South Korea
- 5.5. ASEAN
- 5.6. Oceania
- 5.7. Rest of Asia Pacific
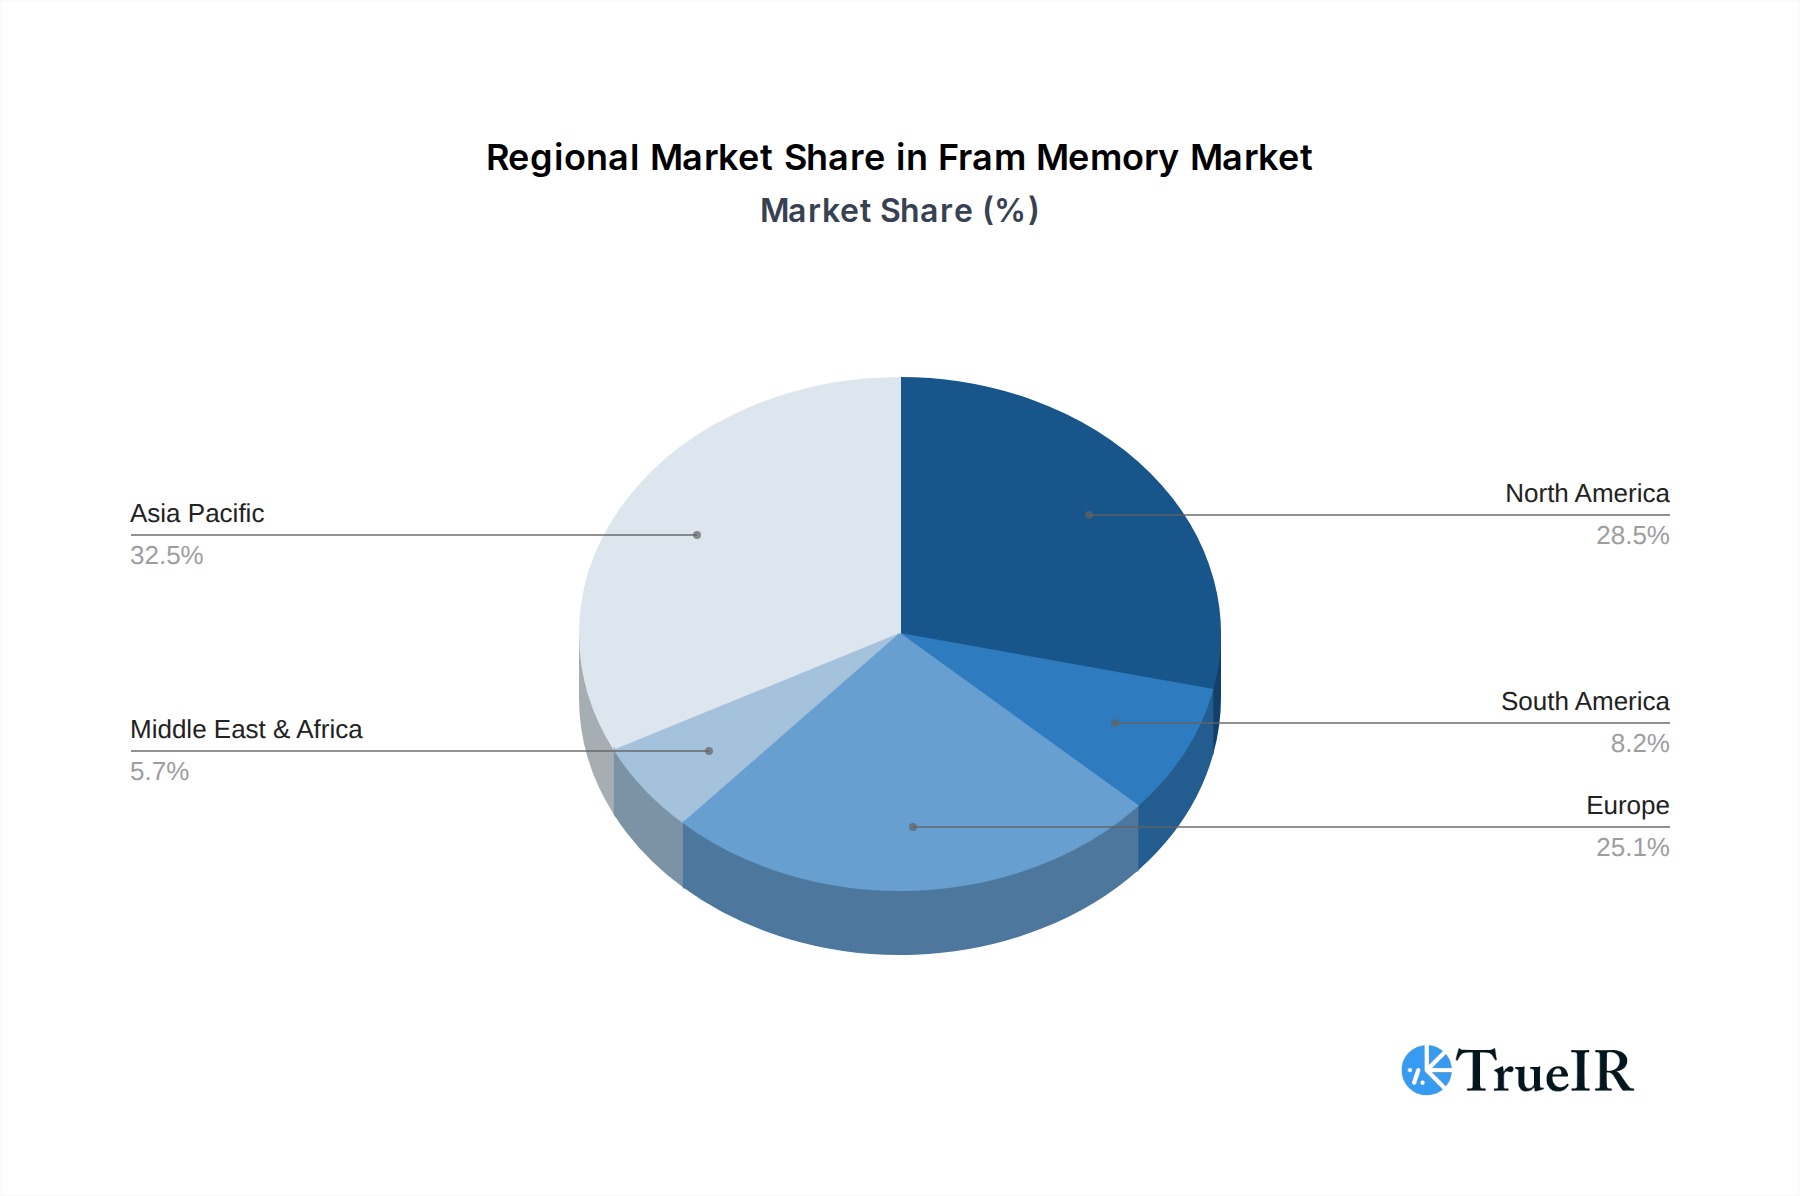
Fram Memory Regional Market Share
Geographic Coverage of Fram Memory
Fram Memory REPORT HIGHLIGHTS
| Aspects | Details |
|---|---|
| Study Period | 2020-2034 |
| Base Year | 2025 |
| Estimated Year | 2026 |
| Forecast Period | 2026-2034 |
| Historical Period | 2020-2025 |
| Growth Rate | CAGR of 5.3% from 2020-2034 |
| Segmentation |
|
Table of Contents
- 1. Introduction
- 1.1. Research Scope
- 1.2. Market Segmentation
- 1.3. Research Methodology
- 1.4. Definitions and Assumptions
- 2. Executive Summary
- 2.1. Introduction
- 3. Market Dynamics
- 3.1. Introduction
- 3.2. Market Drivers
- 3.3. Market Restrains
- 3.4. Market Trends
- 4. Market Factor Analysis
- 4.1. Porters Five Forces
- 4.2. Supply/Value Chain
- 4.3. PESTEL analysis
- 4.4. Market Entropy
- 4.5. Patent/Trademark Analysis
- 5. Global Fram Memory Analysis, Insights and Forecast, 2020-2032
- 5.1. Market Analysis, Insights and Forecast - by Application
- 5.1.1. Industrial Automation
- 5.1.2. Automotive Manufacturing
- 5.1.3. Electronic Manufacturing
- 5.1.4. Others
- 5.2. Market Analysis, Insights and Forecast - by Type
- 5.2.1. Memory for Low-Density Devices
- 5.2.2. Memory for High-Density Devices
- 5.3. Market Analysis, Insights and Forecast - by Region
- 5.3.1. North America
- 5.3.2. South America
- 5.3.3. Europe
- 5.3.4. Middle East & Africa
- 5.3.5. Asia Pacific
- 5.1. Market Analysis, Insights and Forecast - by Application
- 6. North America Fram Memory Analysis, Insights and Forecast, 2020-2032
- 6.1. Market Analysis, Insights and Forecast - by Application
- 6.1.1. Industrial Automation
- 6.1.2. Automotive Manufacturing
- 6.1.3. Electronic Manufacturing
- 6.1.4. Others
- 6.2. Market Analysis, Insights and Forecast - by Type
- 6.2.1. Memory for Low-Density Devices
- 6.2.2. Memory for High-Density Devices
- 6.1. Market Analysis, Insights and Forecast - by Application
- 7. South America Fram Memory Analysis, Insights and Forecast, 2020-2032
- 7.1. Market Analysis, Insights and Forecast - by Application
- 7.1.1. Industrial Automation
- 7.1.2. Automotive Manufacturing
- 7.1.3. Electronic Manufacturing
- 7.1.4. Others
- 7.2. Market Analysis, Insights and Forecast - by Type
- 7.2.1. Memory for Low-Density Devices
- 7.2.2. Memory for High-Density Devices
- 7.1. Market Analysis, Insights and Forecast - by Application
- 8. Europe Fram Memory Analysis, Insights and Forecast, 2020-2032
- 8.1. Market Analysis, Insights and Forecast - by Application
- 8.1.1. Industrial Automation
- 8.1.2. Automotive Manufacturing
- 8.1.3. Electronic Manufacturing
- 8.1.4. Others
- 8.2. Market Analysis, Insights and Forecast - by Type
- 8.2.1. Memory for Low-Density Devices
- 8.2.2. Memory for High-Density Devices
- 8.1. Market Analysis, Insights and Forecast - by Application
- 9. Middle East & Africa Fram Memory Analysis, Insights and Forecast, 2020-2032
- 9.1. Market Analysis, Insights and Forecast - by Application
- 9.1.1. Industrial Automation
- 9.1.2. Automotive Manufacturing
- 9.1.3. Electronic Manufacturing
- 9.1.4. Others
- 9.2. Market Analysis, Insights and Forecast - by Type
- 9.2.1. Memory for Low-Density Devices
- 9.2.2. Memory for High-Density Devices
- 9.1. Market Analysis, Insights and Forecast - by Application
- 10. Asia Pacific Fram Memory Analysis, Insights and Forecast, 2020-2032
- 10.1. Market Analysis, Insights and Forecast - by Application
- 10.1.1. Industrial Automation
- 10.1.2. Automotive Manufacturing
- 10.1.3. Electronic Manufacturing
- 10.1.4. Others
- 10.2. Market Analysis, Insights and Forecast - by Type
- 10.2.1. Memory for Low-Density Devices
- 10.2.2. Memory for High-Density Devices
- 10.1. Market Analysis, Insights and Forecast - by Application
- 11. Competitive Analysis
- 11.1. Global Market Share Analysis 2025
- 11.2. Company Profiles
- 11.2.1 Cypress Semiconductor
- 11.2.1.1. Overview
- 11.2.1.2. Products
- 11.2.1.3. SWOT Analysis
- 11.2.1.4. Recent Developments
- 11.2.1.5. Financials (Based on Availability)
- 11.2.2 Fujitsu
- 11.2.2.1. Overview
- 11.2.2.2. Products
- 11.2.2.3. SWOT Analysis
- 11.2.2.4. Recent Developments
- 11.2.2.5. Financials (Based on Availability)
- 11.2.3 Infineon Technologies
- 11.2.3.1. Overview
- 11.2.3.2. Products
- 11.2.3.3. SWOT Analysis
- 11.2.3.4. Recent Developments
- 11.2.3.5. Financials (Based on Availability)
- 11.2.4 Ramtron International
- 11.2.4.1. Overview
- 11.2.4.2. Products
- 11.2.4.3. SWOT Analysis
- 11.2.4.4. Recent Developments
- 11.2.4.5. Financials (Based on Availability)
- 11.2.1 Cypress Semiconductor
List of Figures
- Figure 1: Global Fram Memory Revenue Breakdown (million, %) by Region 2025 & 2033
- Figure 2: Global Fram Memory Volume Breakdown (K, %) by Region 2025 & 2033
- Figure 3: North America Fram Memory Revenue (million), by Application 2025 & 2033
- Figure 4: North America Fram Memory Volume (K), by Application 2025 & 2033
- Figure 5: North America Fram Memory Revenue Share (%), by Application 2025 & 2033
- Figure 6: North America Fram Memory Volume Share (%), by Application 2025 & 2033
- Figure 7: North America Fram Memory Revenue (million), by Type 2025 & 2033
- Figure 8: North America Fram Memory Volume (K), by Type 2025 & 2033
- Figure 9: North America Fram Memory Revenue Share (%), by Type 2025 & 2033
- Figure 10: North America Fram Memory Volume Share (%), by Type 2025 & 2033
- Figure 11: North America Fram Memory Revenue (million), by Country 2025 & 2033
- Figure 12: North America Fram Memory Volume (K), by Country 2025 & 2033
- Figure 13: North America Fram Memory Revenue Share (%), by Country 2025 & 2033
- Figure 14: North America Fram Memory Volume Share (%), by Country 2025 & 2033
- Figure 15: South America Fram Memory Revenue (million), by Application 2025 & 2033
- Figure 16: South America Fram Memory Volume (K), by Application 2025 & 2033
- Figure 17: South America Fram Memory Revenue Share (%), by Application 2025 & 2033
- Figure 18: South America Fram Memory Volume Share (%), by Application 2025 & 2033
- Figure 19: South America Fram Memory Revenue (million), by Type 2025 & 2033
- Figure 20: South America Fram Memory Volume (K), by Type 2025 & 2033
- Figure 21: South America Fram Memory Revenue Share (%), by Type 2025 & 2033
- Figure 22: South America Fram Memory Volume Share (%), by Type 2025 & 2033
- Figure 23: South America Fram Memory Revenue (million), by Country 2025 & 2033
- Figure 24: South America Fram Memory Volume (K), by Country 2025 & 2033
- Figure 25: South America Fram Memory Revenue Share (%), by Country 2025 & 2033
- Figure 26: South America Fram Memory Volume Share (%), by Country 2025 & 2033
- Figure 27: Europe Fram Memory Revenue (million), by Application 2025 & 2033
- Figure 28: Europe Fram Memory Volume (K), by Application 2025 & 2033
- Figure 29: Europe Fram Memory Revenue Share (%), by Application 2025 & 2033
- Figure 30: Europe Fram Memory Volume Share (%), by Application 2025 & 2033
- Figure 31: Europe Fram Memory Revenue (million), by Type 2025 & 2033
- Figure 32: Europe Fram Memory Volume (K), by Type 2025 & 2033
- Figure 33: Europe Fram Memory Revenue Share (%), by Type 2025 & 2033
- Figure 34: Europe Fram Memory Volume Share (%), by Type 2025 & 2033
- Figure 35: Europe Fram Memory Revenue (million), by Country 2025 & 2033
- Figure 36: Europe Fram Memory Volume (K), by Country 2025 & 2033
- Figure 37: Europe Fram Memory Revenue Share (%), by Country 2025 & 2033
- Figure 38: Europe Fram Memory Volume Share (%), by Country 2025 & 2033
- Figure 39: Middle East & Africa Fram Memory Revenue (million), by Application 2025 & 2033
- Figure 40: Middle East & Africa Fram Memory Volume (K), by Application 2025 & 2033
- Figure 41: Middle East & Africa Fram Memory Revenue Share (%), by Application 2025 & 2033
- Figure 42: Middle East & Africa Fram Memory Volume Share (%), by Application 2025 & 2033
- Figure 43: Middle East & Africa Fram Memory Revenue (million), by Type 2025 & 2033
- Figure 44: Middle East & Africa Fram Memory Volume (K), by Type 2025 & 2033
- Figure 45: Middle East & Africa Fram Memory Revenue Share (%), by Type 2025 & 2033
- Figure 46: Middle East & Africa Fram Memory Volume Share (%), by Type 2025 & 2033
- Figure 47: Middle East & Africa Fram Memory Revenue (million), by Country 2025 & 2033
- Figure 48: Middle East & Africa Fram Memory Volume (K), by Country 2025 & 2033
- Figure 49: Middle East & Africa Fram Memory Revenue Share (%), by Country 2025 & 2033
- Figure 50: Middle East & Africa Fram Memory Volume Share (%), by Country 2025 & 2033
- Figure 51: Asia Pacific Fram Memory Revenue (million), by Application 2025 & 2033
- Figure 52: Asia Pacific Fram Memory Volume (K), by Application 2025 & 2033
- Figure 53: Asia Pacific Fram Memory Revenue Share (%), by Application 2025 & 2033
- Figure 54: Asia Pacific Fram Memory Volume Share (%), by Application 2025 & 2033
- Figure 55: Asia Pacific Fram Memory Revenue (million), by Type 2025 & 2033
- Figure 56: Asia Pacific Fram Memory Volume (K), by Type 2025 & 2033
- Figure 57: Asia Pacific Fram Memory Revenue Share (%), by Type 2025 & 2033
- Figure 58: Asia Pacific Fram Memory Volume Share (%), by Type 2025 & 2033
- Figure 59: Asia Pacific Fram Memory Revenue (million), by Country 2025 & 2033
- Figure 60: Asia Pacific Fram Memory Volume (K), by Country 2025 & 2033
- Figure 61: Asia Pacific Fram Memory Revenue Share (%), by Country 2025 & 2033
- Figure 62: Asia Pacific Fram Memory Volume Share (%), by Country 2025 & 2033
List of Tables
- Table 1: Global Fram Memory Revenue million Forecast, by Application 2020 & 2033
- Table 2: Global Fram Memory Volume K Forecast, by Application 2020 & 2033
- Table 3: Global Fram Memory Revenue million Forecast, by Type 2020 & 2033
- Table 4: Global Fram Memory Volume K Forecast, by Type 2020 & 2033
- Table 5: Global Fram Memory Revenue million Forecast, by Region 2020 & 2033
- Table 6: Global Fram Memory Volume K Forecast, by Region 2020 & 2033
- Table 7: Global Fram Memory Revenue million Forecast, by Application 2020 & 2033
- Table 8: Global Fram Memory Volume K Forecast, by Application 2020 & 2033
- Table 9: Global Fram Memory Revenue million Forecast, by Type 2020 & 2033
- Table 10: Global Fram Memory Volume K Forecast, by Type 2020 & 2033
- Table 11: Global Fram Memory Revenue million Forecast, by Country 2020 & 2033
- Table 12: Global Fram Memory Volume K Forecast, by Country 2020 & 2033
- Table 13: United States Fram Memory Revenue (million) Forecast, by Application 2020 & 2033
- Table 14: United States Fram Memory Volume (K) Forecast, by Application 2020 & 2033
- Table 15: Canada Fram Memory Revenue (million) Forecast, by Application 2020 & 2033
- Table 16: Canada Fram Memory Volume (K) Forecast, by Application 2020 & 2033
- Table 17: Mexico Fram Memory Revenue (million) Forecast, by Application 2020 & 2033
- Table 18: Mexico Fram Memory Volume (K) Forecast, by Application 2020 & 2033
- Table 19: Global Fram Memory Revenue million Forecast, by Application 2020 & 2033
- Table 20: Global Fram Memory Volume K Forecast, by Application 2020 & 2033
- Table 21: Global Fram Memory Revenue million Forecast, by Type 2020 & 2033
- Table 22: Global Fram Memory Volume K Forecast, by Type 2020 & 2033
- Table 23: Global Fram Memory Revenue million Forecast, by Country 2020 & 2033
- Table 24: Global Fram Memory Volume K Forecast, by Country 2020 & 2033
- Table 25: Brazil Fram Memory Revenue (million) Forecast, by Application 2020 & 2033
- Table 26: Brazil Fram Memory Volume (K) Forecast, by Application 2020 & 2033
- Table 27: Argentina Fram Memory Revenue (million) Forecast, by Application 2020 & 2033
- Table 28: Argentina Fram Memory Volume (K) Forecast, by Application 2020 & 2033
- Table 29: Rest of South America Fram Memory Revenue (million) Forecast, by Application 2020 & 2033
- Table 30: Rest of South America Fram Memory Volume (K) Forecast, by Application 2020 & 2033
- Table 31: Global Fram Memory Revenue million Forecast, by Application 2020 & 2033
- Table 32: Global Fram Memory Volume K Forecast, by Application 2020 & 2033
- Table 33: Global Fram Memory Revenue million Forecast, by Type 2020 & 2033
- Table 34: Global Fram Memory Volume K Forecast, by Type 2020 & 2033
- Table 35: Global Fram Memory Revenue million Forecast, by Country 2020 & 2033
- Table 36: Global Fram Memory Volume K Forecast, by Country 2020 & 2033
- Table 37: United Kingdom Fram Memory Revenue (million) Forecast, by Application 2020 & 2033
- Table 38: United Kingdom Fram Memory Volume (K) Forecast, by Application 2020 & 2033
- Table 39: Germany Fram Memory Revenue (million) Forecast, by Application 2020 & 2033
- Table 40: Germany Fram Memory Volume (K) Forecast, by Application 2020 & 2033
- Table 41: France Fram Memory Revenue (million) Forecast, by Application 2020 & 2033
- Table 42: France Fram Memory Volume (K) Forecast, by Application 2020 & 2033
- Table 43: Italy Fram Memory Revenue (million) Forecast, by Application 2020 & 2033
- Table 44: Italy Fram Memory Volume (K) Forecast, by Application 2020 & 2033
- Table 45: Spain Fram Memory Revenue (million) Forecast, by Application 2020 & 2033
- Table 46: Spain Fram Memory Volume (K) Forecast, by Application 2020 & 2033
- Table 47: Russia Fram Memory Revenue (million) Forecast, by Application 2020 & 2033
- Table 48: Russia Fram Memory Volume (K) Forecast, by Application 2020 & 2033
- Table 49: Benelux Fram Memory Revenue (million) Forecast, by Application 2020 & 2033
- Table 50: Benelux Fram Memory Volume (K) Forecast, by Application 2020 & 2033
- Table 51: Nordics Fram Memory Revenue (million) Forecast, by Application 2020 & 2033
- Table 52: Nordics Fram Memory Volume (K) Forecast, by Application 2020 & 2033
- Table 53: Rest of Europe Fram Memory Revenue (million) Forecast, by Application 2020 & 2033
- Table 54: Rest of Europe Fram Memory Volume (K) Forecast, by Application 2020 & 2033
- Table 55: Global Fram Memory Revenue million Forecast, by Application 2020 & 2033
- Table 56: Global Fram Memory Volume K Forecast, by Application 2020 & 2033
- Table 57: Global Fram Memory Revenue million Forecast, by Type 2020 & 2033
- Table 58: Global Fram Memory Volume K Forecast, by Type 2020 & 2033
- Table 59: Global Fram Memory Revenue million Forecast, by Country 2020 & 2033
- Table 60: Global Fram Memory Volume K Forecast, by Country 2020 & 2033
- Table 61: Turkey Fram Memory Revenue (million) Forecast, by Application 2020 & 2033
- Table 62: Turkey Fram Memory Volume (K) Forecast, by Application 2020 & 2033
- Table 63: Israel Fram Memory Revenue (million) Forecast, by Application 2020 & 2033
- Table 64: Israel Fram Memory Volume (K) Forecast, by Application 2020 & 2033
- Table 65: GCC Fram Memory Revenue (million) Forecast, by Application 2020 & 2033
- Table 66: GCC Fram Memory Volume (K) Forecast, by Application 2020 & 2033
- Table 67: North Africa Fram Memory Revenue (million) Forecast, by Application 2020 & 2033
- Table 68: North Africa Fram Memory Volume (K) Forecast, by Application 2020 & 2033
- Table 69: South Africa Fram Memory Revenue (million) Forecast, by Application 2020 & 2033
- Table 70: South Africa Fram Memory Volume (K) Forecast, by Application 2020 & 2033
- Table 71: Rest of Middle East & Africa Fram Memory Revenue (million) Forecast, by Application 2020 & 2033
- Table 72: Rest of Middle East & Africa Fram Memory Volume (K) Forecast, by Application 2020 & 2033
- Table 73: Global Fram Memory Revenue million Forecast, by Application 2020 & 2033
- Table 74: Global Fram Memory Volume K Forecast, by Application 2020 & 2033
- Table 75: Global Fram Memory Revenue million Forecast, by Type 2020 & 2033
- Table 76: Global Fram Memory Volume K Forecast, by Type 2020 & 2033
- Table 77: Global Fram Memory Revenue million Forecast, by Country 2020 & 2033
- Table 78: Global Fram Memory Volume K Forecast, by Country 2020 & 2033
- Table 79: China Fram Memory Revenue (million) Forecast, by Application 2020 & 2033
- Table 80: China Fram Memory Volume (K) Forecast, by Application 2020 & 2033
- Table 81: India Fram Memory Revenue (million) Forecast, by Application 2020 & 2033
- Table 82: India Fram Memory Volume (K) Forecast, by Application 2020 & 2033
- Table 83: Japan Fram Memory Revenue (million) Forecast, by Application 2020 & 2033
- Table 84: Japan Fram Memory Volume (K) Forecast, by Application 2020 & 2033
- Table 85: South Korea Fram Memory Revenue (million) Forecast, by Application 2020 & 2033
- Table 86: South Korea Fram Memory Volume (K) Forecast, by Application 2020 & 2033
- Table 87: ASEAN Fram Memory Revenue (million) Forecast, by Application 2020 & 2033
- Table 88: ASEAN Fram Memory Volume (K) Forecast, by Application 2020 & 2033
- Table 89: Oceania Fram Memory Revenue (million) Forecast, by Application 2020 & 2033
- Table 90: Oceania Fram Memory Volume (K) Forecast, by Application 2020 & 2033
- Table 91: Rest of Asia Pacific Fram Memory Revenue (million) Forecast, by Application 2020 & 2033
- Table 92: Rest of Asia Pacific Fram Memory Volume (K) Forecast, by Application 2020 & 2033
Frequently Asked Questions
1. What is the projected Compound Annual Growth Rate (CAGR) of the Fram Memory?
The projected CAGR is approximately 5.3%.
2. Which companies are prominent players in the Fram Memory?
Key companies in the market include Cypress Semiconductor, Fujitsu, Infineon Technologies, Ramtron International.
3. What are the main segments of the Fram Memory?
The market segments include Application, Type.
4. Can you provide details about the market size?
The market size is estimated to be USD 1252 million as of 2022.
5. What are some drivers contributing to market growth?
N/A
6. What are the notable trends driving market growth?
N/A
7. Are there any restraints impacting market growth?
N/A
8. Can you provide examples of recent developments in the market?
N/A
9. What pricing options are available for accessing the report?
Pricing options include single-user, multi-user, and enterprise licenses priced at USD 3950.00, USD 5925.00, and USD 7900.00 respectively.
10. Is the market size provided in terms of value or volume?
The market size is provided in terms of value, measured in million and volume, measured in K.
11. Are there any specific market keywords associated with the report?
Yes, the market keyword associated with the report is "Fram Memory," which aids in identifying and referencing the specific market segment covered.
12. How do I determine which pricing option suits my needs best?
The pricing options vary based on user requirements and access needs. Individual users may opt for single-user licenses, while businesses requiring broader access may choose multi-user or enterprise licenses for cost-effective access to the report.
13. Are there any additional resources or data provided in the Fram Memory report?
While the report offers comprehensive insights, it's advisable to review the specific contents or supplementary materials provided to ascertain if additional resources or data are available.
14. How can I stay updated on further developments or reports in the Fram Memory?
To stay informed about further developments, trends, and reports in the Fram Memory, consider subscribing to industry newsletters, following relevant companies and organizations, or regularly checking reputable industry news sources and publications.
Methodology
Step 1 - Identification of Relevant Samples Size from Population Database


Step 2 - Approaches for Defining Global Market Size (Value, Volume* & Price*)

Note*: In applicable scenarios
Step 3 - Data Sources
Primary Research
- Web Analytics
- Survey Reports
- Research Institute
- Latest Research Reports
- Opinion Leaders
Secondary Research
- Annual Reports
- White Paper
- Latest Press Release
- Industry Association
- Paid Database
- Investor Presentations

Step 4 - Data Triangulation
Involves using different sources of information in order to increase the validity of a study
These sources are likely to be stakeholders in a program - participants, other researchers, program staff, other community members, and so on.
Then we put all data in single framework & apply various statistical tools to find out the dynamic on the market.
During the analysis stage, feedback from the stakeholder groups would be compared to determine areas of agreement as well as areas of divergence