

Key Insights
The global market for low viscosity fluids liquid flow meters is experiencing robust growth, driven by increasing demand across diverse industries. The expanding application of these meters in sectors like pharmaceuticals, chemicals, and food processing, where precise fluid control is crucial, is a primary catalyst. Technological advancements, such as the development of more accurate and reliable sensor technologies and the integration of smart features like remote monitoring and data analytics, are further fueling market expansion. Miniaturization trends are also playing a significant role, enabling the use of these meters in increasingly compact and portable applications. While the market faces challenges such as the high initial investment costs associated with advanced meter technologies and potential supply chain disruptions, the overall growth trajectory remains positive. We project a Compound Annual Growth Rate (CAGR) of approximately 8% from 2025 to 2033, driven by continuous innovation and the growing need for precise fluid management across various industrial sectors.
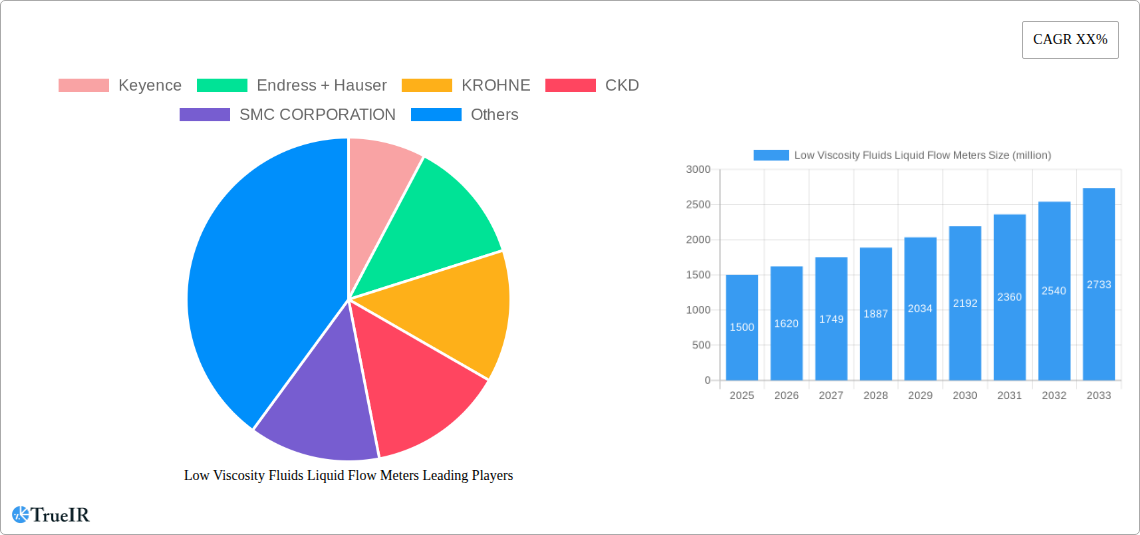
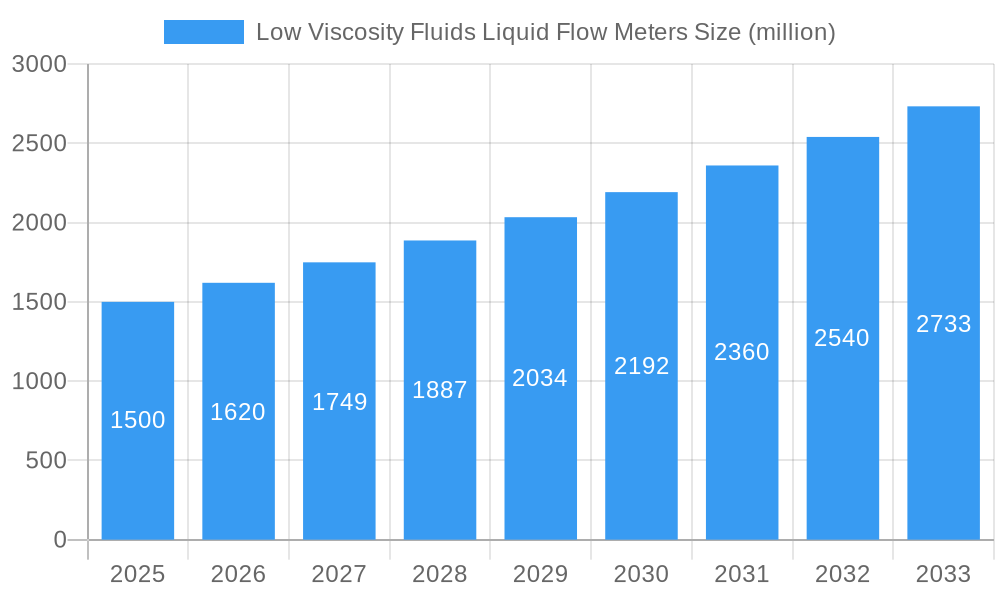
Low Viscosity Fluids Liquid Flow Meters Market Size (In Billion)
The competitive landscape is characterized by a mix of established global players and specialized niche companies. Keyence, Endress+Hauser, and Krohne are among the leading vendors, benefiting from their extensive product portfolios and global reach. However, smaller companies focusing on innovative technologies and specialized applications are also gaining traction. The market is segmented based on meter type (e.g., Coriolis, ultrasonic, differential pressure), application (e.g., chemical processing, pharmaceuticals), and geography. North America and Europe currently hold significant market shares, driven by strong industrial infrastructure and high adoption rates. However, rapidly developing economies in Asia-Pacific are showing significant growth potential and are projected to become increasingly important in the coming years. This growth is largely attributed to infrastructure development and the rise of manufacturing in these regions.
Low Viscosity Fluids Liquid Flow Meters Company Market Share
Low Viscosity Fluids Liquid Flow Meters Market Report: A Comprehensive Analysis (2019-2033)
This dynamic report provides a comprehensive analysis of the global low viscosity fluids liquid flow meters market, offering invaluable insights for stakeholders across the industry. With a study period spanning 2019-2033, a base year of 2025, and a forecast period of 2025-2033, this report leverages millions of data points to deliver actionable intelligence. The market is projected to reach xx million by 2033, exhibiting a CAGR of xx% during the forecast period. Key players like Keyence, Endress+Hauser, KROHNE, and others are analyzed for their market share, strategic initiatives, and competitive positioning.
Low Viscosity Fluids Liquid Flow Meters Market Structure & Competitive Landscape
The global low viscosity fluids liquid flow meters market is characterized by a moderately concentrated landscape, with the top five players holding an estimated xx% market share in 2025. Keyence, Endress+Hauser, KROHNE, CKD, and SMC Corporation are among the leading players, constantly innovating to expand their product portfolios and geographical reach.
Market Concentration:
- The Herfindahl-Hirschman Index (HHI) is estimated at xx in 2025, indicating a moderately concentrated market.
- The top five players control approximately xx million in revenue.
- The market is witnessing increased consolidation through mergers and acquisitions (M&A), with an estimated xx million in M&A activity during 2019-2024.
Innovation Drivers:
- The demand for higher accuracy and precision in flow measurement is driving the development of advanced sensor technologies, such as ultrasonic and Coriolis flow meters.
- Miniaturization and the integration of smart functionalities are enhancing the market appeal of low viscosity fluids liquid flow meters.
- Regulatory pressures to improve environmental monitoring and reduce emissions are also contributing to innovation.
Regulatory Impacts:
- Stringent environmental regulations related to emissions and waste management are shaping market dynamics.
- Compliance with safety and quality standards is crucial for market access in various regions.
Product Substitutes & End-User Segmentation:
- Alternative technologies, such as volumetric and weigh-based measurement methods, represent potential substitutes.
- The market is segmented by end-user industries, including chemicals, pharmaceuticals, food & beverages, and oil & gas, with the chemical industry currently dominating.
M&A Trends:
- Strategic acquisitions are frequently employed to expand market reach, acquire new technologies, and strengthen competitive positioning.
Low Viscosity Fluids Liquid Flow Meters Market Trends & Opportunities
The global low viscosity fluids liquid flow meters market is experiencing robust growth, driven by rising demand across various end-use sectors. Technological advancements, particularly in sensor technology and data analytics, are shaping market dynamics. The increasing adoption of automation and Industry 4.0 technologies is also fueling market expansion. The market size is projected to grow from xx million in 2025 to xx million by 2033, representing a significant opportunity for market players.
Consumer preferences are shifting towards higher accuracy, improved reliability, and reduced maintenance costs. This has spurred the development of more durable and user-friendly flow meters with advanced features like real-time data monitoring and remote diagnostics. The market displays a high level of competitive intensity, with established players and new entrants vying for market share through product innovation, strategic partnerships, and aggressive pricing strategies. The market penetration rate for smart flow meters is anticipated to rise significantly to xx% by 2033.
Dominant Markets & Segments in Low Viscosity Fluids Liquid Flow Meters
The Asia-Pacific region currently dominates the global low viscosity fluids liquid flow meters market, owing to rapid industrialization, substantial infrastructural development, and growing demand from key industries such as chemicals and pharmaceuticals. China and India are major contributors to this regional dominance.
Key Growth Drivers (Asia-Pacific):
- Significant investments in infrastructure development, particularly in the chemical and manufacturing sectors.
- Favorable government policies and initiatives promoting industrial automation and technological advancements.
- A large and growing pool of end-user industries driving demand.
- Increasing adoption of advanced technologies in process automation.
Detailed Analysis of Market Dominance:
The Asia-Pacific region's dominance stems from the substantial growth experienced by its key economies such as China and India, which have witnessed significant expansion of their chemical, pharmaceutical, and food and beverage sectors. These industries heavily rely on accurate and efficient flow measurement for optimal process control, quality management, and efficient resource utilization. Moreover, government initiatives encouraging industrial automation and technological upgrades have further accelerated market adoption in this region. This trend is anticipated to continue during the forecast period, leading to a sustained increase in market share for the region.
Low Viscosity Fluids Liquid Flow Meters Product Analysis
Recent innovations in low viscosity fluids liquid flow meters include the development of highly accurate, compact, and energy-efficient devices that use advanced sensor technologies such as ultrasonic, Coriolis, and thermal dispersion methods. These new-generation flow meters are designed to seamlessly integrate into automated systems, providing real-time data and remote diagnostics capabilities. Furthermore, the market is witnessing a growing demand for flow meters with enhanced features such as improved chemical compatibility, extended operating life, and advanced data analytics capabilities to facilitate better process control and optimization. The technological advancements are primarily driven by the need for increased accuracy, improved reliability, and reduced maintenance costs in diverse applications such as chemical processing, pharmaceutical manufacturing, and biomedical research.
Key Drivers, Barriers & Challenges in Low Viscosity Fluids Liquid Flow Meters
Key Drivers:
- Rising demand from various end-use industries, including chemicals, pharmaceuticals, and food & beverages.
- Technological advancements leading to the development of more accurate, reliable, and cost-effective flow meters.
- Growing emphasis on process automation and optimization across industrial sectors.
- Stringent environmental regulations necessitating accurate flow measurement for emission control.
Challenges and Restraints:
- The market experiences competitive pressure due to the presence of numerous established players and new entrants.
- Supply chain disruptions and fluctuations in raw material prices can impact manufacturing costs and profitability.
- Complex regulatory requirements in different regions may hinder market penetration. Compliance costs for manufacturers may represent a significant challenge.
- The potential for obsolescence due to rapid technological advancements requires significant investment in R&D. An estimated xx million is spent annually on R&D across the market.
Growth Drivers in the Low Viscosity Fluids Liquid Flow Meters Market
The market is propelled by several factors including the growing adoption of automation in various industries, increasing demand for precise flow measurement in critical processes, and continuous advancements in sensor technologies leading to more accurate and reliable devices. Government regulations related to environmental monitoring and emissions control also play a crucial role in driving market growth. Moreover, the expansion of end-use industries such as pharmaceuticals, chemicals, and food and beverages is further fueling market demand.
Challenges Impacting Low Viscosity Fluids Liquid Flow Meters Growth
Challenges include the high initial investment costs associated with adopting advanced flow measurement systems, the need for specialized technical expertise to operate and maintain such systems, and the potential for supply chain disruptions impacting product availability and price stability. Regulatory hurdles, particularly concerning safety and compliance standards, can also significantly hinder market expansion. The competitive landscape, with numerous players offering similar products, adds to the challenges of establishing a strong market presence.
Key Players Shaping the Low Viscosity Fluids Liquid Flow Meters Market
- Keyence
- Endress+Hauser
- KROHNE
- CKD
- SMC CORPORATION
- ifm
- Aichi Tokei Denki Co
- Azbil Corporation
- Bronkhorst
- Sensirion
- McMillan
- KEM Küppers Elektromechanik
- Horiba
- Bronkhorst High-Tech
- Intek, Inc
Significant Low Viscosity Fluids Liquid Flow Meters Industry Milestones
- 2020: Keyence launched a new series of high-precision ultrasonic flow meters, significantly improving accuracy and reducing maintenance needs.
- 2021: Endress+Hauser acquired a smaller flow meter manufacturer, expanding its product portfolio and market reach.
- 2022: Industry-wide adoption of new international standards for flow measurement increased accuracy and consistency across the industry.
- 2023: Several manufacturers released flow meters with integrated IoT capabilities for remote monitoring and predictive maintenance.
- 2024: A significant regulatory change in the EU impacted the market, requiring upgraded flow measurement technology for specific applications.
Future Outlook for Low Viscosity Fluids Liquid Flow Meters Market
The future of the low viscosity fluids liquid flow meters market is promising, driven by sustained growth in various end-use industries, continuous technological advancements, and increasing adoption of automation and digitalization. Strategic partnerships, collaborations, and investments in R&D will be crucial for market players to maintain their competitive edge. The market is expected to witness the emergence of new innovative technologies, such as microfluidic flow meters and advanced sensor integration with AI-powered analytics, which will enhance accuracy, reliability, and operational efficiency. This will lead to a sustained period of growth and market expansion in the coming years, with substantial potential for new market entrants and existing players to capitalize on this opportunity.
Low Viscosity Fluids Liquid Flow Meters Segmentation
-
1. Application
- 1.1. Semiconductor Manufacturing Equipment
- 1.2. Food Machinery
- 1.3. Machine Tools
- 1.4. Pharmaceutical Equipment
- 1.5. Electrical Electronics
- 1.6. Solar Cell Manufacturing Equipment
- 1.7. FPD Manufacturing Equipment
- 1.8. Physical and Chemical Equipment
- 1.9. Others
-
2. Types
- 2.1. Fixed Type
- 2.2. Portable Type
Low Viscosity Fluids Liquid Flow Meters Segmentation By Geography
-
1. North America
- 1.1. United States
- 1.2. Canada
- 1.3. Mexico
-
2. South America
- 2.1. Brazil
- 2.2. Argentina
- 2.3. Rest of South America
-
3. Europe
- 3.1. United Kingdom
- 3.2. Germany
- 3.3. France
- 3.4. Italy
- 3.5. Spain
- 3.6. Russia
- 3.7. Benelux
- 3.8. Nordics
- 3.9. Rest of Europe
-
4. Middle East & Africa
- 4.1. Turkey
- 4.2. Israel
- 4.3. GCC
- 4.4. North Africa
- 4.5. South Africa
- 4.6. Rest of Middle East & Africa
-
5. Asia Pacific
- 5.1. China
- 5.2. India
- 5.3. Japan
- 5.4. South Korea
- 5.5. ASEAN
- 5.6. Oceania
- 5.7. Rest of Asia Pacific

Low Viscosity Fluids Liquid Flow Meters Regional Market Share
Geographic Coverage of Low Viscosity Fluids Liquid Flow Meters
Low Viscosity Fluids Liquid Flow Meters REPORT HIGHLIGHTS
| Aspects | Details |
|---|---|
| Study Period | 2020-2034 |
| Base Year | 2025 |
| Estimated Year | 2026 |
| Forecast Period | 2026-2034 |
| Historical Period | 2020-2025 |
| Growth Rate | CAGR of XX% from 2020-2034 |
| Segmentation |
|
Table of Contents
- 1. Introduction
- 1.1. Research Scope
- 1.2. Market Segmentation
- 1.3. Research Methodology
- 1.4. Definitions and Assumptions
- 2. Executive Summary
- 2.1. Introduction
- 3. Market Dynamics
- 3.1. Introduction
- 3.2. Market Drivers
- 3.3. Market Restrains
- 3.4. Market Trends
- 4. Market Factor Analysis
- 4.1. Porters Five Forces
- 4.2. Supply/Value Chain
- 4.3. PESTEL analysis
- 4.4. Market Entropy
- 4.5. Patent/Trademark Analysis
- 5. Global Low Viscosity Fluids Liquid Flow Meters Analysis, Insights and Forecast, 2020-2032
- 5.1. Market Analysis, Insights and Forecast - by Application
- 5.1.1. Semiconductor Manufacturing Equipment
- 5.1.2. Food Machinery
- 5.1.3. Machine Tools
- 5.1.4. Pharmaceutical Equipment
- 5.1.5. Electrical Electronics
- 5.1.6. Solar Cell Manufacturing Equipment
- 5.1.7. FPD Manufacturing Equipment
- 5.1.8. Physical and Chemical Equipment
- 5.1.9. Others
- 5.2. Market Analysis, Insights and Forecast - by Types
- 5.2.1. Fixed Type
- 5.2.2. Portable Type
- 5.3. Market Analysis, Insights and Forecast - by Region
- 5.3.1. North America
- 5.3.2. South America
- 5.3.3. Europe
- 5.3.4. Middle East & Africa
- 5.3.5. Asia Pacific
- 5.1. Market Analysis, Insights and Forecast - by Application
- 6. North America Low Viscosity Fluids Liquid Flow Meters Analysis, Insights and Forecast, 2020-2032
- 6.1. Market Analysis, Insights and Forecast - by Application
- 6.1.1. Semiconductor Manufacturing Equipment
- 6.1.2. Food Machinery
- 6.1.3. Machine Tools
- 6.1.4. Pharmaceutical Equipment
- 6.1.5. Electrical Electronics
- 6.1.6. Solar Cell Manufacturing Equipment
- 6.1.7. FPD Manufacturing Equipment
- 6.1.8. Physical and Chemical Equipment
- 6.1.9. Others
- 6.2. Market Analysis, Insights and Forecast - by Types
- 6.2.1. Fixed Type
- 6.2.2. Portable Type
- 6.1. Market Analysis, Insights and Forecast - by Application
- 7. South America Low Viscosity Fluids Liquid Flow Meters Analysis, Insights and Forecast, 2020-2032
- 7.1. Market Analysis, Insights and Forecast - by Application
- 7.1.1. Semiconductor Manufacturing Equipment
- 7.1.2. Food Machinery
- 7.1.3. Machine Tools
- 7.1.4. Pharmaceutical Equipment
- 7.1.5. Electrical Electronics
- 7.1.6. Solar Cell Manufacturing Equipment
- 7.1.7. FPD Manufacturing Equipment
- 7.1.8. Physical and Chemical Equipment
- 7.1.9. Others
- 7.2. Market Analysis, Insights and Forecast - by Types
- 7.2.1. Fixed Type
- 7.2.2. Portable Type
- 7.1. Market Analysis, Insights and Forecast - by Application
- 8. Europe Low Viscosity Fluids Liquid Flow Meters Analysis, Insights and Forecast, 2020-2032
- 8.1. Market Analysis, Insights and Forecast - by Application
- 8.1.1. Semiconductor Manufacturing Equipment
- 8.1.2. Food Machinery
- 8.1.3. Machine Tools
- 8.1.4. Pharmaceutical Equipment
- 8.1.5. Electrical Electronics
- 8.1.6. Solar Cell Manufacturing Equipment
- 8.1.7. FPD Manufacturing Equipment
- 8.1.8. Physical and Chemical Equipment
- 8.1.9. Others
- 8.2. Market Analysis, Insights and Forecast - by Types
- 8.2.1. Fixed Type
- 8.2.2. Portable Type
- 8.1. Market Analysis, Insights and Forecast - by Application
- 9. Middle East & Africa Low Viscosity Fluids Liquid Flow Meters Analysis, Insights and Forecast, 2020-2032
- 9.1. Market Analysis, Insights and Forecast - by Application
- 9.1.1. Semiconductor Manufacturing Equipment
- 9.1.2. Food Machinery
- 9.1.3. Machine Tools
- 9.1.4. Pharmaceutical Equipment
- 9.1.5. Electrical Electronics
- 9.1.6. Solar Cell Manufacturing Equipment
- 9.1.7. FPD Manufacturing Equipment
- 9.1.8. Physical and Chemical Equipment
- 9.1.9. Others
- 9.2. Market Analysis, Insights and Forecast - by Types
- 9.2.1. Fixed Type
- 9.2.2. Portable Type
- 9.1. Market Analysis, Insights and Forecast - by Application
- 10. Asia Pacific Low Viscosity Fluids Liquid Flow Meters Analysis, Insights and Forecast, 2020-2032
- 10.1. Market Analysis, Insights and Forecast - by Application
- 10.1.1. Semiconductor Manufacturing Equipment
- 10.1.2. Food Machinery
- 10.1.3. Machine Tools
- 10.1.4. Pharmaceutical Equipment
- 10.1.5. Electrical Electronics
- 10.1.6. Solar Cell Manufacturing Equipment
- 10.1.7. FPD Manufacturing Equipment
- 10.1.8. Physical and Chemical Equipment
- 10.1.9. Others
- 10.2. Market Analysis, Insights and Forecast - by Types
- 10.2.1. Fixed Type
- 10.2.2. Portable Type
- 10.1. Market Analysis, Insights and Forecast - by Application
- 11. Competitive Analysis
- 11.1. Global Market Share Analysis 2025
- 11.2. Company Profiles
- 11.2.1 Keyence
- 11.2.1.1. Overview
- 11.2.1.2. Products
- 11.2.1.3. SWOT Analysis
- 11.2.1.4. Recent Developments
- 11.2.1.5. Financials (Based on Availability)
- 11.2.2 Endress + Hauser
- 11.2.2.1. Overview
- 11.2.2.2. Products
- 11.2.2.3. SWOT Analysis
- 11.2.2.4. Recent Developments
- 11.2.2.5. Financials (Based on Availability)
- 11.2.3 KROHNE
- 11.2.3.1. Overview
- 11.2.3.2. Products
- 11.2.3.3. SWOT Analysis
- 11.2.3.4. Recent Developments
- 11.2.3.5. Financials (Based on Availability)
- 11.2.4 CKD
- 11.2.4.1. Overview
- 11.2.4.2. Products
- 11.2.4.3. SWOT Analysis
- 11.2.4.4. Recent Developments
- 11.2.4.5. Financials (Based on Availability)
- 11.2.5 SMC CORPORATION
- 11.2.5.1. Overview
- 11.2.5.2. Products
- 11.2.5.3. SWOT Analysis
- 11.2.5.4. Recent Developments
- 11.2.5.5. Financials (Based on Availability)
- 11.2.6 ifm
- 11.2.6.1. Overview
- 11.2.6.2. Products
- 11.2.6.3. SWOT Analysis
- 11.2.6.4. Recent Developments
- 11.2.6.5. Financials (Based on Availability)
- 11.2.7 Aichi Tokei Denki Co
- 11.2.7.1. Overview
- 11.2.7.2. Products
- 11.2.7.3. SWOT Analysis
- 11.2.7.4. Recent Developments
- 11.2.7.5. Financials (Based on Availability)
- 11.2.8 Azbil Corporation
- 11.2.8.1. Overview
- 11.2.8.2. Products
- 11.2.8.3. SWOT Analysis
- 11.2.8.4. Recent Developments
- 11.2.8.5. Financials (Based on Availability)
- 11.2.9 Bronkhorst
- 11.2.9.1. Overview
- 11.2.9.2. Products
- 11.2.9.3. SWOT Analysis
- 11.2.9.4. Recent Developments
- 11.2.9.5. Financials (Based on Availability)
- 11.2.10 Sensirion
- 11.2.10.1. Overview
- 11.2.10.2. Products
- 11.2.10.3. SWOT Analysis
- 11.2.10.4. Recent Developments
- 11.2.10.5. Financials (Based on Availability)
- 11.2.11 McMillan
- 11.2.11.1. Overview
- 11.2.11.2. Products
- 11.2.11.3. SWOT Analysis
- 11.2.11.4. Recent Developments
- 11.2.11.5. Financials (Based on Availability)
- 11.2.12 KEM Küppers Elektromechanik
- 11.2.12.1. Overview
- 11.2.12.2. Products
- 11.2.12.3. SWOT Analysis
- 11.2.12.4. Recent Developments
- 11.2.12.5. Financials (Based on Availability)
- 11.2.13 Horiba
- 11.2.13.1. Overview
- 11.2.13.2. Products
- 11.2.13.3. SWOT Analysis
- 11.2.13.4. Recent Developments
- 11.2.13.5. Financials (Based on Availability)
- 11.2.14 Bronkhorst High-Tech
- 11.2.14.1. Overview
- 11.2.14.2. Products
- 11.2.14.3. SWOT Analysis
- 11.2.14.4. Recent Developments
- 11.2.14.5. Financials (Based on Availability)
- 11.2.15 Intek
- 11.2.15.1. Overview
- 11.2.15.2. Products
- 11.2.15.3. SWOT Analysis
- 11.2.15.4. Recent Developments
- 11.2.15.5. Financials (Based on Availability)
- 11.2.16 Inc
- 11.2.16.1. Overview
- 11.2.16.2. Products
- 11.2.16.3. SWOT Analysis
- 11.2.16.4. Recent Developments
- 11.2.16.5. Financials (Based on Availability)
- 11.2.1 Keyence
List of Figures
- Figure 1: Global Low Viscosity Fluids Liquid Flow Meters Revenue Breakdown (million, %) by Region 2025 & 2033
- Figure 2: Global Low Viscosity Fluids Liquid Flow Meters Volume Breakdown (K, %) by Region 2025 & 2033
- Figure 3: North America Low Viscosity Fluids Liquid Flow Meters Revenue (million), by Application 2025 & 2033
- Figure 4: North America Low Viscosity Fluids Liquid Flow Meters Volume (K), by Application 2025 & 2033
- Figure 5: North America Low Viscosity Fluids Liquid Flow Meters Revenue Share (%), by Application 2025 & 2033
- Figure 6: North America Low Viscosity Fluids Liquid Flow Meters Volume Share (%), by Application 2025 & 2033
- Figure 7: North America Low Viscosity Fluids Liquid Flow Meters Revenue (million), by Types 2025 & 2033
- Figure 8: North America Low Viscosity Fluids Liquid Flow Meters Volume (K), by Types 2025 & 2033
- Figure 9: North America Low Viscosity Fluids Liquid Flow Meters Revenue Share (%), by Types 2025 & 2033
- Figure 10: North America Low Viscosity Fluids Liquid Flow Meters Volume Share (%), by Types 2025 & 2033
- Figure 11: North America Low Viscosity Fluids Liquid Flow Meters Revenue (million), by Country 2025 & 2033
- Figure 12: North America Low Viscosity Fluids Liquid Flow Meters Volume (K), by Country 2025 & 2033
- Figure 13: North America Low Viscosity Fluids Liquid Flow Meters Revenue Share (%), by Country 2025 & 2033
- Figure 14: North America Low Viscosity Fluids Liquid Flow Meters Volume Share (%), by Country 2025 & 2033
- Figure 15: South America Low Viscosity Fluids Liquid Flow Meters Revenue (million), by Application 2025 & 2033
- Figure 16: South America Low Viscosity Fluids Liquid Flow Meters Volume (K), by Application 2025 & 2033
- Figure 17: South America Low Viscosity Fluids Liquid Flow Meters Revenue Share (%), by Application 2025 & 2033
- Figure 18: South America Low Viscosity Fluids Liquid Flow Meters Volume Share (%), by Application 2025 & 2033
- Figure 19: South America Low Viscosity Fluids Liquid Flow Meters Revenue (million), by Types 2025 & 2033
- Figure 20: South America Low Viscosity Fluids Liquid Flow Meters Volume (K), by Types 2025 & 2033
- Figure 21: South America Low Viscosity Fluids Liquid Flow Meters Revenue Share (%), by Types 2025 & 2033
- Figure 22: South America Low Viscosity Fluids Liquid Flow Meters Volume Share (%), by Types 2025 & 2033
- Figure 23: South America Low Viscosity Fluids Liquid Flow Meters Revenue (million), by Country 2025 & 2033
- Figure 24: South America Low Viscosity Fluids Liquid Flow Meters Volume (K), by Country 2025 & 2033
- Figure 25: South America Low Viscosity Fluids Liquid Flow Meters Revenue Share (%), by Country 2025 & 2033
- Figure 26: South America Low Viscosity Fluids Liquid Flow Meters Volume Share (%), by Country 2025 & 2033
- Figure 27: Europe Low Viscosity Fluids Liquid Flow Meters Revenue (million), by Application 2025 & 2033
- Figure 28: Europe Low Viscosity Fluids Liquid Flow Meters Volume (K), by Application 2025 & 2033
- Figure 29: Europe Low Viscosity Fluids Liquid Flow Meters Revenue Share (%), by Application 2025 & 2033
- Figure 30: Europe Low Viscosity Fluids Liquid Flow Meters Volume Share (%), by Application 2025 & 2033
- Figure 31: Europe Low Viscosity Fluids Liquid Flow Meters Revenue (million), by Types 2025 & 2033
- Figure 32: Europe Low Viscosity Fluids Liquid Flow Meters Volume (K), by Types 2025 & 2033
- Figure 33: Europe Low Viscosity Fluids Liquid Flow Meters Revenue Share (%), by Types 2025 & 2033
- Figure 34: Europe Low Viscosity Fluids Liquid Flow Meters Volume Share (%), by Types 2025 & 2033
- Figure 35: Europe Low Viscosity Fluids Liquid Flow Meters Revenue (million), by Country 2025 & 2033
- Figure 36: Europe Low Viscosity Fluids Liquid Flow Meters Volume (K), by Country 2025 & 2033
- Figure 37: Europe Low Viscosity Fluids Liquid Flow Meters Revenue Share (%), by Country 2025 & 2033
- Figure 38: Europe Low Viscosity Fluids Liquid Flow Meters Volume Share (%), by Country 2025 & 2033
- Figure 39: Middle East & Africa Low Viscosity Fluids Liquid Flow Meters Revenue (million), by Application 2025 & 2033
- Figure 40: Middle East & Africa Low Viscosity Fluids Liquid Flow Meters Volume (K), by Application 2025 & 2033
- Figure 41: Middle East & Africa Low Viscosity Fluids Liquid Flow Meters Revenue Share (%), by Application 2025 & 2033
- Figure 42: Middle East & Africa Low Viscosity Fluids Liquid Flow Meters Volume Share (%), by Application 2025 & 2033
- Figure 43: Middle East & Africa Low Viscosity Fluids Liquid Flow Meters Revenue (million), by Types 2025 & 2033
- Figure 44: Middle East & Africa Low Viscosity Fluids Liquid Flow Meters Volume (K), by Types 2025 & 2033
- Figure 45: Middle East & Africa Low Viscosity Fluids Liquid Flow Meters Revenue Share (%), by Types 2025 & 2033
- Figure 46: Middle East & Africa Low Viscosity Fluids Liquid Flow Meters Volume Share (%), by Types 2025 & 2033
- Figure 47: Middle East & Africa Low Viscosity Fluids Liquid Flow Meters Revenue (million), by Country 2025 & 2033
- Figure 48: Middle East & Africa Low Viscosity Fluids Liquid Flow Meters Volume (K), by Country 2025 & 2033
- Figure 49: Middle East & Africa Low Viscosity Fluids Liquid Flow Meters Revenue Share (%), by Country 2025 & 2033
- Figure 50: Middle East & Africa Low Viscosity Fluids Liquid Flow Meters Volume Share (%), by Country 2025 & 2033
- Figure 51: Asia Pacific Low Viscosity Fluids Liquid Flow Meters Revenue (million), by Application 2025 & 2033
- Figure 52: Asia Pacific Low Viscosity Fluids Liquid Flow Meters Volume (K), by Application 2025 & 2033
- Figure 53: Asia Pacific Low Viscosity Fluids Liquid Flow Meters Revenue Share (%), by Application 2025 & 2033
- Figure 54: Asia Pacific Low Viscosity Fluids Liquid Flow Meters Volume Share (%), by Application 2025 & 2033
- Figure 55: Asia Pacific Low Viscosity Fluids Liquid Flow Meters Revenue (million), by Types 2025 & 2033
- Figure 56: Asia Pacific Low Viscosity Fluids Liquid Flow Meters Volume (K), by Types 2025 & 2033
- Figure 57: Asia Pacific Low Viscosity Fluids Liquid Flow Meters Revenue Share (%), by Types 2025 & 2033
- Figure 58: Asia Pacific Low Viscosity Fluids Liquid Flow Meters Volume Share (%), by Types 2025 & 2033
- Figure 59: Asia Pacific Low Viscosity Fluids Liquid Flow Meters Revenue (million), by Country 2025 & 2033
- Figure 60: Asia Pacific Low Viscosity Fluids Liquid Flow Meters Volume (K), by Country 2025 & 2033
- Figure 61: Asia Pacific Low Viscosity Fluids Liquid Flow Meters Revenue Share (%), by Country 2025 & 2033
- Figure 62: Asia Pacific Low Viscosity Fluids Liquid Flow Meters Volume Share (%), by Country 2025 & 2033
List of Tables
- Table 1: Global Low Viscosity Fluids Liquid Flow Meters Revenue million Forecast, by Application 2020 & 2033
- Table 2: Global Low Viscosity Fluids Liquid Flow Meters Volume K Forecast, by Application 2020 & 2033
- Table 3: Global Low Viscosity Fluids Liquid Flow Meters Revenue million Forecast, by Types 2020 & 2033
- Table 4: Global Low Viscosity Fluids Liquid Flow Meters Volume K Forecast, by Types 2020 & 2033
- Table 5: Global Low Viscosity Fluids Liquid Flow Meters Revenue million Forecast, by Region 2020 & 2033
- Table 6: Global Low Viscosity Fluids Liquid Flow Meters Volume K Forecast, by Region 2020 & 2033
- Table 7: Global Low Viscosity Fluids Liquid Flow Meters Revenue million Forecast, by Application 2020 & 2033
- Table 8: Global Low Viscosity Fluids Liquid Flow Meters Volume K Forecast, by Application 2020 & 2033
- Table 9: Global Low Viscosity Fluids Liquid Flow Meters Revenue million Forecast, by Types 2020 & 2033
- Table 10: Global Low Viscosity Fluids Liquid Flow Meters Volume K Forecast, by Types 2020 & 2033
- Table 11: Global Low Viscosity Fluids Liquid Flow Meters Revenue million Forecast, by Country 2020 & 2033
- Table 12: Global Low Viscosity Fluids Liquid Flow Meters Volume K Forecast, by Country 2020 & 2033
- Table 13: United States Low Viscosity Fluids Liquid Flow Meters Revenue (million) Forecast, by Application 2020 & 2033
- Table 14: United States Low Viscosity Fluids Liquid Flow Meters Volume (K) Forecast, by Application 2020 & 2033
- Table 15: Canada Low Viscosity Fluids Liquid Flow Meters Revenue (million) Forecast, by Application 2020 & 2033
- Table 16: Canada Low Viscosity Fluids Liquid Flow Meters Volume (K) Forecast, by Application 2020 & 2033
- Table 17: Mexico Low Viscosity Fluids Liquid Flow Meters Revenue (million) Forecast, by Application 2020 & 2033
- Table 18: Mexico Low Viscosity Fluids Liquid Flow Meters Volume (K) Forecast, by Application 2020 & 2033
- Table 19: Global Low Viscosity Fluids Liquid Flow Meters Revenue million Forecast, by Application 2020 & 2033
- Table 20: Global Low Viscosity Fluids Liquid Flow Meters Volume K Forecast, by Application 2020 & 2033
- Table 21: Global Low Viscosity Fluids Liquid Flow Meters Revenue million Forecast, by Types 2020 & 2033
- Table 22: Global Low Viscosity Fluids Liquid Flow Meters Volume K Forecast, by Types 2020 & 2033
- Table 23: Global Low Viscosity Fluids Liquid Flow Meters Revenue million Forecast, by Country 2020 & 2033
- Table 24: Global Low Viscosity Fluids Liquid Flow Meters Volume K Forecast, by Country 2020 & 2033
- Table 25: Brazil Low Viscosity Fluids Liquid Flow Meters Revenue (million) Forecast, by Application 2020 & 2033
- Table 26: Brazil Low Viscosity Fluids Liquid Flow Meters Volume (K) Forecast, by Application 2020 & 2033
- Table 27: Argentina Low Viscosity Fluids Liquid Flow Meters Revenue (million) Forecast, by Application 2020 & 2033
- Table 28: Argentina Low Viscosity Fluids Liquid Flow Meters Volume (K) Forecast, by Application 2020 & 2033
- Table 29: Rest of South America Low Viscosity Fluids Liquid Flow Meters Revenue (million) Forecast, by Application 2020 & 2033
- Table 30: Rest of South America Low Viscosity Fluids Liquid Flow Meters Volume (K) Forecast, by Application 2020 & 2033
- Table 31: Global Low Viscosity Fluids Liquid Flow Meters Revenue million Forecast, by Application 2020 & 2033
- Table 32: Global Low Viscosity Fluids Liquid Flow Meters Volume K Forecast, by Application 2020 & 2033
- Table 33: Global Low Viscosity Fluids Liquid Flow Meters Revenue million Forecast, by Types 2020 & 2033
- Table 34: Global Low Viscosity Fluids Liquid Flow Meters Volume K Forecast, by Types 2020 & 2033
- Table 35: Global Low Viscosity Fluids Liquid Flow Meters Revenue million Forecast, by Country 2020 & 2033
- Table 36: Global Low Viscosity Fluids Liquid Flow Meters Volume K Forecast, by Country 2020 & 2033
- Table 37: United Kingdom Low Viscosity Fluids Liquid Flow Meters Revenue (million) Forecast, by Application 2020 & 2033
- Table 38: United Kingdom Low Viscosity Fluids Liquid Flow Meters Volume (K) Forecast, by Application 2020 & 2033
- Table 39: Germany Low Viscosity Fluids Liquid Flow Meters Revenue (million) Forecast, by Application 2020 & 2033
- Table 40: Germany Low Viscosity Fluids Liquid Flow Meters Volume (K) Forecast, by Application 2020 & 2033
- Table 41: France Low Viscosity Fluids Liquid Flow Meters Revenue (million) Forecast, by Application 2020 & 2033
- Table 42: France Low Viscosity Fluids Liquid Flow Meters Volume (K) Forecast, by Application 2020 & 2033
- Table 43: Italy Low Viscosity Fluids Liquid Flow Meters Revenue (million) Forecast, by Application 2020 & 2033
- Table 44: Italy Low Viscosity Fluids Liquid Flow Meters Volume (K) Forecast, by Application 2020 & 2033
- Table 45: Spain Low Viscosity Fluids Liquid Flow Meters Revenue (million) Forecast, by Application 2020 & 2033
- Table 46: Spain Low Viscosity Fluids Liquid Flow Meters Volume (K) Forecast, by Application 2020 & 2033
- Table 47: Russia Low Viscosity Fluids Liquid Flow Meters Revenue (million) Forecast, by Application 2020 & 2033
- Table 48: Russia Low Viscosity Fluids Liquid Flow Meters Volume (K) Forecast, by Application 2020 & 2033
- Table 49: Benelux Low Viscosity Fluids Liquid Flow Meters Revenue (million) Forecast, by Application 2020 & 2033
- Table 50: Benelux Low Viscosity Fluids Liquid Flow Meters Volume (K) Forecast, by Application 2020 & 2033
- Table 51: Nordics Low Viscosity Fluids Liquid Flow Meters Revenue (million) Forecast, by Application 2020 & 2033
- Table 52: Nordics Low Viscosity Fluids Liquid Flow Meters Volume (K) Forecast, by Application 2020 & 2033
- Table 53: Rest of Europe Low Viscosity Fluids Liquid Flow Meters Revenue (million) Forecast, by Application 2020 & 2033
- Table 54: Rest of Europe Low Viscosity Fluids Liquid Flow Meters Volume (K) Forecast, by Application 2020 & 2033
- Table 55: Global Low Viscosity Fluids Liquid Flow Meters Revenue million Forecast, by Application 2020 & 2033
- Table 56: Global Low Viscosity Fluids Liquid Flow Meters Volume K Forecast, by Application 2020 & 2033
- Table 57: Global Low Viscosity Fluids Liquid Flow Meters Revenue million Forecast, by Types 2020 & 2033
- Table 58: Global Low Viscosity Fluids Liquid Flow Meters Volume K Forecast, by Types 2020 & 2033
- Table 59: Global Low Viscosity Fluids Liquid Flow Meters Revenue million Forecast, by Country 2020 & 2033
- Table 60: Global Low Viscosity Fluids Liquid Flow Meters Volume K Forecast, by Country 2020 & 2033
- Table 61: Turkey Low Viscosity Fluids Liquid Flow Meters Revenue (million) Forecast, by Application 2020 & 2033
- Table 62: Turkey Low Viscosity Fluids Liquid Flow Meters Volume (K) Forecast, by Application 2020 & 2033
- Table 63: Israel Low Viscosity Fluids Liquid Flow Meters Revenue (million) Forecast, by Application 2020 & 2033
- Table 64: Israel Low Viscosity Fluids Liquid Flow Meters Volume (K) Forecast, by Application 2020 & 2033
- Table 65: GCC Low Viscosity Fluids Liquid Flow Meters Revenue (million) Forecast, by Application 2020 & 2033
- Table 66: GCC Low Viscosity Fluids Liquid Flow Meters Volume (K) Forecast, by Application 2020 & 2033
- Table 67: North Africa Low Viscosity Fluids Liquid Flow Meters Revenue (million) Forecast, by Application 2020 & 2033
- Table 68: North Africa Low Viscosity Fluids Liquid Flow Meters Volume (K) Forecast, by Application 2020 & 2033
- Table 69: South Africa Low Viscosity Fluids Liquid Flow Meters Revenue (million) Forecast, by Application 2020 & 2033
- Table 70: South Africa Low Viscosity Fluids Liquid Flow Meters Volume (K) Forecast, by Application 2020 & 2033
- Table 71: Rest of Middle East & Africa Low Viscosity Fluids Liquid Flow Meters Revenue (million) Forecast, by Application 2020 & 2033
- Table 72: Rest of Middle East & Africa Low Viscosity Fluids Liquid Flow Meters Volume (K) Forecast, by Application 2020 & 2033
- Table 73: Global Low Viscosity Fluids Liquid Flow Meters Revenue million Forecast, by Application 2020 & 2033
- Table 74: Global Low Viscosity Fluids Liquid Flow Meters Volume K Forecast, by Application 2020 & 2033
- Table 75: Global Low Viscosity Fluids Liquid Flow Meters Revenue million Forecast, by Types 2020 & 2033
- Table 76: Global Low Viscosity Fluids Liquid Flow Meters Volume K Forecast, by Types 2020 & 2033
- Table 77: Global Low Viscosity Fluids Liquid Flow Meters Revenue million Forecast, by Country 2020 & 2033
- Table 78: Global Low Viscosity Fluids Liquid Flow Meters Volume K Forecast, by Country 2020 & 2033
- Table 79: China Low Viscosity Fluids Liquid Flow Meters Revenue (million) Forecast, by Application 2020 & 2033
- Table 80: China Low Viscosity Fluids Liquid Flow Meters Volume (K) Forecast, by Application 2020 & 2033
- Table 81: India Low Viscosity Fluids Liquid Flow Meters Revenue (million) Forecast, by Application 2020 & 2033
- Table 82: India Low Viscosity Fluids Liquid Flow Meters Volume (K) Forecast, by Application 2020 & 2033
- Table 83: Japan Low Viscosity Fluids Liquid Flow Meters Revenue (million) Forecast, by Application 2020 & 2033
- Table 84: Japan Low Viscosity Fluids Liquid Flow Meters Volume (K) Forecast, by Application 2020 & 2033
- Table 85: South Korea Low Viscosity Fluids Liquid Flow Meters Revenue (million) Forecast, by Application 2020 & 2033
- Table 86: South Korea Low Viscosity Fluids Liquid Flow Meters Volume (K) Forecast, by Application 2020 & 2033
- Table 87: ASEAN Low Viscosity Fluids Liquid Flow Meters Revenue (million) Forecast, by Application 2020 & 2033
- Table 88: ASEAN Low Viscosity Fluids Liquid Flow Meters Volume (K) Forecast, by Application 2020 & 2033
- Table 89: Oceania Low Viscosity Fluids Liquid Flow Meters Revenue (million) Forecast, by Application 2020 & 2033
- Table 90: Oceania Low Viscosity Fluids Liquid Flow Meters Volume (K) Forecast, by Application 2020 & 2033
- Table 91: Rest of Asia Pacific Low Viscosity Fluids Liquid Flow Meters Revenue (million) Forecast, by Application 2020 & 2033
- Table 92: Rest of Asia Pacific Low Viscosity Fluids Liquid Flow Meters Volume (K) Forecast, by Application 2020 & 2033
Frequently Asked Questions
1. What is the projected Compound Annual Growth Rate (CAGR) of the Low Viscosity Fluids Liquid Flow Meters?
The projected CAGR is approximately XX%.
2. Which companies are prominent players in the Low Viscosity Fluids Liquid Flow Meters?
Key companies in the market include Keyence, Endress + Hauser, KROHNE, CKD, SMC CORPORATION, ifm, Aichi Tokei Denki Co, Azbil Corporation, Bronkhorst, Sensirion, McMillan, KEM Küppers Elektromechanik, Horiba, Bronkhorst High-Tech, Intek, Inc.
3. What are the main segments of the Low Viscosity Fluids Liquid Flow Meters?
The market segments include Application, Types.
4. Can you provide details about the market size?
The market size is estimated to be USD XXX million as of 2022.
5. What are some drivers contributing to market growth?
N/A
6. What are the notable trends driving market growth?
N/A
7. Are there any restraints impacting market growth?
N/A
8. Can you provide examples of recent developments in the market?
N/A
9. What pricing options are available for accessing the report?
Pricing options include single-user, multi-user, and enterprise licenses priced at USD 3350.00, USD 5025.00, and USD 6700.00 respectively.
10. Is the market size provided in terms of value or volume?
The market size is provided in terms of value, measured in million and volume, measured in K.
11. Are there any specific market keywords associated with the report?
Yes, the market keyword associated with the report is "Low Viscosity Fluids Liquid Flow Meters," which aids in identifying and referencing the specific market segment covered.
12. How do I determine which pricing option suits my needs best?
The pricing options vary based on user requirements and access needs. Individual users may opt for single-user licenses, while businesses requiring broader access may choose multi-user or enterprise licenses for cost-effective access to the report.
13. Are there any additional resources or data provided in the Low Viscosity Fluids Liquid Flow Meters report?
While the report offers comprehensive insights, it's advisable to review the specific contents or supplementary materials provided to ascertain if additional resources or data are available.
14. How can I stay updated on further developments or reports in the Low Viscosity Fluids Liquid Flow Meters?
To stay informed about further developments, trends, and reports in the Low Viscosity Fluids Liquid Flow Meters, consider subscribing to industry newsletters, following relevant companies and organizations, or regularly checking reputable industry news sources and publications.
Methodology
Step 1 - Identification of Relevant Samples Size from Population Database


Step 2 - Approaches for Defining Global Market Size (Value, Volume* & Price*)

Note*: In applicable scenarios
Step 3 - Data Sources
Primary Research
- Web Analytics
- Survey Reports
- Research Institute
- Latest Research Reports
- Opinion Leaders
Secondary Research
- Annual Reports
- White Paper
- Latest Press Release
- Industry Association
- Paid Database
- Investor Presentations

Step 4 - Data Triangulation
Involves using different sources of information in order to increase the validity of a study
These sources are likely to be stakeholders in a program - participants, other researchers, program staff, other community members, and so on.
Then we put all data in single framework & apply various statistical tools to find out the dynamic on the market.
During the analysis stage, feedback from the stakeholder groups would be compared to determine areas of agreement as well as areas of divergence