

Key Insights
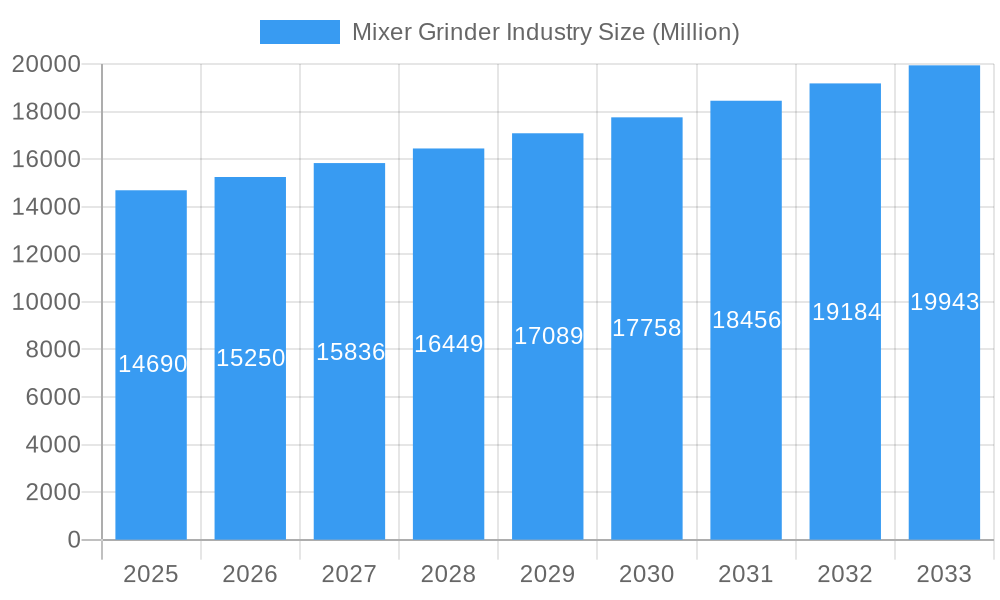
The global mixer grinder market, valued at $14.69 billion in 2025, is projected to experience steady growth, driven by increasing urbanization, changing lifestyles, and a rising demand for convenient kitchen appliances. The 3.71% CAGR indicates a consistent expansion throughout the forecast period (2025-2033). Key growth drivers include the rising popularity of healthy eating habits and home cooking, particularly in developing economies. The increasing availability of diverse product types, including stand mixers and traditional mixers catering to various needs and budgets, further fuels market expansion. Furthermore, the proliferation of online sales channels expands market reach and accessibility for consumers globally. However, market growth faces certain constraints, such as increasing competition among established brands and the emergence of new players, leading to price pressure. Moreover, fluctuating raw material costs and economic downturns can impact consumer spending on non-essential appliances. The market is segmented by end-user (residential and commercial), product type (stand mixer and traditional mixer), and distribution channel (multi-brand stores, exclusive stores, and online stores). Regional analysis reveals strong growth potential across Asia Pacific and North America, driven by high disposable incomes and increasing adoption of modern kitchen appliances.
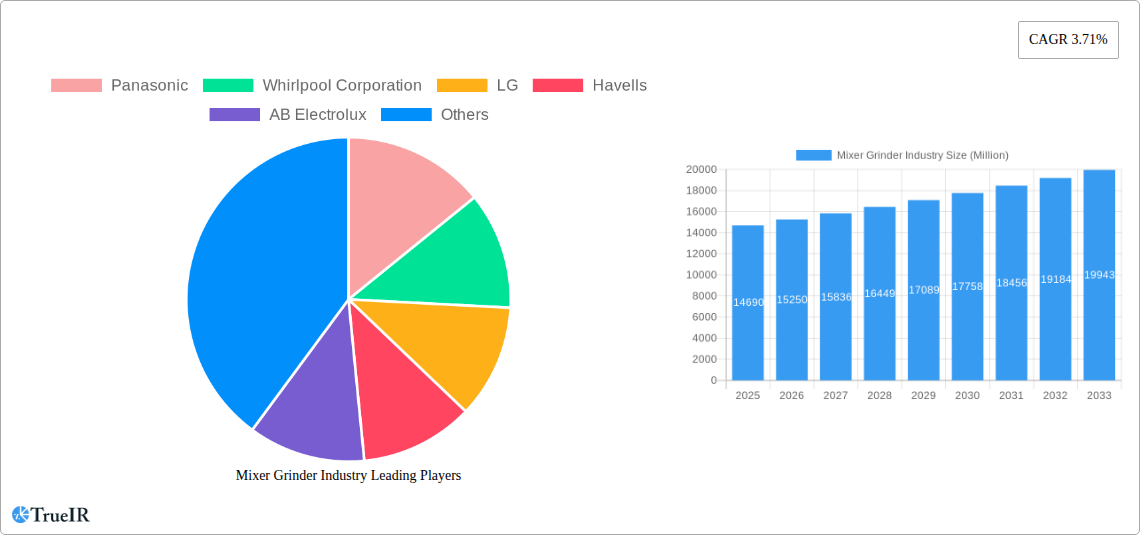
Mixer Grinder Industry Market Size (In Billion)
The market's competitive landscape features prominent players like Panasonic, Whirlpool, LG, Havells, Electrolux, Bosch, Philips, Samsung, Haier, and Morphy Richards, engaged in intense competition through product innovation, strategic partnerships, and aggressive marketing. Differentiation strategies, including technological advancements (such as smart features and improved durability), and targeted marketing campaigns focusing on specific consumer segments will prove crucial for success. The continuous evolution of consumer preferences, including a growing demand for energy-efficient and sustainable appliances, will require manufacturers to adapt their product offerings to meet these evolving needs. The forecast period is likely to witness an expansion in the adoption of online sales channels, particularly in regions with robust e-commerce infrastructure, leading to a shift in distribution strategies for manufacturers. Overall, while challenges exist, the mixer grinder market is poised for continued growth, fueled by changing consumer habits and technological advancements.
Mixer Grinder Industry Company Market Share
Mixer Grinder Industry Market Report: 2019-2033
This comprehensive report provides a detailed analysis of the global mixer grinder industry, covering the period 2019-2033. We delve into market size, segmentation, competitive landscape, and future growth projections, offering invaluable insights for stakeholders across the value chain. With a focus on key players like Panasonic, Whirlpool Corporation, LG, Havells, AB Electrolux, Bosch Global, Philips, Samsung, Haier Inc, and Morphy Richards, this report is essential for strategic decision-making. The report uses 2025 as the base year and projects the market until 2033.
Mixer Grinder Industry Market Structure & Competitive Landscape
The global mixer grinder market is characterized by a moderately concentrated structure, with the top 10 players holding an estimated xx% market share in 2025. Innovation is a key driver, with companies continuously introducing new features like improved motor technology, enhanced safety mechanisms, and diverse designs to cater to evolving consumer preferences. Regulatory changes concerning energy efficiency and safety standards significantly impact market dynamics. Product substitutes, such as food processors and hand blenders, exert competitive pressure, but the mixer grinder's versatility and affordability maintain its dominance in many markets. The residential segment dominates the end-user landscape, accounting for approximately xx Million units in 2025.
Key aspects of the competitive landscape include:
- Mergers and Acquisitions (M&A) activity: The industry has witnessed several significant M&A activities in recent years, including the acquisition of Tosei Corporation by Electrolux Professional. Such activities reflect consolidation trends and the pursuit of increased market share and scale. The total M&A value in the mixer grinder industry between 2019 and 2024 was estimated at xx Million USD, with an average annual value of xx Million USD.
- Market Concentration: The Herfindahl-Hirschman Index (HHI) for the global mixer grinder market is estimated to be xx in 2025, indicating a moderately concentrated market.
- Innovation: Continuous innovation in motor technology, blade design, and safety features drives competition and market expansion. The introduction of smart features and connected appliances is shaping future market trends.
Mixer Grinder Industry Market Trends & Opportunities
The global mixer grinder market is projected to experience robust growth throughout the forecast period (2025-2033). Market size is expected to reach xx Million units by 2033, exhibiting a Compound Annual Growth Rate (CAGR) of xx% from 2025 to 2033. This growth is fueled by several factors, including rising disposable incomes in emerging economies, increasing urbanization, and changing lifestyles leading to greater demand for convenient and efficient kitchen appliances. Technological advancements, such as the integration of smart features and improved energy efficiency, are driving premiumization within the market. Consumer preferences are shifting towards compact, versatile models with enhanced safety features and easy-to-clean designs. Competitive dynamics remain intense, with key players focusing on product differentiation, brand building, and effective distribution strategies to gain a competitive edge. Market penetration rates are expected to increase significantly, particularly in developing regions.
Dominant Markets & Segments in Mixer Grinder Industry
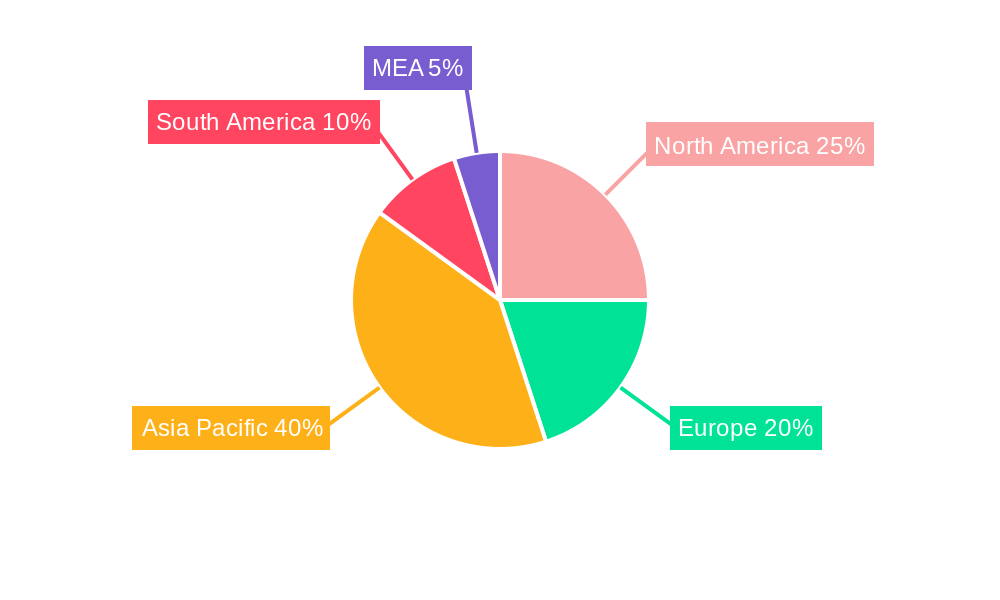
The Asia-Pacific region is projected to be the dominant market for mixer grinders throughout the forecast period, driven by rapid economic growth, a large population, and increasing adoption of modern kitchen appliances. Within this region, India and China are expected to be the key growth drivers.
Key Growth Drivers:
- Rising Disposable Incomes: Increased purchasing power fuels demand for convenient and time-saving kitchen appliances.
- Urbanization: The migration of populations to urban centers accelerates the adoption of modern kitchen appliances.
- Changing Lifestyles: Busy lifestyles contribute to the demand for time-efficient cooking solutions.
Dominant Segments:
- End User: The residential segment dominates, accounting for over xx% of the market in 2025. Commercial applications show a slower growth rate.
- Product Type: Traditional mixer grinders maintain a significant market share due to their affordability and wide acceptance. However, stand mixers are gaining traction in developed markets.
- Distribution Channel: Multi-brand stores remain the dominant distribution channel, but online sales are rapidly expanding, capturing an increasingly significant share.
Mixer Grinder Industry Product Analysis
Mixer grinder innovation focuses on enhancing functionality, durability, and user experience. Technological advancements include improved motor technology for increased power and efficiency, enhanced safety features like overload protection, and ergonomic designs for easier handling. The market is witnessing a shift towards multi-functional appliances with additional features like juicing and chopping capabilities. These innovations cater to the growing demand for versatile and convenient kitchen appliances. The competitive advantage lies in offering superior performance, durability, aesthetics, and innovative features at competitive prices.
Key Drivers, Barriers & Challenges in Mixer Grinder Industry
Key Drivers:
Technological advancements like improved motor efficiency and smart features, rising disposable incomes in developing countries, and changing consumer lifestyles that favor convenience are driving market growth. Government initiatives promoting energy-efficient appliances also play a positive role.
Challenges:
Supply chain disruptions, rising raw material costs, and intense competition exert significant pressure on profit margins. Stringent regulatory requirements concerning safety and energy efficiency add complexity and cost. The emergence of substitute products like food processors also poses a challenge. These factors could limit market expansion unless companies effectively mitigate these challenges through innovative solutions and efficient supply chain management.
Growth Drivers in the Mixer Grinder Industry Market
Rising disposable incomes, particularly in emerging markets, are a significant driver. Technological advancements, such as the integration of smart features, improved energy efficiency, and compact designs, fuel growth. Changing consumer lifestyles emphasizing convenience are also key drivers.
Challenges Impacting Mixer Grinder Industry Growth
Fluctuating raw material prices and supply chain disruptions create uncertainty and impact production costs. Stringent safety and energy efficiency regulations increase compliance costs. Competition from substitute products and other kitchen appliances puts pressure on market share.
Key Players Shaping the Mixer Grinder Industry Market
- Panasonic
- Whirlpool Corporation
- LG
- Havells
- AB Electrolux
- Bosch Global
- Philips
- Samsung
- Haier Inc
- Morphy Richards
Significant Mixer Grinder Industry Milestones
- April 2023: Bosch announced plans to acquire TSI Semiconductors.
- August 2023: Bosch finalized the acquisition of TSI Semiconductors, forming Robert Bosch Semiconductor LLC.
- December 2023: Electrolux Professional completed the acquisition of Tosei Corporation.
Future Outlook for Mixer Grinder Industry Market
The mixer grinder market is poised for continued growth, driven by sustained economic expansion in emerging markets, ongoing technological innovation, and evolving consumer preferences. Strategic opportunities lie in developing energy-efficient and smart appliances, expanding into new markets, and strengthening distribution networks. The market potential remains substantial, particularly in developing regions with rising disposable incomes and a growing middle class.
Mixer Grinder Industry Segmentation
-
1. Product Type
- 1.1. Stand Mixer
- 1.2. Traditional Mixer
-
2. Distribution Channel
- 2.1. Multi-brands Stores
- 2.2. Exclusive Stores
- 2.3. Online Stores
- 2.4. Other Distribution Channels
-
3. End User
- 3.1. Residential
- 3.2. Commercial
Mixer Grinder Industry Segmentation By Geography
- 1. North America
- 2. Europe
- 3. Asia Pacific
- 4. Latin America
- 5. Middle East and Africa
Mixer Grinder Industry Regional Market Share
Geographic Coverage of Mixer Grinder Industry
Mixer Grinder Industry REPORT HIGHLIGHTS
| Aspects | Details |
|---|---|
| Study Period | 2020-2034 |
| Base Year | 2025 |
| Estimated Year | 2026 |
| Forecast Period | 2026-2034 |
| Historical Period | 2020-2025 |
| Growth Rate | CAGR of 3.71% from 2020-2034 |
| Segmentation |
|
Table of Contents
- 1. Introduction
- 1.1. Research Scope
- 1.2. Market Segmentation
- 1.3. Research Objective
- 1.4. Definitions and Assumptions
- 2. Executive Summary
- 2.1. Market Snapshot
- 3. Market Dynamics
- 3.1. Market Drivers
- 3.2. Market Restrains
- 3.3. Market Trends
- 3.4. Market Opportunities
- 4. Market Factor Analysis
- 4.1. Porters Five Forces
- 4.1.1. Bargaining Power of Suppliers
- 4.1.2. Bargaining Power of Buyers
- 4.1.3. Threat of New Entrants
- 4.1.4. Threat of Substitutes
- 4.1.5. Competitive Rivalry
- 4.2. PESTEL analysis
- 4.3. BCG Analysis
- 4.3.1. Stars (High Growth, High Market Share)
- 4.3.2. Cash Cows (Low Growth, High Market Share)
- 4.3.3. Question Mark (High Growth, Low Market Share)
- 4.3.4. Dogs (Low Growth, Low Market Share)
- 4.4. Ansoff Matrix Analysis
- 4.5. Supply Chain Analysis
- 4.6. Regulatory Landscape
- 4.7. Current Market Potential and Opportunity Assessment (TAM–SAM–SOM Framework)
- 4.8. TIR Analyst Note
- 4.1. Porters Five Forces
- 5. Market Analysis, Insights and Forecast 2021-2033
- 5.1. Market Analysis, Insights and Forecast - by Product Type
- 5.1.1. Stand Mixer
- 5.1.2. Traditional Mixer
- 5.2. Market Analysis, Insights and Forecast - by Distribution Channel
- 5.2.1. Multi-brands Stores
- 5.2.2. Exclusive Stores
- 5.2.3. Online Stores
- 5.2.4. Other Distribution Channels
- 5.3. Market Analysis, Insights and Forecast - by End User
- 5.3.1. Residential
- 5.3.2. Commercial
- 5.4. Market Analysis, Insights and Forecast - by Region
- 5.4.1. North America
- 5.4.2. Europe
- 5.4.3. Asia Pacific
- 5.4.4. Latin America
- 5.4.5. Middle East and Africa
- 5.1. Market Analysis, Insights and Forecast - by Product Type
- 6. Global Mixer Grinder Industry Analysis, Insights and Forecast, 2021-2033
- 6.1. Market Analysis, Insights and Forecast - by Product Type
- 6.1.1. Stand Mixer
- 6.1.2. Traditional Mixer
- 6.2. Market Analysis, Insights and Forecast - by Distribution Channel
- 6.2.1. Multi-brands Stores
- 6.2.2. Exclusive Stores
- 6.2.3. Online Stores
- 6.2.4. Other Distribution Channels
- 6.3. Market Analysis, Insights and Forecast - by End User
- 6.3.1. Residential
- 6.3.2. Commercial
- 6.1. Market Analysis, Insights and Forecast - by Product Type
- 7. North America Mixer Grinder Industry Analysis, Insights and Forecast, 2020-2032
- 7.1. Market Analysis, Insights and Forecast - by Product Type
- 7.1.1. Stand Mixer
- 7.1.2. Traditional Mixer
- 7.2. Market Analysis, Insights and Forecast - by Distribution Channel
- 7.2.1. Multi-brands Stores
- 7.2.2. Exclusive Stores
- 7.2.3. Online Stores
- 7.2.4. Other Distribution Channels
- 7.3. Market Analysis, Insights and Forecast - by End User
- 7.3.1. Residential
- 7.3.2. Commercial
- 7.1. Market Analysis, Insights and Forecast - by Product Type
- 8. Europe Mixer Grinder Industry Analysis, Insights and Forecast, 2020-2032
- 8.1. Market Analysis, Insights and Forecast - by Product Type
- 8.1.1. Stand Mixer
- 8.1.2. Traditional Mixer
- 8.2. Market Analysis, Insights and Forecast - by Distribution Channel
- 8.2.1. Multi-brands Stores
- 8.2.2. Exclusive Stores
- 8.2.3. Online Stores
- 8.2.4. Other Distribution Channels
- 8.3. Market Analysis, Insights and Forecast - by End User
- 8.3.1. Residential
- 8.3.2. Commercial
- 8.1. Market Analysis, Insights and Forecast - by Product Type
- 9. Asia Pacific Mixer Grinder Industry Analysis, Insights and Forecast, 2020-2032
- 9.1. Market Analysis, Insights and Forecast - by Product Type
- 9.1.1. Stand Mixer
- 9.1.2. Traditional Mixer
- 9.2. Market Analysis, Insights and Forecast - by Distribution Channel
- 9.2.1. Multi-brands Stores
- 9.2.2. Exclusive Stores
- 9.2.3. Online Stores
- 9.2.4. Other Distribution Channels
- 9.3. Market Analysis, Insights and Forecast - by End User
- 9.3.1. Residential
- 9.3.2. Commercial
- 9.1. Market Analysis, Insights and Forecast - by Product Type
- 10. Latin America Mixer Grinder Industry Analysis, Insights and Forecast, 2020-2032
- 10.1. Market Analysis, Insights and Forecast - by Product Type
- 10.1.1. Stand Mixer
- 10.1.2. Traditional Mixer
- 10.2. Market Analysis, Insights and Forecast - by Distribution Channel
- 10.2.1. Multi-brands Stores
- 10.2.2. Exclusive Stores
- 10.2.3. Online Stores
- 10.2.4. Other Distribution Channels
- 10.3. Market Analysis, Insights and Forecast - by End User
- 10.3.1. Residential
- 10.3.2. Commercial
- 10.1. Market Analysis, Insights and Forecast - by Product Type
- 11. Middle East and Africa Mixer Grinder Industry Analysis, Insights and Forecast, 2020-2032
- 11.1. Market Analysis, Insights and Forecast - by Product Type
- 11.1.1. Stand Mixer
- 11.1.2. Traditional Mixer
- 11.2. Market Analysis, Insights and Forecast - by Distribution Channel
- 11.2.1. Multi-brands Stores
- 11.2.2. Exclusive Stores
- 11.2.3. Online Stores
- 11.2.4. Other Distribution Channels
- 11.3. Market Analysis, Insights and Forecast - by End User
- 11.3.1. Residential
- 11.3.2. Commercial
- 11.1. Market Analysis, Insights and Forecast - by Product Type
- 12. Competitive Analysis
- 12.1. Company Profiles
- 12.1.1 Panasonic
- 12.1.1.1. Company Overview
- 12.1.1.2. Products
- 12.1.1.3. Company Financials
- 12.1.1.4. SWOT Analysis
- 12.1.2 Whirlpool Corporation
- 12.1.2.1. Company Overview
- 12.1.2.2. Products
- 12.1.2.3. Company Financials
- 12.1.2.4. SWOT Analysis
- 12.1.3 LG
- 12.1.3.1. Company Overview
- 12.1.3.2. Products
- 12.1.3.3. Company Financials
- 12.1.3.4. SWOT Analysis
- 12.1.4 Havells
- 12.1.4.1. Company Overview
- 12.1.4.2. Products
- 12.1.4.3. Company Financials
- 12.1.4.4. SWOT Analysis
- 12.1.5 AB Electrolux
- 12.1.5.1. Company Overview
- 12.1.5.2. Products
- 12.1.5.3. Company Financials
- 12.1.5.4. SWOT Analysis
- 12.1.6 Bosch Global
- 12.1.6.1. Company Overview
- 12.1.6.2. Products
- 12.1.6.3. Company Financials
- 12.1.6.4. SWOT Analysis
- 12.1.7 Philips
- 12.1.7.1. Company Overview
- 12.1.7.2. Products
- 12.1.7.3. Company Financials
- 12.1.7.4. SWOT Analysis
- 12.1.8 Samsung
- 12.1.8.1. Company Overview
- 12.1.8.2. Products
- 12.1.8.3. Company Financials
- 12.1.8.4. SWOT Analysis
- 12.1.9 Haier Inc
- 12.1.9.1. Company Overview
- 12.1.9.2. Products
- 12.1.9.3. Company Financials
- 12.1.9.4. SWOT Analysis
- 12.1.10 Morphy Richards
- 12.1.10.1. Company Overview
- 12.1.10.2. Products
- 12.1.10.3. Company Financials
- 12.1.10.4. SWOT Analysis
- 12.1.1 Panasonic
- 12.2. Market Entropy
- 12.2.1 Company's Key Areas Served
- 12.2.2 Recent Developments
- 12.3. Company Market Share Analysis 2025
- 12.3.1 Top 5 Companies Market Share Analysis
- 12.3.2 Top 3 Companies Market Share Analysis
- 12.4. List of Potential Customers
- 13. Research Methodology
List of Figures
- Figure 1: Global Mixer Grinder Industry Revenue Breakdown (Million, %) by Region 2025 & 2033
- Figure 2: Global Mixer Grinder Industry Volume Breakdown (K Unit, %) by Region 2025 & 2033
- Figure 3: North America Mixer Grinder Industry Revenue (Million), by Product Type 2025 & 2033
- Figure 4: North America Mixer Grinder Industry Volume (K Unit), by Product Type 2025 & 2033
- Figure 5: North America Mixer Grinder Industry Revenue Share (%), by Product Type 2025 & 2033
- Figure 6: North America Mixer Grinder Industry Volume Share (%), by Product Type 2025 & 2033
- Figure 7: North America Mixer Grinder Industry Revenue (Million), by Distribution Channel 2025 & 2033
- Figure 8: North America Mixer Grinder Industry Volume (K Unit), by Distribution Channel 2025 & 2033
- Figure 9: North America Mixer Grinder Industry Revenue Share (%), by Distribution Channel 2025 & 2033
- Figure 10: North America Mixer Grinder Industry Volume Share (%), by Distribution Channel 2025 & 2033
- Figure 11: North America Mixer Grinder Industry Revenue (Million), by End User 2025 & 2033
- Figure 12: North America Mixer Grinder Industry Volume (K Unit), by End User 2025 & 2033
- Figure 13: North America Mixer Grinder Industry Revenue Share (%), by End User 2025 & 2033
- Figure 14: North America Mixer Grinder Industry Volume Share (%), by End User 2025 & 2033
- Figure 15: North America Mixer Grinder Industry Revenue (Million), by Country 2025 & 2033
- Figure 16: North America Mixer Grinder Industry Volume (K Unit), by Country 2025 & 2033
- Figure 17: North America Mixer Grinder Industry Revenue Share (%), by Country 2025 & 2033
- Figure 18: North America Mixer Grinder Industry Volume Share (%), by Country 2025 & 2033
- Figure 19: Europe Mixer Grinder Industry Revenue (Million), by Product Type 2025 & 2033
- Figure 20: Europe Mixer Grinder Industry Volume (K Unit), by Product Type 2025 & 2033
- Figure 21: Europe Mixer Grinder Industry Revenue Share (%), by Product Type 2025 & 2033
- Figure 22: Europe Mixer Grinder Industry Volume Share (%), by Product Type 2025 & 2033
- Figure 23: Europe Mixer Grinder Industry Revenue (Million), by Distribution Channel 2025 & 2033
- Figure 24: Europe Mixer Grinder Industry Volume (K Unit), by Distribution Channel 2025 & 2033
- Figure 25: Europe Mixer Grinder Industry Revenue Share (%), by Distribution Channel 2025 & 2033
- Figure 26: Europe Mixer Grinder Industry Volume Share (%), by Distribution Channel 2025 & 2033
- Figure 27: Europe Mixer Grinder Industry Revenue (Million), by End User 2025 & 2033
- Figure 28: Europe Mixer Grinder Industry Volume (K Unit), by End User 2025 & 2033
- Figure 29: Europe Mixer Grinder Industry Revenue Share (%), by End User 2025 & 2033
- Figure 30: Europe Mixer Grinder Industry Volume Share (%), by End User 2025 & 2033
- Figure 31: Europe Mixer Grinder Industry Revenue (Million), by Country 2025 & 2033
- Figure 32: Europe Mixer Grinder Industry Volume (K Unit), by Country 2025 & 2033
- Figure 33: Europe Mixer Grinder Industry Revenue Share (%), by Country 2025 & 2033
- Figure 34: Europe Mixer Grinder Industry Volume Share (%), by Country 2025 & 2033
- Figure 35: Asia Pacific Mixer Grinder Industry Revenue (Million), by Product Type 2025 & 2033
- Figure 36: Asia Pacific Mixer Grinder Industry Volume (K Unit), by Product Type 2025 & 2033
- Figure 37: Asia Pacific Mixer Grinder Industry Revenue Share (%), by Product Type 2025 & 2033
- Figure 38: Asia Pacific Mixer Grinder Industry Volume Share (%), by Product Type 2025 & 2033
- Figure 39: Asia Pacific Mixer Grinder Industry Revenue (Million), by Distribution Channel 2025 & 2033
- Figure 40: Asia Pacific Mixer Grinder Industry Volume (K Unit), by Distribution Channel 2025 & 2033
- Figure 41: Asia Pacific Mixer Grinder Industry Revenue Share (%), by Distribution Channel 2025 & 2033
- Figure 42: Asia Pacific Mixer Grinder Industry Volume Share (%), by Distribution Channel 2025 & 2033
- Figure 43: Asia Pacific Mixer Grinder Industry Revenue (Million), by End User 2025 & 2033
- Figure 44: Asia Pacific Mixer Grinder Industry Volume (K Unit), by End User 2025 & 2033
- Figure 45: Asia Pacific Mixer Grinder Industry Revenue Share (%), by End User 2025 & 2033
- Figure 46: Asia Pacific Mixer Grinder Industry Volume Share (%), by End User 2025 & 2033
- Figure 47: Asia Pacific Mixer Grinder Industry Revenue (Million), by Country 2025 & 2033
- Figure 48: Asia Pacific Mixer Grinder Industry Volume (K Unit), by Country 2025 & 2033
- Figure 49: Asia Pacific Mixer Grinder Industry Revenue Share (%), by Country 2025 & 2033
- Figure 50: Asia Pacific Mixer Grinder Industry Volume Share (%), by Country 2025 & 2033
- Figure 51: Latin America Mixer Grinder Industry Revenue (Million), by Product Type 2025 & 2033
- Figure 52: Latin America Mixer Grinder Industry Volume (K Unit), by Product Type 2025 & 2033
- Figure 53: Latin America Mixer Grinder Industry Revenue Share (%), by Product Type 2025 & 2033
- Figure 54: Latin America Mixer Grinder Industry Volume Share (%), by Product Type 2025 & 2033
- Figure 55: Latin America Mixer Grinder Industry Revenue (Million), by Distribution Channel 2025 & 2033
- Figure 56: Latin America Mixer Grinder Industry Volume (K Unit), by Distribution Channel 2025 & 2033
- Figure 57: Latin America Mixer Grinder Industry Revenue Share (%), by Distribution Channel 2025 & 2033
- Figure 58: Latin America Mixer Grinder Industry Volume Share (%), by Distribution Channel 2025 & 2033
- Figure 59: Latin America Mixer Grinder Industry Revenue (Million), by End User 2025 & 2033
- Figure 60: Latin America Mixer Grinder Industry Volume (K Unit), by End User 2025 & 2033
- Figure 61: Latin America Mixer Grinder Industry Revenue Share (%), by End User 2025 & 2033
- Figure 62: Latin America Mixer Grinder Industry Volume Share (%), by End User 2025 & 2033
- Figure 63: Latin America Mixer Grinder Industry Revenue (Million), by Country 2025 & 2033
- Figure 64: Latin America Mixer Grinder Industry Volume (K Unit), by Country 2025 & 2033
- Figure 65: Latin America Mixer Grinder Industry Revenue Share (%), by Country 2025 & 2033
- Figure 66: Latin America Mixer Grinder Industry Volume Share (%), by Country 2025 & 2033
- Figure 67: Middle East and Africa Mixer Grinder Industry Revenue (Million), by Product Type 2025 & 2033
- Figure 68: Middle East and Africa Mixer Grinder Industry Volume (K Unit), by Product Type 2025 & 2033
- Figure 69: Middle East and Africa Mixer Grinder Industry Revenue Share (%), by Product Type 2025 & 2033
- Figure 70: Middle East and Africa Mixer Grinder Industry Volume Share (%), by Product Type 2025 & 2033
- Figure 71: Middle East and Africa Mixer Grinder Industry Revenue (Million), by Distribution Channel 2025 & 2033
- Figure 72: Middle East and Africa Mixer Grinder Industry Volume (K Unit), by Distribution Channel 2025 & 2033
- Figure 73: Middle East and Africa Mixer Grinder Industry Revenue Share (%), by Distribution Channel 2025 & 2033
- Figure 74: Middle East and Africa Mixer Grinder Industry Volume Share (%), by Distribution Channel 2025 & 2033
- Figure 75: Middle East and Africa Mixer Grinder Industry Revenue (Million), by End User 2025 & 2033
- Figure 76: Middle East and Africa Mixer Grinder Industry Volume (K Unit), by End User 2025 & 2033
- Figure 77: Middle East and Africa Mixer Grinder Industry Revenue Share (%), by End User 2025 & 2033
- Figure 78: Middle East and Africa Mixer Grinder Industry Volume Share (%), by End User 2025 & 2033
- Figure 79: Middle East and Africa Mixer Grinder Industry Revenue (Million), by Country 2025 & 2033
- Figure 80: Middle East and Africa Mixer Grinder Industry Volume (K Unit), by Country 2025 & 2033
- Figure 81: Middle East and Africa Mixer Grinder Industry Revenue Share (%), by Country 2025 & 2033
- Figure 82: Middle East and Africa Mixer Grinder Industry Volume Share (%), by Country 2025 & 2033
List of Tables
- Table 1: Global Mixer Grinder Industry Revenue Million Forecast, by Product Type 2020 & 2033
- Table 2: Global Mixer Grinder Industry Volume K Unit Forecast, by Product Type 2020 & 2033
- Table 3: Global Mixer Grinder Industry Revenue Million Forecast, by Distribution Channel 2020 & 2033
- Table 4: Global Mixer Grinder Industry Volume K Unit Forecast, by Distribution Channel 2020 & 2033
- Table 5: Global Mixer Grinder Industry Revenue Million Forecast, by End User 2020 & 2033
- Table 6: Global Mixer Grinder Industry Volume K Unit Forecast, by End User 2020 & 2033
- Table 7: Global Mixer Grinder Industry Revenue Million Forecast, by Region 2020 & 2033
- Table 8: Global Mixer Grinder Industry Volume K Unit Forecast, by Region 2020 & 2033
- Table 9: Global Mixer Grinder Industry Revenue Million Forecast, by Product Type 2020 & 2033
- Table 10: Global Mixer Grinder Industry Volume K Unit Forecast, by Product Type 2020 & 2033
- Table 11: Global Mixer Grinder Industry Revenue Million Forecast, by Distribution Channel 2020 & 2033
- Table 12: Global Mixer Grinder Industry Volume K Unit Forecast, by Distribution Channel 2020 & 2033
- Table 13: Global Mixer Grinder Industry Revenue Million Forecast, by End User 2020 & 2033
- Table 14: Global Mixer Grinder Industry Volume K Unit Forecast, by End User 2020 & 2033
- Table 15: Global Mixer Grinder Industry Revenue Million Forecast, by Country 2020 & 2033
- Table 16: Global Mixer Grinder Industry Volume K Unit Forecast, by Country 2020 & 2033
- Table 17: Global Mixer Grinder Industry Revenue Million Forecast, by Product Type 2020 & 2033
- Table 18: Global Mixer Grinder Industry Volume K Unit Forecast, by Product Type 2020 & 2033
- Table 19: Global Mixer Grinder Industry Revenue Million Forecast, by Distribution Channel 2020 & 2033
- Table 20: Global Mixer Grinder Industry Volume K Unit Forecast, by Distribution Channel 2020 & 2033
- Table 21: Global Mixer Grinder Industry Revenue Million Forecast, by End User 2020 & 2033
- Table 22: Global Mixer Grinder Industry Volume K Unit Forecast, by End User 2020 & 2033
- Table 23: Global Mixer Grinder Industry Revenue Million Forecast, by Country 2020 & 2033
- Table 24: Global Mixer Grinder Industry Volume K Unit Forecast, by Country 2020 & 2033
- Table 25: Global Mixer Grinder Industry Revenue Million Forecast, by Product Type 2020 & 2033
- Table 26: Global Mixer Grinder Industry Volume K Unit Forecast, by Product Type 2020 & 2033
- Table 27: Global Mixer Grinder Industry Revenue Million Forecast, by Distribution Channel 2020 & 2033
- Table 28: Global Mixer Grinder Industry Volume K Unit Forecast, by Distribution Channel 2020 & 2033
- Table 29: Global Mixer Grinder Industry Revenue Million Forecast, by End User 2020 & 2033
- Table 30: Global Mixer Grinder Industry Volume K Unit Forecast, by End User 2020 & 2033
- Table 31: Global Mixer Grinder Industry Revenue Million Forecast, by Country 2020 & 2033
- Table 32: Global Mixer Grinder Industry Volume K Unit Forecast, by Country 2020 & 2033
- Table 33: Global Mixer Grinder Industry Revenue Million Forecast, by Product Type 2020 & 2033
- Table 34: Global Mixer Grinder Industry Volume K Unit Forecast, by Product Type 2020 & 2033
- Table 35: Global Mixer Grinder Industry Revenue Million Forecast, by Distribution Channel 2020 & 2033
- Table 36: Global Mixer Grinder Industry Volume K Unit Forecast, by Distribution Channel 2020 & 2033
- Table 37: Global Mixer Grinder Industry Revenue Million Forecast, by End User 2020 & 2033
- Table 38: Global Mixer Grinder Industry Volume K Unit Forecast, by End User 2020 & 2033
- Table 39: Global Mixer Grinder Industry Revenue Million Forecast, by Country 2020 & 2033
- Table 40: Global Mixer Grinder Industry Volume K Unit Forecast, by Country 2020 & 2033
- Table 41: Global Mixer Grinder Industry Revenue Million Forecast, by Product Type 2020 & 2033
- Table 42: Global Mixer Grinder Industry Volume K Unit Forecast, by Product Type 2020 & 2033
- Table 43: Global Mixer Grinder Industry Revenue Million Forecast, by Distribution Channel 2020 & 2033
- Table 44: Global Mixer Grinder Industry Volume K Unit Forecast, by Distribution Channel 2020 & 2033
- Table 45: Global Mixer Grinder Industry Revenue Million Forecast, by End User 2020 & 2033
- Table 46: Global Mixer Grinder Industry Volume K Unit Forecast, by End User 2020 & 2033
- Table 47: Global Mixer Grinder Industry Revenue Million Forecast, by Country 2020 & 2033
- Table 48: Global Mixer Grinder Industry Volume K Unit Forecast, by Country 2020 & 2033
Frequently Asked Questions
1. What is the projected Compound Annual Growth Rate (CAGR) of the Mixer Grinder Industry?
The projected CAGR is approximately 3.71%.
2. Which companies are prominent players in the Mixer Grinder Industry?
Key companies in the market include Panasonic, Whirlpool Corporation, LG, Havells, AB Electrolux, Bosch Global, Philips, Samsung, Haier Inc, Morphy Richards.
3. What are the main segments of the Mixer Grinder Industry?
The market segments include Product Type, Distribution Channel, End User.
4. Can you provide details about the market size?
The market size is estimated to be USD 14.69 Million as of 2022.
5. What are some drivers contributing to market growth?
Increasing Urbanization is Driving the Market; Increase in Usage of Smart Kitchen Appliances is Driving the Market.
6. What are the notable trends driving market growth?
E-commerce Emerges as a Fastest Growing Distribution Channel for Mixer Grinders.
7. Are there any restraints impacting market growth?
High Power Consumption.
8. Can you provide examples of recent developments in the market?
In April 2023, Bosch revealed plans to acquire the assets of TSI Semiconductors, including its Roseville, California campus. The acquisition was finalized on August 31, 2023, and the newly formed company will operate under the name Robert Bosch Semiconductor LLC.
9. What pricing options are available for accessing the report?
Pricing options include single-user, multi-user, and enterprise licenses priced at USD 4750, USD 5250, and USD 8750 respectively.
10. Is the market size provided in terms of value or volume?
The market size is provided in terms of value, measured in Million and volume, measured in K Unit.
11. Are there any specific market keywords associated with the report?
Yes, the market keyword associated with the report is "Mixer Grinder Industry," which aids in identifying and referencing the specific market segment covered.
12. How do I determine which pricing option suits my needs best?
The pricing options vary based on user requirements and access needs. Individual users may opt for single-user licenses, while businesses requiring broader access may choose multi-user or enterprise licenses for cost-effective access to the report.
13. Are there any additional resources or data provided in the Mixer Grinder Industry report?
While the report offers comprehensive insights, it's advisable to review the specific contents or supplementary materials provided to ascertain if additional resources or data are available.
14. How can I stay updated on further developments or reports in the Mixer Grinder Industry?
To stay informed about further developments, trends, and reports in the Mixer Grinder Industry, consider subscribing to industry newsletters, following relevant companies and organizations, or regularly checking reputable industry news sources and publications.
Methodology
Step 1 - Identification of Relevant Samples Size from Population Database


Step 2 - Approaches for Defining Global Market Size (Value, Volume* & Price*)

Note*: In applicable scenarios
Step 3 - Data Sources
Primary Research
- Web Analytics
- Survey Reports
- Research Institute
- Latest Research Reports
- Opinion Leaders
Secondary Research
- Annual Reports
- White Paper
- Latest Press Release
- Industry Association
- Paid Database
- Investor Presentations

Step 4 - Data Triangulation
Involves using different sources of information in order to increase the validity of a study
These sources are likely to be stakeholders in a program - participants, other researchers, program staff, other community members, and so on.
Then we put all data in single framework & apply various statistical tools to find out the dynamic on the market.
During the analysis stage, feedback from the stakeholder groups would be compared to determine areas of agreement as well as areas of divergence