

Key Insights
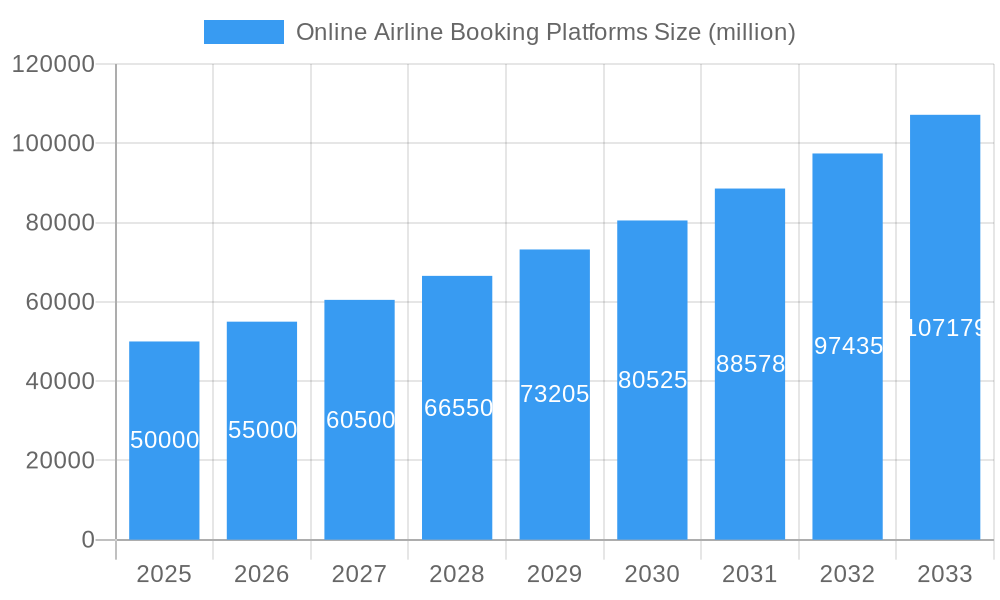
The online airline booking platform market is experiencing robust growth, driven by increasing internet penetration, the proliferation of smartphones, and a growing preference for convenient and cost-effective travel planning. The market, estimated at $50 billion in 2025, is projected to maintain a healthy Compound Annual Growth Rate (CAGR) of 10% from 2025 to 2033, reaching approximately $125 billion by 2033. This expansion is fueled by several key trends including the rise of mobile booking, the integration of advanced technologies like AI-powered personalized recommendations and chatbots, and the increasing adoption of ancillary revenue streams such as baggage fees and travel insurance sold directly through these platforms. Competition within the market is fierce, with established players like Booking Holdings, Expedia, and Ctrip vying for market share alongside smaller, more specialized platforms. However, the market's growth trajectory is not without its challenges. Increasing regulatory scrutiny, cybersecurity threats, and fluctuations in fuel prices and global economic conditions pose significant restraints on market expansion. The market is segmented by features such as booking functionality, pricing models, customer support features and geographical location of user base. Regional differences in market maturity and consumer behavior also influence the overall growth dynamics.
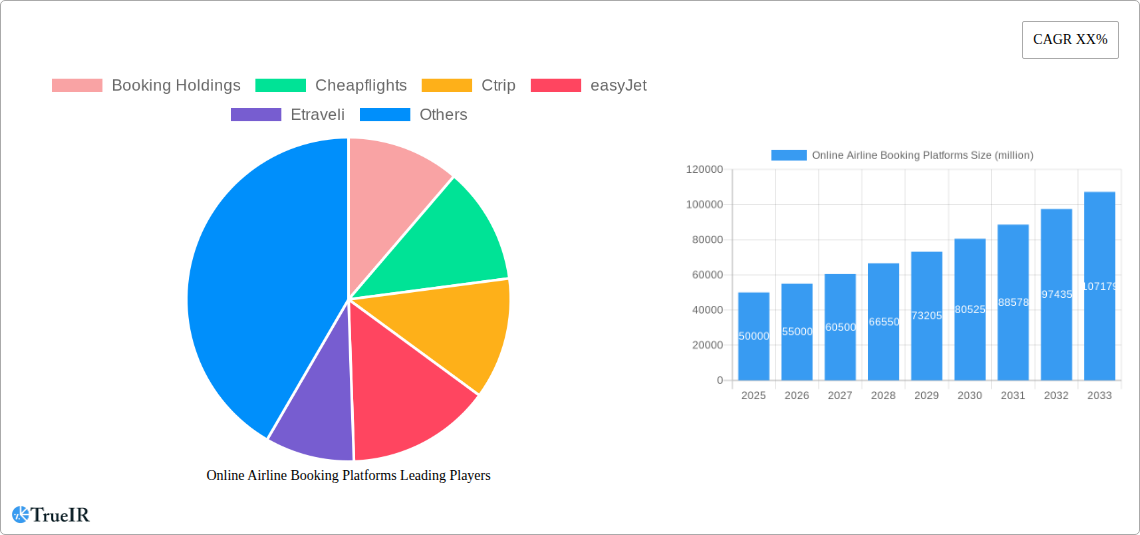
Online Airline Booking Platforms Market Size (In Billion)
The competitive landscape is marked by consolidation and diversification strategies. Larger players are actively acquiring smaller companies to expand their service offerings and geographical reach. Furthermore, many platforms are focusing on enhanced user experience through personalized recommendations, price comparison tools, and seamless integrations with other travel services like car rentals and hotel bookings. The shift towards mobile-first strategies is another defining trend. Companies are investing heavily in mobile app development and optimization to capture the growing segment of mobile users booking flights on the go. Future growth will be largely determined by the ability of these platforms to adapt to evolving consumer expectations, address security concerns, and leverage technological innovations to offer increasingly personalized and efficient booking experiences. Successfully navigating these factors will be crucial for sustained growth and profitability within this dynamic sector.
Online Airline Booking Platforms Company Market Share
Online Airline Booking Platforms Market Report: 2019-2033
This comprehensive report provides a detailed analysis of the global online airline booking platforms market, encompassing market structure, competitive landscape, trends, opportunities, and future outlook. The study period spans from 2019 to 2033, with 2025 serving as the base and estimated year. The forecast period covers 2025-2033, while the historical period encompasses 2019-2024. The report leverages extensive data analysis to provide valuable insights for industry stakeholders, investors, and businesses operating within this dynamic sector. The market is projected to reach xx million by 2033, demonstrating significant growth potential.
Online Airline Booking Platforms Market Structure & Competitive Landscape
The online airline booking platforms market exhibits a moderately concentrated structure, with a few major players commanding significant market share. The estimated market concentration ratio (CR4) in 2025 is xx%, indicating the presence of both established giants and emerging competitors. Innovation is a key driver, with companies continuously improving their platforms through AI-powered search functionalities, personalized recommendations, and enhanced mobile experiences. Regulatory impacts, particularly concerning data privacy and consumer protection, are significant factors. Product substitutes, such as directly booking through airlines, pose a competitive threat. The market is segmented by user type (leisure, business), booking channel (mobile, desktop), and geographical region. Mergers and acquisitions (M&A) activity has been significant in recent years, with an estimated volume of xx million in transactions between 2019 and 2024, leading to consolidation and increased market power for some players.
- Market Concentration: CR4 estimated at xx% in 2025.
- Innovation Drivers: AI-powered search, personalized recommendations, mobile optimization.
- Regulatory Impacts: Data privacy regulations, consumer protection laws.
- Product Substitutes: Direct airline bookings, metasearch engines.
- End-User Segmentation: Leisure travelers, business travelers.
- M&A Trends: xx million in transaction volume (2019-2024), leading to market consolidation.
Online Airline Booking Platforms Market Trends & Opportunities
The online airline booking platforms market is experiencing robust growth, driven by increasing internet penetration, the rise of mobile bookings, and a growing preference for convenient, cost-effective travel solutions. The market size is estimated at xx million in 2025, with a Compound Annual Growth Rate (CAGR) of xx% projected from 2025 to 2033. Technological advancements, such as AI-driven personalization and blockchain technology for secure transactions, are transforming the industry. Consumer preferences are shifting towards seamless user experiences, personalized offers, and transparent pricing. Competitive dynamics are marked by intense rivalry, innovation, and strategic partnerships. Market penetration rates vary across regions, with mature markets exhibiting higher penetration than emerging markets.
Dominant Markets & Segments in Online Airline Booking Platforms
The North American market currently dominates the online airline booking platforms sector, followed by Europe and Asia-Pacific. However, rapid growth is anticipated in emerging economies due to rising disposable incomes and increased internet connectivity.
- Key Growth Drivers in North America: Well-established travel infrastructure, high internet penetration, strong consumer spending.
- Key Growth Drivers in Europe: Large tourist market, well-developed transportation network, high adoption of online services.
- Key Growth Drivers in Asia-Pacific: Rapidly expanding middle class, increasing internet and smartphone penetration, government initiatives supporting tourism.
The business travel segment is expected to witness significant growth due to increasing corporate travel expenses and the demand for efficient booking solutions. The mobile booking segment is the fastest-growing channel, reflecting the widespread adoption of smartphones and mobile-first approaches.
Online Airline Booking Platforms Product Analysis
Online airline booking platforms are evolving rapidly, incorporating advanced technologies like AI to enhance search functionality, personalize recommendations, and optimize pricing strategies. These platforms offer features such as flight comparison tools, flexible booking options, integrated ancillary services (e.g., baggage, seat selection), and loyalty programs to increase user engagement and market fit. The competitive advantage lies in delivering a seamless, user-friendly experience that caters to the specific needs of diverse traveler segments.
Key Drivers, Barriers & Challenges in Online Airline Booking Platforms
Key Drivers: The increasing adoption of online travel booking, coupled with the rising popularity of smartphones and mobile apps, is a significant driver. Economic factors such as rising disposable incomes and increased affordability of air travel are contributing to market expansion. Government policies promoting tourism and easing travel restrictions have also positively impacted growth.
Challenges: Intense competition among existing players, the emergence of new entrants, and the constant need for technological innovation present significant challenges. Maintaining data security and ensuring consumer privacy in the face of evolving regulations pose significant challenges. The impact of global economic fluctuations and geopolitical events on travel patterns also remains a factor. Supply chain disruptions, such as those witnessed in recent years, can significantly impact operational efficiency and market stability. These disruptions could result in a xx million loss in revenue.
Growth Drivers in the Online Airline Booking Platforms Market
Technological advancements, such as the integration of artificial intelligence (AI) for personalized recommendations and price optimization, are driving market expansion. Economic factors, including rising disposable incomes and increased travel affordability, contribute significantly to growth. Supportive government policies that promote tourism and ease travel restrictions also play a crucial role.
Challenges Impacting Online Airline Booking Platforms Growth
Regulatory complexities related to data privacy and consumer protection are significant hurdles. Supply chain disruptions, such as those related to airline operations or global events, negatively impact the market. Intense competition among established players and new entrants also limits profit margins and growth potential.
Key Players Shaping the Online Airline Booking Platforms Market
- Booking Holdings
- Cheapflights
- Ctrip
- easyJet
- Etraveli
- Expedia
- iGola
- Kiwi.com s.r.o.
- Lastminute
- momondo
- Orbitz
- Qunar
- Rakuten
- Travix International
- Yahoo
Significant Online Airline Booking Platforms Industry Milestones
- 2020: Significant increase in mobile bookings due to the pandemic.
- 2021: Several platforms integrated advanced AI features for personalized travel recommendations.
- 2022: Increased focus on sustainable travel options, with many platforms promoting eco-friendly airlines and travel choices.
- 2023: Several mergers and acquisitions reshape the competitive landscape.
Future Outlook for Online Airline Booking Platforms Market
The future of the online airline booking platforms market is promising, fueled by technological advancements, evolving consumer preferences, and increasing market penetration in emerging economies. Strategic opportunities exist for platforms that can leverage AI and big data to personalize user experiences and optimize pricing strategies, those that focus on delivering sustainable travel solutions, and those that effectively navigate the evolving regulatory landscape. The market is expected to continue its strong growth trajectory, driven by the factors discussed above, presenting significant potential for innovation and market expansion.
Online Airline Booking Platforms Segmentation
-
1. Application
- 1.1. International Airline Booking
- 1.2. Domestic Airline Booking
-
2. Types
- 2.1. OTA
- 2.2. Tickets Comparison Engine
Online Airline Booking Platforms Segmentation By Geography
-
1. North America
- 1.1. United States
- 1.2. Canada
- 1.3. Mexico
-
2. South America
- 2.1. Brazil
- 2.2. Argentina
- 2.3. Rest of South America
-
3. Europe
- 3.1. United Kingdom
- 3.2. Germany
- 3.3. France
- 3.4. Italy
- 3.5. Spain
- 3.6. Russia
- 3.7. Benelux
- 3.8. Nordics
- 3.9. Rest of Europe
-
4. Middle East & Africa
- 4.1. Turkey
- 4.2. Israel
- 4.3. GCC
- 4.4. North Africa
- 4.5. South Africa
- 4.6. Rest of Middle East & Africa
-
5. Asia Pacific
- 5.1. China
- 5.2. India
- 5.3. Japan
- 5.4. South Korea
- 5.5. ASEAN
- 5.6. Oceania
- 5.7. Rest of Asia Pacific

Online Airline Booking Platforms Regional Market Share
Geographic Coverage of Online Airline Booking Platforms
Online Airline Booking Platforms REPORT HIGHLIGHTS
| Aspects | Details |
|---|---|
| Study Period | 2020-2034 |
| Base Year | 2025 |
| Estimated Year | 2026 |
| Forecast Period | 2026-2034 |
| Historical Period | 2020-2025 |
| Growth Rate | CAGR of 7.5% from 2020-2034 |
| Segmentation |
|
Table of Contents
- 1. Introduction
- 1.1. Research Scope
- 1.2. Market Segmentation
- 1.3. Research Methodology
- 1.4. Definitions and Assumptions
- 2. Executive Summary
- 2.1. Introduction
- 3. Market Dynamics
- 3.1. Introduction
- 3.2. Market Drivers
- 3.3. Market Restrains
- 3.4. Market Trends
- 4. Market Factor Analysis
- 4.1. Porters Five Forces
- 4.2. Supply/Value Chain
- 4.3. PESTEL analysis
- 4.4. Market Entropy
- 4.5. Patent/Trademark Analysis
- 5. Global Online Airline Booking Platforms Analysis, Insights and Forecast, 2020-2032
- 5.1. Market Analysis, Insights and Forecast - by Application
- 5.1.1. International Airline Booking
- 5.1.2. Domestic Airline Booking
- 5.2. Market Analysis, Insights and Forecast - by Types
- 5.2.1. OTA
- 5.2.2. Tickets Comparison Engine
- 5.3. Market Analysis, Insights and Forecast - by Region
- 5.3.1. North America
- 5.3.2. South America
- 5.3.3. Europe
- 5.3.4. Middle East & Africa
- 5.3.5. Asia Pacific
- 5.1. Market Analysis, Insights and Forecast - by Application
- 6. North America Online Airline Booking Platforms Analysis, Insights and Forecast, 2020-2032
- 6.1. Market Analysis, Insights and Forecast - by Application
- 6.1.1. International Airline Booking
- 6.1.2. Domestic Airline Booking
- 6.2. Market Analysis, Insights and Forecast - by Types
- 6.2.1. OTA
- 6.2.2. Tickets Comparison Engine
- 6.1. Market Analysis, Insights and Forecast - by Application
- 7. South America Online Airline Booking Platforms Analysis, Insights and Forecast, 2020-2032
- 7.1. Market Analysis, Insights and Forecast - by Application
- 7.1.1. International Airline Booking
- 7.1.2. Domestic Airline Booking
- 7.2. Market Analysis, Insights and Forecast - by Types
- 7.2.1. OTA
- 7.2.2. Tickets Comparison Engine
- 7.1. Market Analysis, Insights and Forecast - by Application
- 8. Europe Online Airline Booking Platforms Analysis, Insights and Forecast, 2020-2032
- 8.1. Market Analysis, Insights and Forecast - by Application
- 8.1.1. International Airline Booking
- 8.1.2. Domestic Airline Booking
- 8.2. Market Analysis, Insights and Forecast - by Types
- 8.2.1. OTA
- 8.2.2. Tickets Comparison Engine
- 8.1. Market Analysis, Insights and Forecast - by Application
- 9. Middle East & Africa Online Airline Booking Platforms Analysis, Insights and Forecast, 2020-2032
- 9.1. Market Analysis, Insights and Forecast - by Application
- 9.1.1. International Airline Booking
- 9.1.2. Domestic Airline Booking
- 9.2. Market Analysis, Insights and Forecast - by Types
- 9.2.1. OTA
- 9.2.2. Tickets Comparison Engine
- 9.1. Market Analysis, Insights and Forecast - by Application
- 10. Asia Pacific Online Airline Booking Platforms Analysis, Insights and Forecast, 2020-2032
- 10.1. Market Analysis, Insights and Forecast - by Application
- 10.1.1. International Airline Booking
- 10.1.2. Domestic Airline Booking
- 10.2. Market Analysis, Insights and Forecast - by Types
- 10.2.1. OTA
- 10.2.2. Tickets Comparison Engine
- 10.1. Market Analysis, Insights and Forecast - by Application
- 11. Competitive Analysis
- 11.1. Global Market Share Analysis 2025
- 11.2. Company Profiles
- 11.2.1 Booking Holdings
- 11.2.1.1. Overview
- 11.2.1.2. Products
- 11.2.1.3. SWOT Analysis
- 11.2.1.4. Recent Developments
- 11.2.1.5. Financials (Based on Availability)
- 11.2.2 Cheapflights
- 11.2.2.1. Overview
- 11.2.2.2. Products
- 11.2.2.3. SWOT Analysis
- 11.2.2.4. Recent Developments
- 11.2.2.5. Financials (Based on Availability)
- 11.2.3 Ctrip
- 11.2.3.1. Overview
- 11.2.3.2. Products
- 11.2.3.3. SWOT Analysis
- 11.2.3.4. Recent Developments
- 11.2.3.5. Financials (Based on Availability)
- 11.2.4 easyJet
- 11.2.4.1. Overview
- 11.2.4.2. Products
- 11.2.4.3. SWOT Analysis
- 11.2.4.4. Recent Developments
- 11.2.4.5. Financials (Based on Availability)
- 11.2.5 Etraveli
- 11.2.5.1. Overview
- 11.2.5.2. Products
- 11.2.5.3. SWOT Analysis
- 11.2.5.4. Recent Developments
- 11.2.5.5. Financials (Based on Availability)
- 11.2.6 Expedia
- 11.2.6.1. Overview
- 11.2.6.2. Products
- 11.2.6.3. SWOT Analysis
- 11.2.6.4. Recent Developments
- 11.2.6.5. Financials (Based on Availability)
- 11.2.7 iGola
- 11.2.7.1. Overview
- 11.2.7.2. Products
- 11.2.7.3. SWOT Analysis
- 11.2.7.4. Recent Developments
- 11.2.7.5. Financials (Based on Availability)
- 11.2.8 Kiwi.com s.r.o.
- 11.2.8.1. Overview
- 11.2.8.2. Products
- 11.2.8.3. SWOT Analysis
- 11.2.8.4. Recent Developments
- 11.2.8.5. Financials (Based on Availability)
- 11.2.9 Lastminute
- 11.2.9.1. Overview
- 11.2.9.2. Products
- 11.2.9.3. SWOT Analysis
- 11.2.9.4. Recent Developments
- 11.2.9.5. Financials (Based on Availability)
- 11.2.10 momondo
- 11.2.10.1. Overview
- 11.2.10.2. Products
- 11.2.10.3. SWOT Analysis
- 11.2.10.4. Recent Developments
- 11.2.10.5. Financials (Based on Availability)
- 11.2.11 Orbitz
- 11.2.11.1. Overview
- 11.2.11.2. Products
- 11.2.11.3. SWOT Analysis
- 11.2.11.4. Recent Developments
- 11.2.11.5. Financials (Based on Availability)
- 11.2.12 Qunar
- 11.2.12.1. Overview
- 11.2.12.2. Products
- 11.2.12.3. SWOT Analysis
- 11.2.12.4. Recent Developments
- 11.2.12.5. Financials (Based on Availability)
- 11.2.13 Rakuten
- 11.2.13.1. Overview
- 11.2.13.2. Products
- 11.2.13.3. SWOT Analysis
- 11.2.13.4. Recent Developments
- 11.2.13.5. Financials (Based on Availability)
- 11.2.14 Travix International
- 11.2.14.1. Overview
- 11.2.14.2. Products
- 11.2.14.3. SWOT Analysis
- 11.2.14.4. Recent Developments
- 11.2.14.5. Financials (Based on Availability)
- 11.2.15 Yahoo
- 11.2.15.1. Overview
- 11.2.15.2. Products
- 11.2.15.3. SWOT Analysis
- 11.2.15.4. Recent Developments
- 11.2.15.5. Financials (Based on Availability)
- 11.2.1 Booking Holdings
List of Figures
- Figure 1: Global Online Airline Booking Platforms Revenue Breakdown (undefined, %) by Region 2025 & 2033
- Figure 2: North America Online Airline Booking Platforms Revenue (undefined), by Application 2025 & 2033
- Figure 3: North America Online Airline Booking Platforms Revenue Share (%), by Application 2025 & 2033
- Figure 4: North America Online Airline Booking Platforms Revenue (undefined), by Types 2025 & 2033
- Figure 5: North America Online Airline Booking Platforms Revenue Share (%), by Types 2025 & 2033
- Figure 6: North America Online Airline Booking Platforms Revenue (undefined), by Country 2025 & 2033
- Figure 7: North America Online Airline Booking Platforms Revenue Share (%), by Country 2025 & 2033
- Figure 8: South America Online Airline Booking Platforms Revenue (undefined), by Application 2025 & 2033
- Figure 9: South America Online Airline Booking Platforms Revenue Share (%), by Application 2025 & 2033
- Figure 10: South America Online Airline Booking Platforms Revenue (undefined), by Types 2025 & 2033
- Figure 11: South America Online Airline Booking Platforms Revenue Share (%), by Types 2025 & 2033
- Figure 12: South America Online Airline Booking Platforms Revenue (undefined), by Country 2025 & 2033
- Figure 13: South America Online Airline Booking Platforms Revenue Share (%), by Country 2025 & 2033
- Figure 14: Europe Online Airline Booking Platforms Revenue (undefined), by Application 2025 & 2033
- Figure 15: Europe Online Airline Booking Platforms Revenue Share (%), by Application 2025 & 2033
- Figure 16: Europe Online Airline Booking Platforms Revenue (undefined), by Types 2025 & 2033
- Figure 17: Europe Online Airline Booking Platforms Revenue Share (%), by Types 2025 & 2033
- Figure 18: Europe Online Airline Booking Platforms Revenue (undefined), by Country 2025 & 2033
- Figure 19: Europe Online Airline Booking Platforms Revenue Share (%), by Country 2025 & 2033
- Figure 20: Middle East & Africa Online Airline Booking Platforms Revenue (undefined), by Application 2025 & 2033
- Figure 21: Middle East & Africa Online Airline Booking Platforms Revenue Share (%), by Application 2025 & 2033
- Figure 22: Middle East & Africa Online Airline Booking Platforms Revenue (undefined), by Types 2025 & 2033
- Figure 23: Middle East & Africa Online Airline Booking Platforms Revenue Share (%), by Types 2025 & 2033
- Figure 24: Middle East & Africa Online Airline Booking Platforms Revenue (undefined), by Country 2025 & 2033
- Figure 25: Middle East & Africa Online Airline Booking Platforms Revenue Share (%), by Country 2025 & 2033
- Figure 26: Asia Pacific Online Airline Booking Platforms Revenue (undefined), by Application 2025 & 2033
- Figure 27: Asia Pacific Online Airline Booking Platforms Revenue Share (%), by Application 2025 & 2033
- Figure 28: Asia Pacific Online Airline Booking Platforms Revenue (undefined), by Types 2025 & 2033
- Figure 29: Asia Pacific Online Airline Booking Platforms Revenue Share (%), by Types 2025 & 2033
- Figure 30: Asia Pacific Online Airline Booking Platforms Revenue (undefined), by Country 2025 & 2033
- Figure 31: Asia Pacific Online Airline Booking Platforms Revenue Share (%), by Country 2025 & 2033
List of Tables
- Table 1: Global Online Airline Booking Platforms Revenue undefined Forecast, by Application 2020 & 2033
- Table 2: Global Online Airline Booking Platforms Revenue undefined Forecast, by Types 2020 & 2033
- Table 3: Global Online Airline Booking Platforms Revenue undefined Forecast, by Region 2020 & 2033
- Table 4: Global Online Airline Booking Platforms Revenue undefined Forecast, by Application 2020 & 2033
- Table 5: Global Online Airline Booking Platforms Revenue undefined Forecast, by Types 2020 & 2033
- Table 6: Global Online Airline Booking Platforms Revenue undefined Forecast, by Country 2020 & 2033
- Table 7: United States Online Airline Booking Platforms Revenue (undefined) Forecast, by Application 2020 & 2033
- Table 8: Canada Online Airline Booking Platforms Revenue (undefined) Forecast, by Application 2020 & 2033
- Table 9: Mexico Online Airline Booking Platforms Revenue (undefined) Forecast, by Application 2020 & 2033
- Table 10: Global Online Airline Booking Platforms Revenue undefined Forecast, by Application 2020 & 2033
- Table 11: Global Online Airline Booking Platforms Revenue undefined Forecast, by Types 2020 & 2033
- Table 12: Global Online Airline Booking Platforms Revenue undefined Forecast, by Country 2020 & 2033
- Table 13: Brazil Online Airline Booking Platforms Revenue (undefined) Forecast, by Application 2020 & 2033
- Table 14: Argentina Online Airline Booking Platforms Revenue (undefined) Forecast, by Application 2020 & 2033
- Table 15: Rest of South America Online Airline Booking Platforms Revenue (undefined) Forecast, by Application 2020 & 2033
- Table 16: Global Online Airline Booking Platforms Revenue undefined Forecast, by Application 2020 & 2033
- Table 17: Global Online Airline Booking Platforms Revenue undefined Forecast, by Types 2020 & 2033
- Table 18: Global Online Airline Booking Platforms Revenue undefined Forecast, by Country 2020 & 2033
- Table 19: United Kingdom Online Airline Booking Platforms Revenue (undefined) Forecast, by Application 2020 & 2033
- Table 20: Germany Online Airline Booking Platforms Revenue (undefined) Forecast, by Application 2020 & 2033
- Table 21: France Online Airline Booking Platforms Revenue (undefined) Forecast, by Application 2020 & 2033
- Table 22: Italy Online Airline Booking Platforms Revenue (undefined) Forecast, by Application 2020 & 2033
- Table 23: Spain Online Airline Booking Platforms Revenue (undefined) Forecast, by Application 2020 & 2033
- Table 24: Russia Online Airline Booking Platforms Revenue (undefined) Forecast, by Application 2020 & 2033
- Table 25: Benelux Online Airline Booking Platforms Revenue (undefined) Forecast, by Application 2020 & 2033
- Table 26: Nordics Online Airline Booking Platforms Revenue (undefined) Forecast, by Application 2020 & 2033
- Table 27: Rest of Europe Online Airline Booking Platforms Revenue (undefined) Forecast, by Application 2020 & 2033
- Table 28: Global Online Airline Booking Platforms Revenue undefined Forecast, by Application 2020 & 2033
- Table 29: Global Online Airline Booking Platforms Revenue undefined Forecast, by Types 2020 & 2033
- Table 30: Global Online Airline Booking Platforms Revenue undefined Forecast, by Country 2020 & 2033
- Table 31: Turkey Online Airline Booking Platforms Revenue (undefined) Forecast, by Application 2020 & 2033
- Table 32: Israel Online Airline Booking Platforms Revenue (undefined) Forecast, by Application 2020 & 2033
- Table 33: GCC Online Airline Booking Platforms Revenue (undefined) Forecast, by Application 2020 & 2033
- Table 34: North Africa Online Airline Booking Platforms Revenue (undefined) Forecast, by Application 2020 & 2033
- Table 35: South Africa Online Airline Booking Platforms Revenue (undefined) Forecast, by Application 2020 & 2033
- Table 36: Rest of Middle East & Africa Online Airline Booking Platforms Revenue (undefined) Forecast, by Application 2020 & 2033
- Table 37: Global Online Airline Booking Platforms Revenue undefined Forecast, by Application 2020 & 2033
- Table 38: Global Online Airline Booking Platforms Revenue undefined Forecast, by Types 2020 & 2033
- Table 39: Global Online Airline Booking Platforms Revenue undefined Forecast, by Country 2020 & 2033
- Table 40: China Online Airline Booking Platforms Revenue (undefined) Forecast, by Application 2020 & 2033
- Table 41: India Online Airline Booking Platforms Revenue (undefined) Forecast, by Application 2020 & 2033
- Table 42: Japan Online Airline Booking Platforms Revenue (undefined) Forecast, by Application 2020 & 2033
- Table 43: South Korea Online Airline Booking Platforms Revenue (undefined) Forecast, by Application 2020 & 2033
- Table 44: ASEAN Online Airline Booking Platforms Revenue (undefined) Forecast, by Application 2020 & 2033
- Table 45: Oceania Online Airline Booking Platforms Revenue (undefined) Forecast, by Application 2020 & 2033
- Table 46: Rest of Asia Pacific Online Airline Booking Platforms Revenue (undefined) Forecast, by Application 2020 & 2033
Frequently Asked Questions
1. What is the projected Compound Annual Growth Rate (CAGR) of the Online Airline Booking Platforms?
The projected CAGR is approximately 7.5%.
2. Which companies are prominent players in the Online Airline Booking Platforms?
Key companies in the market include Booking Holdings, Cheapflights, Ctrip, easyJet, Etraveli, Expedia, iGola, Kiwi.com s.r.o., Lastminute, momondo, Orbitz, Qunar, Rakuten, Travix International, Yahoo.
3. What are the main segments of the Online Airline Booking Platforms?
The market segments include Application, Types.
4. Can you provide details about the market size?
The market size is estimated to be USD XXX N/A as of 2022.
5. What are some drivers contributing to market growth?
N/A
6. What are the notable trends driving market growth?
N/A
7. Are there any restraints impacting market growth?
N/A
8. Can you provide examples of recent developments in the market?
N/A
9. What pricing options are available for accessing the report?
Pricing options include single-user, multi-user, and enterprise licenses priced at USD 3350.00, USD 5025.00, and USD 6700.00 respectively.
10. Is the market size provided in terms of value or volume?
The market size is provided in terms of value, measured in N/A.
11. Are there any specific market keywords associated with the report?
Yes, the market keyword associated with the report is "Online Airline Booking Platforms," which aids in identifying and referencing the specific market segment covered.
12. How do I determine which pricing option suits my needs best?
The pricing options vary based on user requirements and access needs. Individual users may opt for single-user licenses, while businesses requiring broader access may choose multi-user or enterprise licenses for cost-effective access to the report.
13. Are there any additional resources or data provided in the Online Airline Booking Platforms report?
While the report offers comprehensive insights, it's advisable to review the specific contents or supplementary materials provided to ascertain if additional resources or data are available.
14. How can I stay updated on further developments or reports in the Online Airline Booking Platforms?
To stay informed about further developments, trends, and reports in the Online Airline Booking Platforms, consider subscribing to industry newsletters, following relevant companies and organizations, or regularly checking reputable industry news sources and publications.
Methodology
Step 1 - Identification of Relevant Samples Size from Population Database


Step 2 - Approaches for Defining Global Market Size (Value, Volume* & Price*)

Note*: In applicable scenarios
Step 3 - Data Sources
Primary Research
- Web Analytics
- Survey Reports
- Research Institute
- Latest Research Reports
- Opinion Leaders
Secondary Research
- Annual Reports
- White Paper
- Latest Press Release
- Industry Association
- Paid Database
- Investor Presentations

Step 4 - Data Triangulation
Involves using different sources of information in order to increase the validity of a study
These sources are likely to be stakeholders in a program - participants, other researchers, program staff, other community members, and so on.
Then we put all data in single framework & apply various statistical tools to find out the dynamic on the market.
During the analysis stage, feedback from the stakeholder groups would be compared to determine areas of agreement as well as areas of divergence