

Key Insights
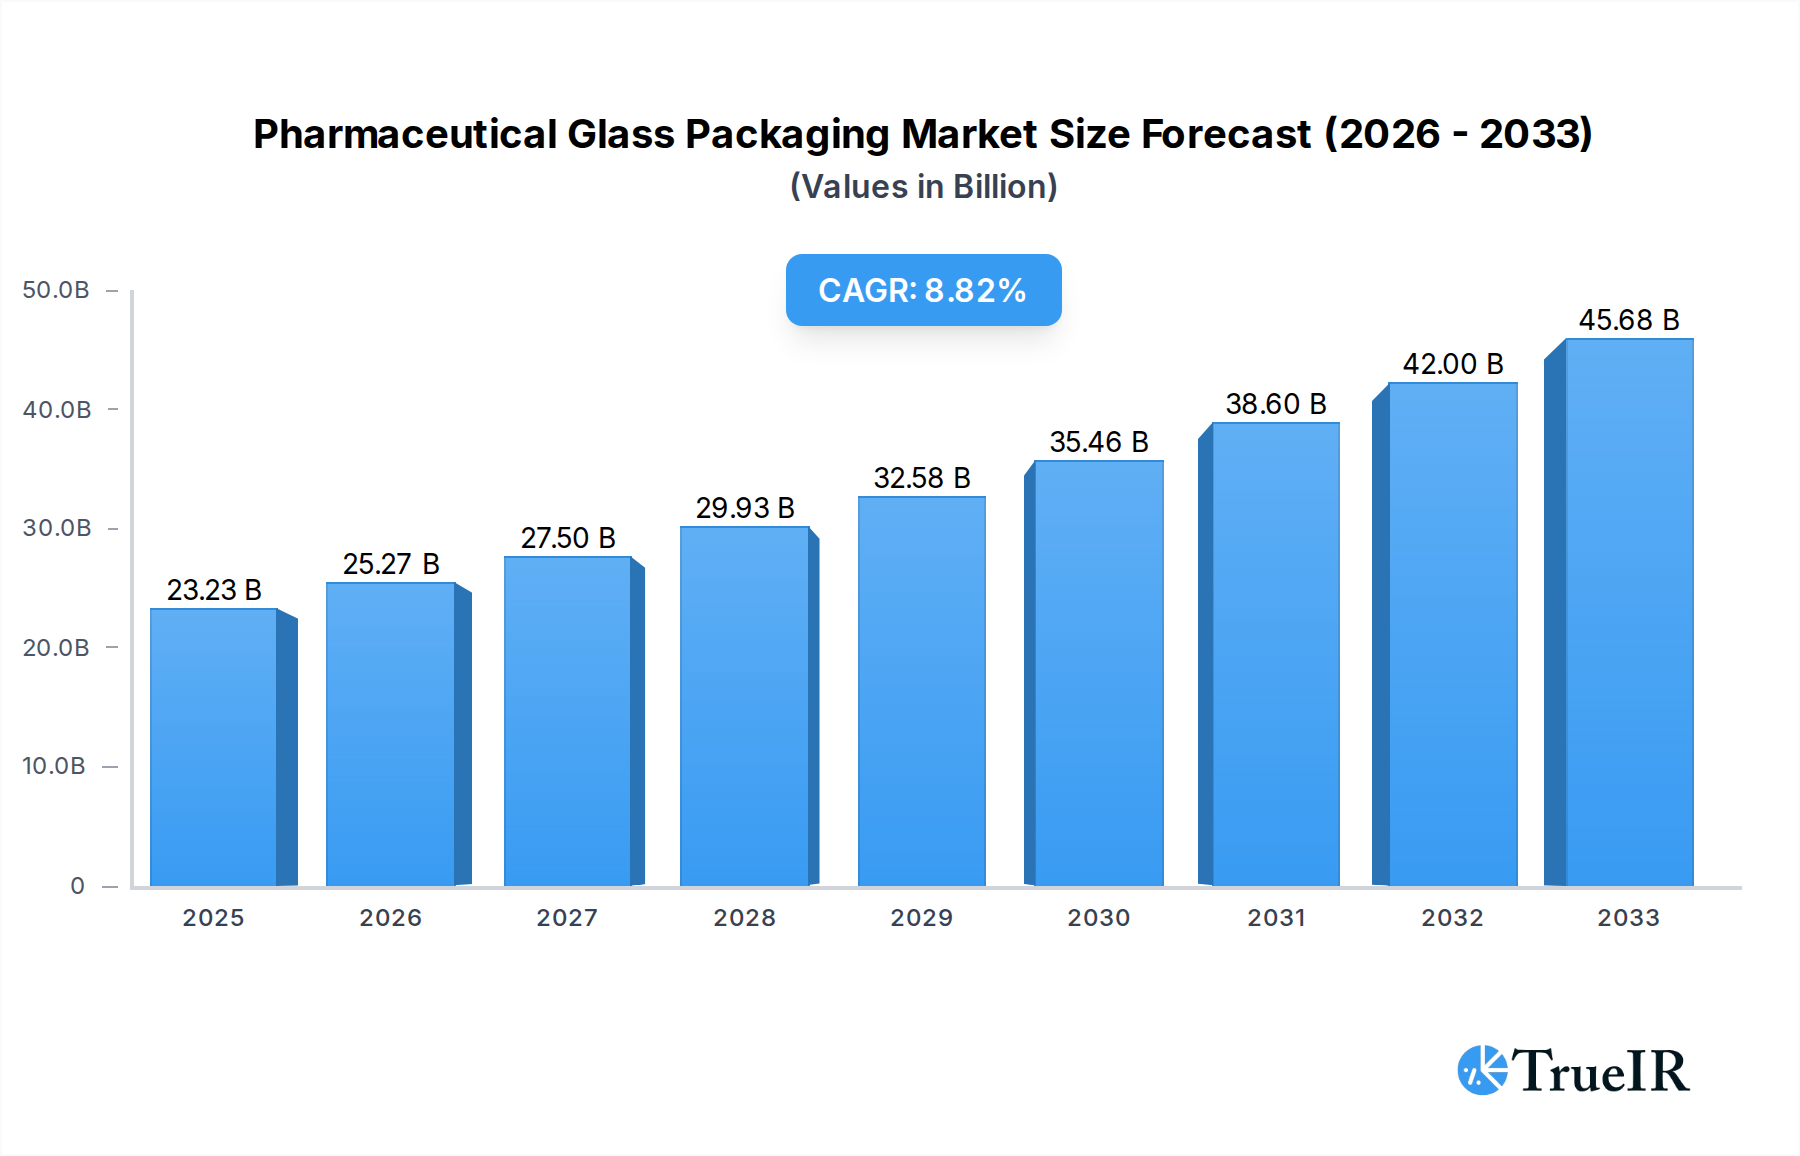
The global pharmaceutical glass packaging market is poised for significant expansion, projected to reach an estimated $23.23 billion in 2025. This robust growth is underpinned by a Compound Annual Growth Rate (CAGR) of 8.8% over the forecast period of 2025-2033, indicating a dynamic and expanding industry. The primary drivers fueling this surge include the escalating demand for safe, sterile, and inert packaging solutions for a wide array of pharmaceutical products, particularly injectables. The increasing prevalence of chronic diseases worldwide, coupled with advancements in drug delivery systems and a growing emphasis on patient safety, are all contributing factors. Furthermore, the inherent advantages of glass, such as its impermeability to gases and moisture, and its resistance to chemical reactions, make it the preferred choice for preserving the integrity and efficacy of sensitive medications. Innovations in glass formulations and manufacturing processes are also enhancing product quality and expanding application possibilities.

Pharmaceutical Glass Packaging Market Size (In Billion)
The market is segmented by application into Injectable, Transfusion, and Other categories, with Injectables representing a dominant segment due to their critical role in drug delivery. By type, the market includes Medium Borosilicate Glass Tubes, Glass Tube Injection Bottles, Ampoules, Cartridges, Prefilled Syringes, and Others. Prefilled syringes, in particular, are experiencing considerable growth due to their convenience, reduced risk of medication errors, and improved patient compliance. Key players such as Gerresheimer, Nipro, Schott, and SGD are at the forefront of innovation, investing in research and development to meet the evolving needs of the pharmaceutical industry. While the market demonstrates strong growth, potential restraints such as the cost of raw materials and increasing competition from alternative packaging materials are factors that will need to be managed by industry participants. However, the overarching trend towards premiumization in healthcare and the non-negotiable requirement for product integrity in pharmaceuticals suggest a continued upward trajectory for glass packaging.
Pharmaceutical Glass Packaging Company Market Share
Unlocking Growth: A Comprehensive Report on the Pharmaceutical Glass Packaging Market (2019-2033)
This in-depth market research report provides an exhaustive analysis of the global Pharmaceutical Glass Packaging market, projecting significant growth and identifying key opportunities. Covering the period from 2019 to 2033, with a base and estimated year of 2025, this report is an indispensable tool for stakeholders seeking to navigate this dynamic sector. We delve into market structure, trends, dominant segments, product innovations, growth drivers, challenges, and key players, offering actionable insights for strategic decision-making.
Pharmaceutical Glass Packaging Market Structure & Competitive Landscape
The pharmaceutical glass packaging market exhibits a moderately concentrated structure, with key players like Gerresheimer, Nipro, Schott, and SGD holding significant market share. Innovation drivers are primarily focused on enhanced drug stability, patient safety, and advanced delivery systems, leading to a growing demand for specialized glass types such as Type I borosilicate glass for sensitive biologics and injectable formulations. Regulatory impacts, particularly stringent Good Manufacturing Practices (GMP) and evolving pharmacopoeial standards, necessitate continuous investment in quality control and advanced manufacturing processes. Product substitutes, including high-barrier plastics and advanced polymer-based solutions, present a competitive challenge, yet glass packaging retains its dominance due to its inertness, impermeability, and chemical resistance, crucial for maintaining drug integrity. End-user segmentation reveals a strong reliance on the pharmaceutical industry, with a significant portion of demand stemming from injectable and transfusion applications. Merger and acquisition (M&A) trends indicate strategic consolidation, with an estimated volume of over 5 billion USD in M&A activities observed within the historical period (2019-2024), aiming to expand product portfolios, geographical reach, and technological capabilities. The market concentration ratio for the top 5 players is estimated to be around 65 billion.
Pharmaceutical Glass Packaging Market Trends & Opportunities
The global Pharmaceutical Glass Packaging market is poised for robust expansion, driven by a confluence of factors that underscore its enduring importance in drug delivery and patient safety. The market size is projected to reach an astounding 80 billion by 2033, exhibiting a Compound Annual Growth Rate (CAGR) of approximately 6.5% over the forecast period (2025-2033). This significant growth trajectory is fueled by several key trends. Firstly, the escalating prevalence of chronic diseases and an aging global population directly translate to an increased demand for pharmaceutical products, particularly injectables and biologics, where glass packaging offers superior protection and stability. Technological shifts are also playing a pivotal role, with advancements in glass manufacturing enabling the production of lighter, stronger, and more dimensionally precise vials, ampoules, and cartridges. The development of advanced coatings for enhanced drug compatibility and reduced leachables further solidifies glass’s position. Consumer preferences, while increasingly influenced by convenience, still prioritize safety and efficacy, especially for critical medications, thus favoring the proven reliability of glass. The competitive landscape is characterized by continuous innovation in product design and manufacturing efficiency. Companies are investing heavily in R&D to develop specialized glass solutions for novel drug formulations, including complex biologics and gene therapies. The growing emphasis on sustainability within the pharmaceutical industry is also driving innovation in recycling processes and the development of eco-friendlier glass manufacturing techniques. Market penetration rates for prefilled syringes, a segment experiencing rapid growth, are expected to exceed 70% in key therapeutic areas by 2030. Furthermore, the expanding healthcare infrastructure in emerging economies is opening up new avenues for market growth. The increasing complexity of drug molecules and the need for precise dosage delivery are further reinforcing the demand for high-quality pharmaceutical glass packaging. The market is witnessing a steady rise in the adoption of specialized glass types, such as Type I borosilicate glass, which offers exceptional chemical resistance and thermal shock resistance, making it ideal for a wide range of pharmaceutical applications, including the packaging of sensitive vaccines and biopharmaceuticals. The increasing demand for personalized medicine and advanced therapeutic modalities also presents significant opportunities for customized glass packaging solutions that can accommodate unique drug delivery devices and formulations. The global market size for pharmaceutical glass packaging in the base year 2025 is estimated at 50 billion.
Dominant Markets & Segments in Pharmaceutical Glass Packaging
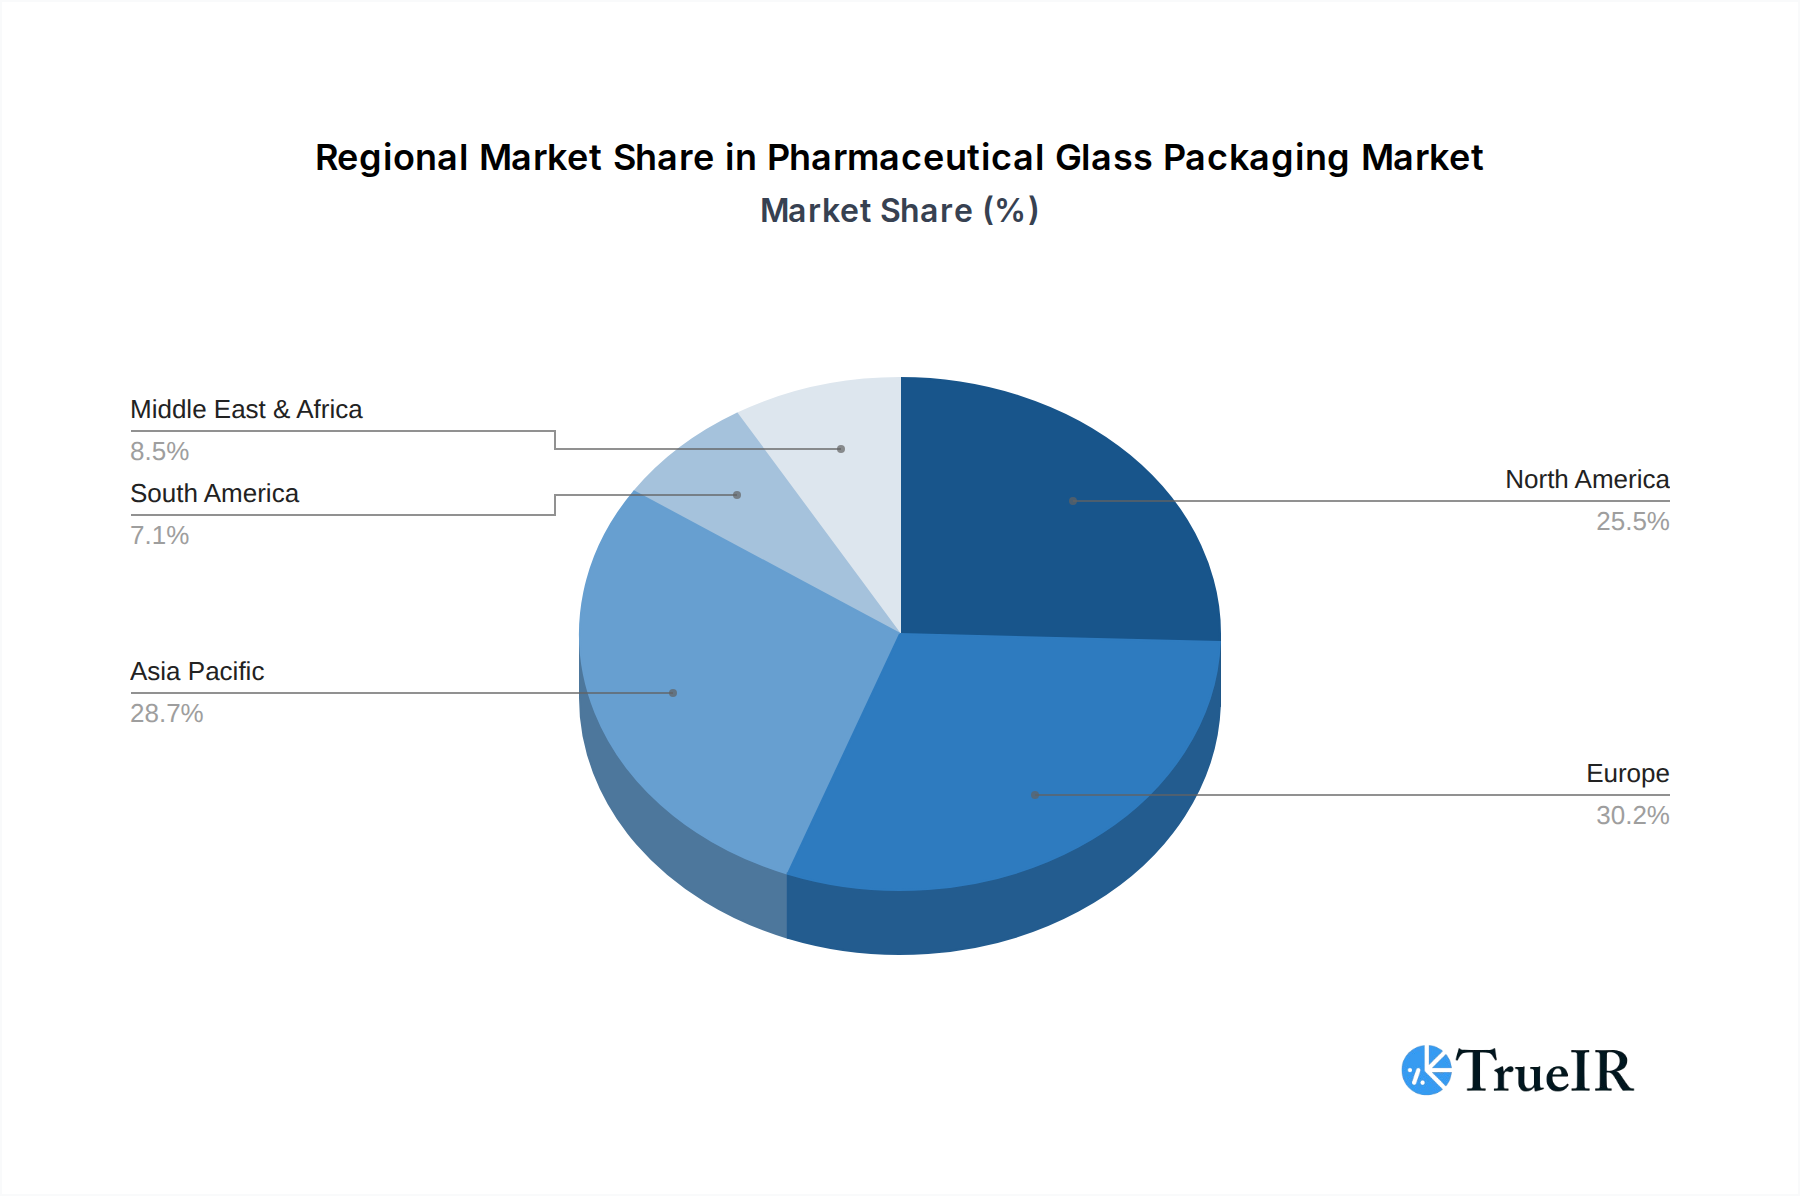
The pharmaceutical glass packaging market's dominance is a complex interplay of regional strengths, application demands, and product innovation. Regionally, North America and Europe currently lead the market, driven by well-established pharmaceutical industries, robust R&D investments, and stringent regulatory frameworks that prioritize product safety and efficacy. However, the Asia-Pacific region is emerging as a significant growth engine, propelled by expanding healthcare infrastructure, a burgeoning generic drug market, and increasing domestic pharmaceutical manufacturing capabilities, with China and India at the forefront of this expansion. The application segment of Injectable products reigns supreme, accounting for an estimated 60 billion of the market share by 2025. This dominance is attributed to the increasing prevalence of diseases requiring parenteral administration, the growth of the biologics and biosimilars market, and the inherent requirement for sterile and inert packaging for injectable drugs. The Prefilled Syringe type is experiencing remarkable growth within the injectable segment, with market penetration projected to exceed 70% by 2030. This surge is driven by the demand for convenience, reduced risk of medication errors, and improved patient compliance. Key growth drivers in this segment include the development of advanced drug formulations and the increasing focus on patient-centric drug delivery systems. The growth of the Medium Borosilicate Glass Tube segment is intrinsically linked to the production of vials, ampoules, and cartridges, serving as the foundational material for these critical packaging formats. Its widespread use stems from its excellent balance of chemical resistance and thermal properties, making it suitable for a broad spectrum of pharmaceutical products. The Glass Tube Injection Bottle segment, while mature, continues to hold a substantial market share due to its established reliability and cost-effectiveness for a wide range of injectable medications. The Ampoule segment, particularly for single-dose sterile injectables and certain sensitive compounds, remains vital, driven by its hermetic sealing capabilities and inert nature. Emerging markets are showing increased adoption of these formats as their pharmaceutical industries mature and regulatory standards align with global benchmarks. The Other application segment, encompassing ophthalmic solutions, oral liquids, and diagnostic kits, also contributes significantly, albeit with a smaller market share compared to injectables. The Other types segment, which includes specialized containers for specific drug delivery devices or unique formulations, is expected to witness steady growth as pharmaceutical innovation continues.
Pharmaceutical Glass Packaging Product Analysis
Pharmaceutical glass packaging products are characterized by continuous innovation focused on enhancing drug stability, safety, and user convenience. Key advancements include the development of advanced Type I borosilicate glass with superior hydrolytic resistance, crucial for sensitive biologics and cytotoxic drugs, minimizing drug-product interactions and leachables. The rise of prefilled syringes, requiring precise glass barrel manufacturing and advanced plunger seals, exemplifies the trend towards ready-to-use drug delivery systems, significantly improving patient compliance and reducing administration errors. Furthermore, specialized coatings and treatments are being applied to glass surfaces to improve compatibility with various drug formulations and to offer tamper-evident features. The competitive advantage lies in glass's inherent inertness, impermeability, and its ability to withstand sterilization processes without degradation, ensuring the integrity and efficacy of pharmaceutical products across their shelf life.
Key Drivers, Barriers & Challenges in Pharmaceutical Glass Packaging
Key Drivers: The pharmaceutical glass packaging market is propelled by several critical drivers. Technological advancements in glass manufacturing, including precision molding and enhanced material purity, enable the production of safer and more reliable packaging. The escalating global demand for pharmaceuticals, fueled by aging populations and the rise of chronic diseases, directly translates to increased packaging needs. Stringent regulatory requirements by bodies like the FDA and EMA, which mandate high standards for drug packaging integrity and safety, favor the inert and protective properties of glass. The growing market for biologics and vaccines, which require exceptionally stable and inert packaging, further bolsters demand.
Key Barriers & Challenges: Despite strong growth, the market faces significant challenges. Supply chain disruptions, particularly those impacting raw material availability and logistics, can lead to production delays and increased costs. Fluctuations in raw material prices, such as soda ash and silica, can impact profitability. While glass offers advantages, the development of advanced high-barrier plastics and composite materials presents a competitive restraint, especially for cost-sensitive applications. Evolving environmental regulations and the drive for sustainability are pushing for more recyclable and resource-efficient packaging solutions, which can necessitate significant investment in new technologies. The capital-intensive nature of glass manufacturing also presents a barrier to entry for new players and requires substantial investment for existing ones.
Growth Drivers in the Pharmaceutical Glass Packaging Market
The pharmaceutical glass packaging market is experiencing accelerated growth driven by several powerful forces. Technological innovation in glass formulation and manufacturing processes is leading to the creation of advanced glass types, such as Type I borosilicate glass, offering enhanced inertness and stability crucial for sensitive biologics and vaccines. The increasing global prevalence of chronic diseases and an aging population are significantly boosting the demand for pharmaceuticals, particularly injectable and parenteral medications, where glass packaging is the preferred choice due to its superior barrier properties. Furthermore, the expanding biopharmaceutical and biosimilar market segments are demanding high-quality, reliable packaging solutions that can maintain product integrity, thereby driving the adoption of advanced glass vials, ampoules, and cartridges.
Challenges Impacting Pharmaceutical Glass Packaging Growth
Several significant challenges are impacting the growth trajectory of the pharmaceutical glass packaging market. Stringent and evolving regulatory landscapes worldwide necessitate continuous adaptation and investment in compliance, adding to operational costs. Supply chain vulnerabilities, including fluctuations in raw material availability and pricing, along with geopolitical factors, can lead to production disruptions and increased lead times. While glass offers unparalleled advantages, the competitive pressure from advanced plastic and composite packaging materials, particularly in terms of cost and weight for certain applications, remains a persistent challenge. The increasing global emphasis on sustainability and circular economy principles also compels the industry to innovate in areas like recyclability and energy-efficient manufacturing, requiring substantial capital investment and technological advancements.
Key Players Shaping the Pharmaceutical Glass Packaging Market
- Gerresheimer
- Nipro Corporation
- Schott AG
- SGD Pharma
- Shandong PG Science Co., Ltd.
- Ompi
- Rocco Bormioli
- Ardagh Group
- West Pharmaceutical Services, Inc.
- BD (Becton, Dickinson and Company)
- Nippon Electric Glass Co., Ltd.
- CORNING Incorporated
- Linuo Group
- Lumme Packaging
- Namicos Corporation
- Cangzhou Four Stars Glass Co., Ltd.
- Cangzhou Xingchen Glass Products Factory
- Chaohua Technology Co., Ltd.
- Chengdu Jingu Pharma-Pack Co., Ltd.
- Hua Xin Glass Co., Ltd.
Significant Pharmaceutical Glass Packaging Industry Milestones
- 2019: Increased investment in R&D for advanced coatings on glass vials to reduce particle generation and improve drug compatibility.
- 2020: Surge in demand for injectable vials and ampoules driven by the global response to the COVID-19 pandemic and vaccine development.
- 2021: Strategic acquisitions by major players to expand manufacturing capacity and diversify product portfolios in high-growth segments like prefilled syringes.
- 2022: Introduction of lighter-weight borosilicate glass formulations to improve sustainability and reduce transportation costs.
- 2023: Enhanced focus on automated inspection systems and artificial intelligence for quality control in pharmaceutical glass packaging production.
- 2024: Increased exploration of sustainable manufacturing practices and circular economy models within the glass packaging industry.
Future Outlook for Pharmaceutical Glass Packaging Market
The future outlook for the pharmaceutical glass packaging market remains exceptionally strong, driven by persistent demand for safe, reliable, and high-quality drug containment solutions. The ongoing growth in biologics, specialty pharmaceuticals, and advanced therapies will continue to favor glass packaging due to its inertness and barrier properties. Strategic opportunities lie in the development of innovative drug delivery systems, such as advanced prefilled syringes and combination products, which will require sophisticated glass components. Furthermore, the increasing emphasis on sustainability within the pharmaceutical sector will spur innovation in eco-friendly glass production and recycling initiatives. Emerging markets, with their expanding healthcare access and growing pharmaceutical manufacturing bases, represent significant untapped potential for market expansion. The market is poised for continued growth, driven by innovation, unmet medical needs, and the enduring trust in glass as a superior material for protecting life-saving medications.
Pharmaceutical Glass Packaging Segmentation
-
1. Application
- 1.1. Injectable
- 1.2. Transfusion
- 1.3. Other
-
2. Types
- 2.1. Medium Borosilicate Glass Tube
- 2.2. Glass Tube Injection Bottle
- 2.3. Ampoule
- 2.4. Cartridges
- 2.5. Prefilled Syringe
- 2.6. Other
Pharmaceutical Glass Packaging Segmentation By Geography
-
1. North America
- 1.1. United States
- 1.2. Canada
- 1.3. Mexico
-
2. South America
- 2.1. Brazil
- 2.2. Argentina
- 2.3. Rest of South America
-
3. Europe
- 3.1. United Kingdom
- 3.2. Germany
- 3.3. France
- 3.4. Italy
- 3.5. Spain
- 3.6. Russia
- 3.7. Benelux
- 3.8. Nordics
- 3.9. Rest of Europe
-
4. Middle East & Africa
- 4.1. Turkey
- 4.2. Israel
- 4.3. GCC
- 4.4. North Africa
- 4.5. South Africa
- 4.6. Rest of Middle East & Africa
-
5. Asia Pacific
- 5.1. China
- 5.2. India
- 5.3. Japan
- 5.4. South Korea
- 5.5. ASEAN
- 5.6. Oceania
- 5.7. Rest of Asia Pacific
Pharmaceutical Glass Packaging Regional Market Share
Geographic Coverage of Pharmaceutical Glass Packaging
Pharmaceutical Glass Packaging REPORT HIGHLIGHTS
| Aspects | Details |
|---|---|
| Study Period | 2020-2034 |
| Base Year | 2025 |
| Estimated Year | 2026 |
| Forecast Period | 2026-2034 |
| Historical Period | 2020-2025 |
| Growth Rate | CAGR of 8.8% from 2020-2034 |
| Segmentation |
|
Table of Contents
- 1. Introduction
- 1.1. Research Scope
- 1.2. Market Segmentation
- 1.3. Research Methodology
- 1.4. Definitions and Assumptions
- 2. Executive Summary
- 2.1. Introduction
- 3. Market Dynamics
- 3.1. Introduction
- 3.2. Market Drivers
- 3.3. Market Restrains
- 3.4. Market Trends
- 4. Market Factor Analysis
- 4.1. Porters Five Forces
- 4.2. Supply/Value Chain
- 4.3. PESTEL analysis
- 4.4. Market Entropy
- 4.5. Patent/Trademark Analysis
- 5. Global Pharmaceutical Glass Packaging Analysis, Insights and Forecast, 2020-2032
- 5.1. Market Analysis, Insights and Forecast - by Application
- 5.1.1. Injectable
- 5.1.2. Transfusion
- 5.1.3. Other
- 5.2. Market Analysis, Insights and Forecast - by Types
- 5.2.1. Medium Borosilicate Glass Tube
- 5.2.2. Glass Tube Injection Bottle
- 5.2.3. Ampoule
- 5.2.4. Cartridges
- 5.2.5. Prefilled Syringe
- 5.2.6. Other
- 5.3. Market Analysis, Insights and Forecast - by Region
- 5.3.1. North America
- 5.3.2. South America
- 5.3.3. Europe
- 5.3.4. Middle East & Africa
- 5.3.5. Asia Pacific
- 5.1. Market Analysis, Insights and Forecast - by Application
- 6. North America Pharmaceutical Glass Packaging Analysis, Insights and Forecast, 2020-2032
- 6.1. Market Analysis, Insights and Forecast - by Application
- 6.1.1. Injectable
- 6.1.2. Transfusion
- 6.1.3. Other
- 6.2. Market Analysis, Insights and Forecast - by Types
- 6.2.1. Medium Borosilicate Glass Tube
- 6.2.2. Glass Tube Injection Bottle
- 6.2.3. Ampoule
- 6.2.4. Cartridges
- 6.2.5. Prefilled Syringe
- 6.2.6. Other
- 6.1. Market Analysis, Insights and Forecast - by Application
- 7. South America Pharmaceutical Glass Packaging Analysis, Insights and Forecast, 2020-2032
- 7.1. Market Analysis, Insights and Forecast - by Application
- 7.1.1. Injectable
- 7.1.2. Transfusion
- 7.1.3. Other
- 7.2. Market Analysis, Insights and Forecast - by Types
- 7.2.1. Medium Borosilicate Glass Tube
- 7.2.2. Glass Tube Injection Bottle
- 7.2.3. Ampoule
- 7.2.4. Cartridges
- 7.2.5. Prefilled Syringe
- 7.2.6. Other
- 7.1. Market Analysis, Insights and Forecast - by Application
- 8. Europe Pharmaceutical Glass Packaging Analysis, Insights and Forecast, 2020-2032
- 8.1. Market Analysis, Insights and Forecast - by Application
- 8.1.1. Injectable
- 8.1.2. Transfusion
- 8.1.3. Other
- 8.2. Market Analysis, Insights and Forecast - by Types
- 8.2.1. Medium Borosilicate Glass Tube
- 8.2.2. Glass Tube Injection Bottle
- 8.2.3. Ampoule
- 8.2.4. Cartridges
- 8.2.5. Prefilled Syringe
- 8.2.6. Other
- 8.1. Market Analysis, Insights and Forecast - by Application
- 9. Middle East & Africa Pharmaceutical Glass Packaging Analysis, Insights and Forecast, 2020-2032
- 9.1. Market Analysis, Insights and Forecast - by Application
- 9.1.1. Injectable
- 9.1.2. Transfusion
- 9.1.3. Other
- 9.2. Market Analysis, Insights and Forecast - by Types
- 9.2.1. Medium Borosilicate Glass Tube
- 9.2.2. Glass Tube Injection Bottle
- 9.2.3. Ampoule
- 9.2.4. Cartridges
- 9.2.5. Prefilled Syringe
- 9.2.6. Other
- 9.1. Market Analysis, Insights and Forecast - by Application
- 10. Asia Pacific Pharmaceutical Glass Packaging Analysis, Insights and Forecast, 2020-2032
- 10.1. Market Analysis, Insights and Forecast - by Application
- 10.1.1. Injectable
- 10.1.2. Transfusion
- 10.1.3. Other
- 10.2. Market Analysis, Insights and Forecast - by Types
- 10.2.1. Medium Borosilicate Glass Tube
- 10.2.2. Glass Tube Injection Bottle
- 10.2.3. Ampoule
- 10.2.4. Cartridges
- 10.2.5. Prefilled Syringe
- 10.2.6. Other
- 10.1. Market Analysis, Insights and Forecast - by Application
- 11. Competitive Analysis
- 11.1. Global Market Share Analysis 2025
- 11.2. Company Profiles
- 11.2.1 Gerresheimer
- 11.2.1.1. Overview
- 11.2.1.2. Products
- 11.2.1.3. SWOT Analysis
- 11.2.1.4. Recent Developments
- 11.2.1.5. Financials (Based on Availability)
- 11.2.2 Nipro
- 11.2.2.1. Overview
- 11.2.2.2. Products
- 11.2.2.3. SWOT Analysis
- 11.2.2.4. Recent Developments
- 11.2.2.5. Financials (Based on Availability)
- 11.2.3 Schott
- 11.2.3.1. Overview
- 11.2.3.2. Products
- 11.2.3.3. SWOT Analysis
- 11.2.3.4. Recent Developments
- 11.2.3.5. Financials (Based on Availability)
- 11.2.4 SGD
- 11.2.4.1. Overview
- 11.2.4.2. Products
- 11.2.4.3. SWOT Analysis
- 11.2.4.4. Recent Developments
- 11.2.4.5. Financials (Based on Availability)
- 11.2.5 Shandong PG
- 11.2.5.1. Overview
- 11.2.5.2. Products
- 11.2.5.3. SWOT Analysis
- 11.2.5.4. Recent Developments
- 11.2.5.5. Financials (Based on Availability)
- 11.2.6 Opmi
- 11.2.6.1. Overview
- 11.2.6.2. Products
- 11.2.6.3. SWOT Analysis
- 11.2.6.4. Recent Developments
- 11.2.6.5. Financials (Based on Availability)
- 11.2.7 Rocco Bormioli
- 11.2.7.1. Overview
- 11.2.7.2. Products
- 11.2.7.3. SWOT Analysis
- 11.2.7.4. Recent Developments
- 11.2.7.5. Financials (Based on Availability)
- 11.2.8 Ardagh
- 11.2.8.1. Overview
- 11.2.8.2. Products
- 11.2.8.3. SWOT Analysis
- 11.2.8.4. Recent Developments
- 11.2.8.5. Financials (Based on Availability)
- 11.2.9 West-P
- 11.2.9.1. Overview
- 11.2.9.2. Products
- 11.2.9.3. SWOT Analysis
- 11.2.9.4. Recent Developments
- 11.2.9.5. Financials (Based on Availability)
- 11.2.10 BD
- 11.2.10.1. Overview
- 11.2.10.2. Products
- 11.2.10.3. SWOT Analysis
- 11.2.10.4. Recent Developments
- 11.2.10.5. Financials (Based on Availability)
- 11.2.11 Nippon Electric Glass
- 11.2.11.1. Overview
- 11.2.11.2. Products
- 11.2.11.3. SWOT Analysis
- 11.2.11.4. Recent Developments
- 11.2.11.5. Financials (Based on Availability)
- 11.2.12 CORNING
- 11.2.12.1. Overview
- 11.2.12.2. Products
- 11.2.12.3. SWOT Analysis
- 11.2.12.4. Recent Developments
- 11.2.12.5. Financials (Based on Availability)
- 11.2.13 Linuo
- 11.2.13.1. Overview
- 11.2.13.2. Products
- 11.2.13.3. SWOT Analysis
- 11.2.13.4. Recent Developments
- 11.2.13.5. Financials (Based on Availability)
- 11.2.14 Lumme
- 11.2.14.1. Overview
- 11.2.14.2. Products
- 11.2.14.3. SWOT Analysis
- 11.2.14.4. Recent Developments
- 11.2.14.5. Financials (Based on Availability)
- 11.2.15 Namicos Corporation
- 11.2.15.1. Overview
- 11.2.15.2. Products
- 11.2.15.3. SWOT Analysis
- 11.2.15.4. Recent Developments
- 11.2.15.5. Financials (Based on Availability)
- 11.2.16 Cangzhou Four Stars Glass
- 11.2.16.1. Overview
- 11.2.16.2. Products
- 11.2.16.3. SWOT Analysis
- 11.2.16.4. Recent Developments
- 11.2.16.5. Financials (Based on Availability)
- 11.2.17 Cangzhou Xingchen Glass Products
- 11.2.17.1. Overview
- 11.2.17.2. Products
- 11.2.17.3. SWOT Analysis
- 11.2.17.4. Recent Developments
- 11.2.17.5. Financials (Based on Availability)
- 11.2.18 Chaohua
- 11.2.18.1. Overview
- 11.2.18.2. Products
- 11.2.18.3. SWOT Analysis
- 11.2.18.4. Recent Developments
- 11.2.18.5. Financials (Based on Availability)
- 11.2.19 Chengdu Jingu Pharma-Pack
- 11.2.19.1. Overview
- 11.2.19.2. Products
- 11.2.19.3. SWOT Analysis
- 11.2.19.4. Recent Developments
- 11.2.19.5. Financials (Based on Availability)
- 11.2.20 Hua Xin Glass
- 11.2.20.1. Overview
- 11.2.20.2. Products
- 11.2.20.3. SWOT Analysis
- 11.2.20.4. Recent Developments
- 11.2.20.5. Financials (Based on Availability)
- 11.2.1 Gerresheimer
List of Figures
- Figure 1: Global Pharmaceutical Glass Packaging Revenue Breakdown (undefined, %) by Region 2025 & 2033
- Figure 2: Global Pharmaceutical Glass Packaging Volume Breakdown (K, %) by Region 2025 & 2033
- Figure 3: North America Pharmaceutical Glass Packaging Revenue (undefined), by Application 2025 & 2033
- Figure 4: North America Pharmaceutical Glass Packaging Volume (K), by Application 2025 & 2033
- Figure 5: North America Pharmaceutical Glass Packaging Revenue Share (%), by Application 2025 & 2033
- Figure 6: North America Pharmaceutical Glass Packaging Volume Share (%), by Application 2025 & 2033
- Figure 7: North America Pharmaceutical Glass Packaging Revenue (undefined), by Types 2025 & 2033
- Figure 8: North America Pharmaceutical Glass Packaging Volume (K), by Types 2025 & 2033
- Figure 9: North America Pharmaceutical Glass Packaging Revenue Share (%), by Types 2025 & 2033
- Figure 10: North America Pharmaceutical Glass Packaging Volume Share (%), by Types 2025 & 2033
- Figure 11: North America Pharmaceutical Glass Packaging Revenue (undefined), by Country 2025 & 2033
- Figure 12: North America Pharmaceutical Glass Packaging Volume (K), by Country 2025 & 2033
- Figure 13: North America Pharmaceutical Glass Packaging Revenue Share (%), by Country 2025 & 2033
- Figure 14: North America Pharmaceutical Glass Packaging Volume Share (%), by Country 2025 & 2033
- Figure 15: South America Pharmaceutical Glass Packaging Revenue (undefined), by Application 2025 & 2033
- Figure 16: South America Pharmaceutical Glass Packaging Volume (K), by Application 2025 & 2033
- Figure 17: South America Pharmaceutical Glass Packaging Revenue Share (%), by Application 2025 & 2033
- Figure 18: South America Pharmaceutical Glass Packaging Volume Share (%), by Application 2025 & 2033
- Figure 19: South America Pharmaceutical Glass Packaging Revenue (undefined), by Types 2025 & 2033
- Figure 20: South America Pharmaceutical Glass Packaging Volume (K), by Types 2025 & 2033
- Figure 21: South America Pharmaceutical Glass Packaging Revenue Share (%), by Types 2025 & 2033
- Figure 22: South America Pharmaceutical Glass Packaging Volume Share (%), by Types 2025 & 2033
- Figure 23: South America Pharmaceutical Glass Packaging Revenue (undefined), by Country 2025 & 2033
- Figure 24: South America Pharmaceutical Glass Packaging Volume (K), by Country 2025 & 2033
- Figure 25: South America Pharmaceutical Glass Packaging Revenue Share (%), by Country 2025 & 2033
- Figure 26: South America Pharmaceutical Glass Packaging Volume Share (%), by Country 2025 & 2033
- Figure 27: Europe Pharmaceutical Glass Packaging Revenue (undefined), by Application 2025 & 2033
- Figure 28: Europe Pharmaceutical Glass Packaging Volume (K), by Application 2025 & 2033
- Figure 29: Europe Pharmaceutical Glass Packaging Revenue Share (%), by Application 2025 & 2033
- Figure 30: Europe Pharmaceutical Glass Packaging Volume Share (%), by Application 2025 & 2033
- Figure 31: Europe Pharmaceutical Glass Packaging Revenue (undefined), by Types 2025 & 2033
- Figure 32: Europe Pharmaceutical Glass Packaging Volume (K), by Types 2025 & 2033
- Figure 33: Europe Pharmaceutical Glass Packaging Revenue Share (%), by Types 2025 & 2033
- Figure 34: Europe Pharmaceutical Glass Packaging Volume Share (%), by Types 2025 & 2033
- Figure 35: Europe Pharmaceutical Glass Packaging Revenue (undefined), by Country 2025 & 2033
- Figure 36: Europe Pharmaceutical Glass Packaging Volume (K), by Country 2025 & 2033
- Figure 37: Europe Pharmaceutical Glass Packaging Revenue Share (%), by Country 2025 & 2033
- Figure 38: Europe Pharmaceutical Glass Packaging Volume Share (%), by Country 2025 & 2033
- Figure 39: Middle East & Africa Pharmaceutical Glass Packaging Revenue (undefined), by Application 2025 & 2033
- Figure 40: Middle East & Africa Pharmaceutical Glass Packaging Volume (K), by Application 2025 & 2033
- Figure 41: Middle East & Africa Pharmaceutical Glass Packaging Revenue Share (%), by Application 2025 & 2033
- Figure 42: Middle East & Africa Pharmaceutical Glass Packaging Volume Share (%), by Application 2025 & 2033
- Figure 43: Middle East & Africa Pharmaceutical Glass Packaging Revenue (undefined), by Types 2025 & 2033
- Figure 44: Middle East & Africa Pharmaceutical Glass Packaging Volume (K), by Types 2025 & 2033
- Figure 45: Middle East & Africa Pharmaceutical Glass Packaging Revenue Share (%), by Types 2025 & 2033
- Figure 46: Middle East & Africa Pharmaceutical Glass Packaging Volume Share (%), by Types 2025 & 2033
- Figure 47: Middle East & Africa Pharmaceutical Glass Packaging Revenue (undefined), by Country 2025 & 2033
- Figure 48: Middle East & Africa Pharmaceutical Glass Packaging Volume (K), by Country 2025 & 2033
- Figure 49: Middle East & Africa Pharmaceutical Glass Packaging Revenue Share (%), by Country 2025 & 2033
- Figure 50: Middle East & Africa Pharmaceutical Glass Packaging Volume Share (%), by Country 2025 & 2033
- Figure 51: Asia Pacific Pharmaceutical Glass Packaging Revenue (undefined), by Application 2025 & 2033
- Figure 52: Asia Pacific Pharmaceutical Glass Packaging Volume (K), by Application 2025 & 2033
- Figure 53: Asia Pacific Pharmaceutical Glass Packaging Revenue Share (%), by Application 2025 & 2033
- Figure 54: Asia Pacific Pharmaceutical Glass Packaging Volume Share (%), by Application 2025 & 2033
- Figure 55: Asia Pacific Pharmaceutical Glass Packaging Revenue (undefined), by Types 2025 & 2033
- Figure 56: Asia Pacific Pharmaceutical Glass Packaging Volume (K), by Types 2025 & 2033
- Figure 57: Asia Pacific Pharmaceutical Glass Packaging Revenue Share (%), by Types 2025 & 2033
- Figure 58: Asia Pacific Pharmaceutical Glass Packaging Volume Share (%), by Types 2025 & 2033
- Figure 59: Asia Pacific Pharmaceutical Glass Packaging Revenue (undefined), by Country 2025 & 2033
- Figure 60: Asia Pacific Pharmaceutical Glass Packaging Volume (K), by Country 2025 & 2033
- Figure 61: Asia Pacific Pharmaceutical Glass Packaging Revenue Share (%), by Country 2025 & 2033
- Figure 62: Asia Pacific Pharmaceutical Glass Packaging Volume Share (%), by Country 2025 & 2033
List of Tables
- Table 1: Global Pharmaceutical Glass Packaging Revenue undefined Forecast, by Application 2020 & 2033
- Table 2: Global Pharmaceutical Glass Packaging Volume K Forecast, by Application 2020 & 2033
- Table 3: Global Pharmaceutical Glass Packaging Revenue undefined Forecast, by Types 2020 & 2033
- Table 4: Global Pharmaceutical Glass Packaging Volume K Forecast, by Types 2020 & 2033
- Table 5: Global Pharmaceutical Glass Packaging Revenue undefined Forecast, by Region 2020 & 2033
- Table 6: Global Pharmaceutical Glass Packaging Volume K Forecast, by Region 2020 & 2033
- Table 7: Global Pharmaceutical Glass Packaging Revenue undefined Forecast, by Application 2020 & 2033
- Table 8: Global Pharmaceutical Glass Packaging Volume K Forecast, by Application 2020 & 2033
- Table 9: Global Pharmaceutical Glass Packaging Revenue undefined Forecast, by Types 2020 & 2033
- Table 10: Global Pharmaceutical Glass Packaging Volume K Forecast, by Types 2020 & 2033
- Table 11: Global Pharmaceutical Glass Packaging Revenue undefined Forecast, by Country 2020 & 2033
- Table 12: Global Pharmaceutical Glass Packaging Volume K Forecast, by Country 2020 & 2033
- Table 13: United States Pharmaceutical Glass Packaging Revenue (undefined) Forecast, by Application 2020 & 2033
- Table 14: United States Pharmaceutical Glass Packaging Volume (K) Forecast, by Application 2020 & 2033
- Table 15: Canada Pharmaceutical Glass Packaging Revenue (undefined) Forecast, by Application 2020 & 2033
- Table 16: Canada Pharmaceutical Glass Packaging Volume (K) Forecast, by Application 2020 & 2033
- Table 17: Mexico Pharmaceutical Glass Packaging Revenue (undefined) Forecast, by Application 2020 & 2033
- Table 18: Mexico Pharmaceutical Glass Packaging Volume (K) Forecast, by Application 2020 & 2033
- Table 19: Global Pharmaceutical Glass Packaging Revenue undefined Forecast, by Application 2020 & 2033
- Table 20: Global Pharmaceutical Glass Packaging Volume K Forecast, by Application 2020 & 2033
- Table 21: Global Pharmaceutical Glass Packaging Revenue undefined Forecast, by Types 2020 & 2033
- Table 22: Global Pharmaceutical Glass Packaging Volume K Forecast, by Types 2020 & 2033
- Table 23: Global Pharmaceutical Glass Packaging Revenue undefined Forecast, by Country 2020 & 2033
- Table 24: Global Pharmaceutical Glass Packaging Volume K Forecast, by Country 2020 & 2033
- Table 25: Brazil Pharmaceutical Glass Packaging Revenue (undefined) Forecast, by Application 2020 & 2033
- Table 26: Brazil Pharmaceutical Glass Packaging Volume (K) Forecast, by Application 2020 & 2033
- Table 27: Argentina Pharmaceutical Glass Packaging Revenue (undefined) Forecast, by Application 2020 & 2033
- Table 28: Argentina Pharmaceutical Glass Packaging Volume (K) Forecast, by Application 2020 & 2033
- Table 29: Rest of South America Pharmaceutical Glass Packaging Revenue (undefined) Forecast, by Application 2020 & 2033
- Table 30: Rest of South America Pharmaceutical Glass Packaging Volume (K) Forecast, by Application 2020 & 2033
- Table 31: Global Pharmaceutical Glass Packaging Revenue undefined Forecast, by Application 2020 & 2033
- Table 32: Global Pharmaceutical Glass Packaging Volume K Forecast, by Application 2020 & 2033
- Table 33: Global Pharmaceutical Glass Packaging Revenue undefined Forecast, by Types 2020 & 2033
- Table 34: Global Pharmaceutical Glass Packaging Volume K Forecast, by Types 2020 & 2033
- Table 35: Global Pharmaceutical Glass Packaging Revenue undefined Forecast, by Country 2020 & 2033
- Table 36: Global Pharmaceutical Glass Packaging Volume K Forecast, by Country 2020 & 2033
- Table 37: United Kingdom Pharmaceutical Glass Packaging Revenue (undefined) Forecast, by Application 2020 & 2033
- Table 38: United Kingdom Pharmaceutical Glass Packaging Volume (K) Forecast, by Application 2020 & 2033
- Table 39: Germany Pharmaceutical Glass Packaging Revenue (undefined) Forecast, by Application 2020 & 2033
- Table 40: Germany Pharmaceutical Glass Packaging Volume (K) Forecast, by Application 2020 & 2033
- Table 41: France Pharmaceutical Glass Packaging Revenue (undefined) Forecast, by Application 2020 & 2033
- Table 42: France Pharmaceutical Glass Packaging Volume (K) Forecast, by Application 2020 & 2033
- Table 43: Italy Pharmaceutical Glass Packaging Revenue (undefined) Forecast, by Application 2020 & 2033
- Table 44: Italy Pharmaceutical Glass Packaging Volume (K) Forecast, by Application 2020 & 2033
- Table 45: Spain Pharmaceutical Glass Packaging Revenue (undefined) Forecast, by Application 2020 & 2033
- Table 46: Spain Pharmaceutical Glass Packaging Volume (K) Forecast, by Application 2020 & 2033
- Table 47: Russia Pharmaceutical Glass Packaging Revenue (undefined) Forecast, by Application 2020 & 2033
- Table 48: Russia Pharmaceutical Glass Packaging Volume (K) Forecast, by Application 2020 & 2033
- Table 49: Benelux Pharmaceutical Glass Packaging Revenue (undefined) Forecast, by Application 2020 & 2033
- Table 50: Benelux Pharmaceutical Glass Packaging Volume (K) Forecast, by Application 2020 & 2033
- Table 51: Nordics Pharmaceutical Glass Packaging Revenue (undefined) Forecast, by Application 2020 & 2033
- Table 52: Nordics Pharmaceutical Glass Packaging Volume (K) Forecast, by Application 2020 & 2033
- Table 53: Rest of Europe Pharmaceutical Glass Packaging Revenue (undefined) Forecast, by Application 2020 & 2033
- Table 54: Rest of Europe Pharmaceutical Glass Packaging Volume (K) Forecast, by Application 2020 & 2033
- Table 55: Global Pharmaceutical Glass Packaging Revenue undefined Forecast, by Application 2020 & 2033
- Table 56: Global Pharmaceutical Glass Packaging Volume K Forecast, by Application 2020 & 2033
- Table 57: Global Pharmaceutical Glass Packaging Revenue undefined Forecast, by Types 2020 & 2033
- Table 58: Global Pharmaceutical Glass Packaging Volume K Forecast, by Types 2020 & 2033
- Table 59: Global Pharmaceutical Glass Packaging Revenue undefined Forecast, by Country 2020 & 2033
- Table 60: Global Pharmaceutical Glass Packaging Volume K Forecast, by Country 2020 & 2033
- Table 61: Turkey Pharmaceutical Glass Packaging Revenue (undefined) Forecast, by Application 2020 & 2033
- Table 62: Turkey Pharmaceutical Glass Packaging Volume (K) Forecast, by Application 2020 & 2033
- Table 63: Israel Pharmaceutical Glass Packaging Revenue (undefined) Forecast, by Application 2020 & 2033
- Table 64: Israel Pharmaceutical Glass Packaging Volume (K) Forecast, by Application 2020 & 2033
- Table 65: GCC Pharmaceutical Glass Packaging Revenue (undefined) Forecast, by Application 2020 & 2033
- Table 66: GCC Pharmaceutical Glass Packaging Volume (K) Forecast, by Application 2020 & 2033
- Table 67: North Africa Pharmaceutical Glass Packaging Revenue (undefined) Forecast, by Application 2020 & 2033
- Table 68: North Africa Pharmaceutical Glass Packaging Volume (K) Forecast, by Application 2020 & 2033
- Table 69: South Africa Pharmaceutical Glass Packaging Revenue (undefined) Forecast, by Application 2020 & 2033
- Table 70: South Africa Pharmaceutical Glass Packaging Volume (K) Forecast, by Application 2020 & 2033
- Table 71: Rest of Middle East & Africa Pharmaceutical Glass Packaging Revenue (undefined) Forecast, by Application 2020 & 2033
- Table 72: Rest of Middle East & Africa Pharmaceutical Glass Packaging Volume (K) Forecast, by Application 2020 & 2033
- Table 73: Global Pharmaceutical Glass Packaging Revenue undefined Forecast, by Application 2020 & 2033
- Table 74: Global Pharmaceutical Glass Packaging Volume K Forecast, by Application 2020 & 2033
- Table 75: Global Pharmaceutical Glass Packaging Revenue undefined Forecast, by Types 2020 & 2033
- Table 76: Global Pharmaceutical Glass Packaging Volume K Forecast, by Types 2020 & 2033
- Table 77: Global Pharmaceutical Glass Packaging Revenue undefined Forecast, by Country 2020 & 2033
- Table 78: Global Pharmaceutical Glass Packaging Volume K Forecast, by Country 2020 & 2033
- Table 79: China Pharmaceutical Glass Packaging Revenue (undefined) Forecast, by Application 2020 & 2033
- Table 80: China Pharmaceutical Glass Packaging Volume (K) Forecast, by Application 2020 & 2033
- Table 81: India Pharmaceutical Glass Packaging Revenue (undefined) Forecast, by Application 2020 & 2033
- Table 82: India Pharmaceutical Glass Packaging Volume (K) Forecast, by Application 2020 & 2033
- Table 83: Japan Pharmaceutical Glass Packaging Revenue (undefined) Forecast, by Application 2020 & 2033
- Table 84: Japan Pharmaceutical Glass Packaging Volume (K) Forecast, by Application 2020 & 2033
- Table 85: South Korea Pharmaceutical Glass Packaging Revenue (undefined) Forecast, by Application 2020 & 2033
- Table 86: South Korea Pharmaceutical Glass Packaging Volume (K) Forecast, by Application 2020 & 2033
- Table 87: ASEAN Pharmaceutical Glass Packaging Revenue (undefined) Forecast, by Application 2020 & 2033
- Table 88: ASEAN Pharmaceutical Glass Packaging Volume (K) Forecast, by Application 2020 & 2033
- Table 89: Oceania Pharmaceutical Glass Packaging Revenue (undefined) Forecast, by Application 2020 & 2033
- Table 90: Oceania Pharmaceutical Glass Packaging Volume (K) Forecast, by Application 2020 & 2033
- Table 91: Rest of Asia Pacific Pharmaceutical Glass Packaging Revenue (undefined) Forecast, by Application 2020 & 2033
- Table 92: Rest of Asia Pacific Pharmaceutical Glass Packaging Volume (K) Forecast, by Application 2020 & 2033
Frequently Asked Questions
1. What is the projected Compound Annual Growth Rate (CAGR) of the Pharmaceutical Glass Packaging?
The projected CAGR is approximately 8.8%.
2. Which companies are prominent players in the Pharmaceutical Glass Packaging?
Key companies in the market include Gerresheimer, Nipro, Schott, SGD, Shandong PG, Opmi, Rocco Bormioli, Ardagh, West-P, BD, Nippon Electric Glass, CORNING, Linuo, Lumme, Namicos Corporation, Cangzhou Four Stars Glass, Cangzhou Xingchen Glass Products, Chaohua, Chengdu Jingu Pharma-Pack, Hua Xin Glass.
3. What are the main segments of the Pharmaceutical Glass Packaging?
The market segments include Application, Types.
4. Can you provide details about the market size?
The market size is estimated to be USD XXX N/A as of 2022.
5. What are some drivers contributing to market growth?
N/A
6. What are the notable trends driving market growth?
N/A
7. Are there any restraints impacting market growth?
N/A
8. Can you provide examples of recent developments in the market?
N/A
9. What pricing options are available for accessing the report?
Pricing options include single-user, multi-user, and enterprise licenses priced at USD 3350.00, USD 5025.00, and USD 6700.00 respectively.
10. Is the market size provided in terms of value or volume?
The market size is provided in terms of value, measured in N/A and volume, measured in K.
11. Are there any specific market keywords associated with the report?
Yes, the market keyword associated with the report is "Pharmaceutical Glass Packaging," which aids in identifying and referencing the specific market segment covered.
12. How do I determine which pricing option suits my needs best?
The pricing options vary based on user requirements and access needs. Individual users may opt for single-user licenses, while businesses requiring broader access may choose multi-user or enterprise licenses for cost-effective access to the report.
13. Are there any additional resources or data provided in the Pharmaceutical Glass Packaging report?
While the report offers comprehensive insights, it's advisable to review the specific contents or supplementary materials provided to ascertain if additional resources or data are available.
14. How can I stay updated on further developments or reports in the Pharmaceutical Glass Packaging?
To stay informed about further developments, trends, and reports in the Pharmaceutical Glass Packaging, consider subscribing to industry newsletters, following relevant companies and organizations, or regularly checking reputable industry news sources and publications.
Methodology
Step 1 - Identification of Relevant Samples Size from Population Database


Step 2 - Approaches for Defining Global Market Size (Value, Volume* & Price*)

Note*: In applicable scenarios
Step 3 - Data Sources
Primary Research
- Web Analytics
- Survey Reports
- Research Institute
- Latest Research Reports
- Opinion Leaders
Secondary Research
- Annual Reports
- White Paper
- Latest Press Release
- Industry Association
- Paid Database
- Investor Presentations

Step 4 - Data Triangulation
Involves using different sources of information in order to increase the validity of a study
These sources are likely to be stakeholders in a program - participants, other researchers, program staff, other community members, and so on.
Then we put all data in single framework & apply various statistical tools to find out the dynamic on the market.
During the analysis stage, feedback from the stakeholder groups would be compared to determine areas of agreement as well as areas of divergence