

Key Insights
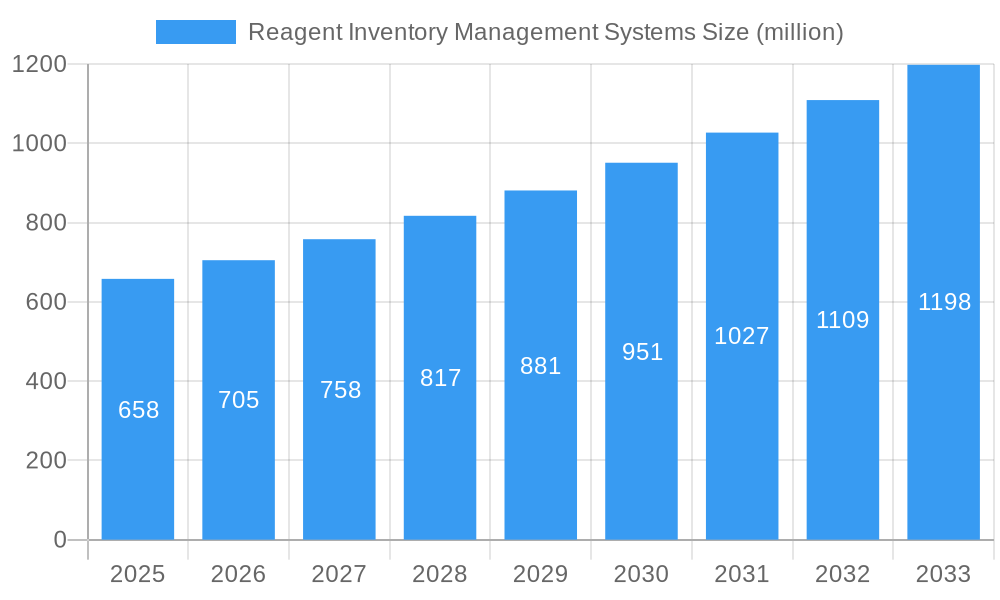
The global Reagent Inventory Management Systems market is poised for significant expansion, projected to reach an estimated USD 658 million by 2025, with a robust Compound Annual Growth Rate (CAGR) of 7.7% during the forecast period of 2025-2033. This growth is fueled by the increasing complexity and volume of research and development activities across scientific institutions and the burgeoning medical industry. Key drivers include the escalating need for efficient tracking of valuable and often volatile reagents, the drive towards automation to minimize human error and waste, and the stringent regulatory compliance requirements in pharmaceutical and biotechnology sectors. The market is witnessing a strong trend towards cloud-based solutions, offering enhanced accessibility, scalability, and data analytics capabilities, which are crucial for modern laboratories. Furthermore, the integration of AI and machine learning is emerging as a significant trend, promising predictive capabilities for stock management and optimized resource allocation.
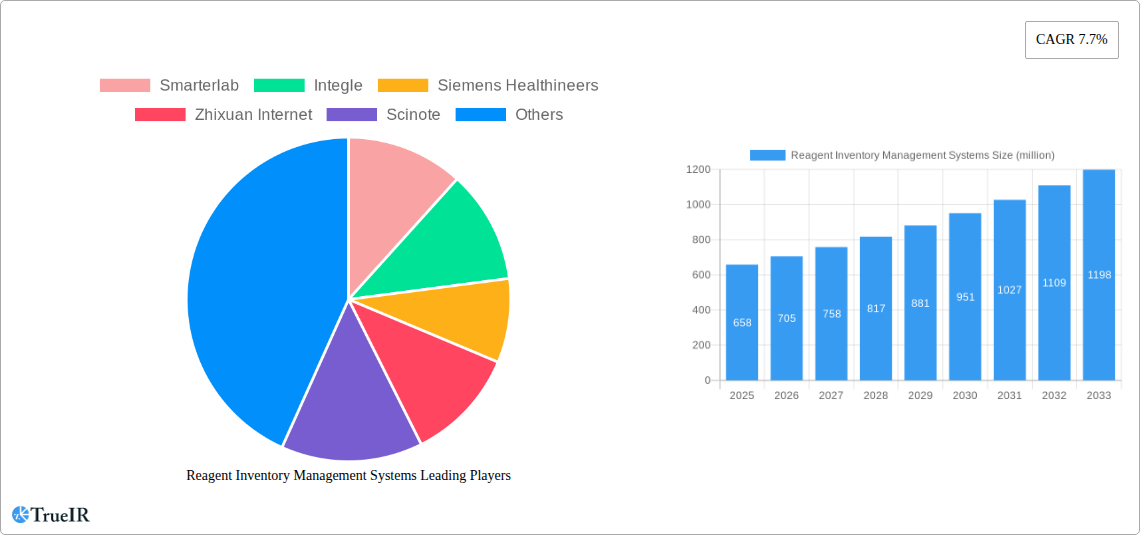
Reagent Inventory Management Systems Market Size (In Million)
Despite the promising growth trajectory, certain restraints could influence the market's pace. The initial implementation costs of advanced reagent inventory management systems, coupled with the need for comprehensive training and potential resistance to adopting new technologies within established workflows, represent significant hurdles. However, the long-term benefits of improved operational efficiency, reduced inventory costs, and enhanced research reproducibility are expected to outweigh these challenges. The market is segmented by application, with Scientific Research Institutions and the Medical Industry being the primary beneficiaries, while "Others" encompassing various industrial applications also contributes to the overall demand. The division between cloud-based and local-based systems highlights a transitional phase, with a clear lean towards cloud solutions for their inherent flexibility and analytical power. Leading companies like Smarterlab, Integle, Siemens Healthineers, and LabWare are actively shaping the competitive landscape through innovation and strategic partnerships.
Reagent Inventory Management Systems Company Market Share
Reagent Inventory Management Systems Market Report: Navigating the Future of Scientific & Medical Supply Chain Efficiency
Unlocking critical insights into the rapidly evolving Reagent Inventory Management Systems market, this comprehensive report delves into market dynamics, trends, and future projections, empowering stakeholders with data-driven strategies for growth and operational excellence.
Reagent Inventory Management Systems Market Structure & Competitive Landscape
The Reagent Inventory Management Systems market exhibits a moderate level of concentration, with key players like Smarterlab, Integle, Siemens Healthineers, and LabWare holding significant market shares. Innovation serves as a primary driver, fueled by the continuous need for enhanced efficiency, accuracy, and compliance in scientific and medical settings. Regulatory impacts, particularly concerning laboratory safety, data integrity, and GxP compliance, are shaping product development and adoption. Product substitutes, such as manual tracking systems and generic inventory software, are increasingly being phased out in favor of specialized solutions. The end-user segmentation is diverse, with Scientific Research Institutions and the Medical Industry representing the largest consumers, followed by a growing "Others" category encompassing biotechnology firms and industrial laboratories. Merger and Acquisition (M&A) trends are evident as larger entities seek to consolidate their offerings and expand their market reach, with approximately 15 significant M&A activities recorded during the historical period. This dynamic landscape necessitates a keen understanding of competitive strategies and emerging technologies.
Reagent Inventory Management Systems Market Trends & Opportunities
The global Reagent Inventory Management Systems market is poised for substantial expansion, projected to grow from an estimated $5,000 million in the base year 2025 to $15,000 million by the end of the forecast period in 2033, exhibiting a robust Compound Annual Growth Rate (CAGR) of approximately 12%. This impressive growth is propelled by a confluence of technological advancements, evolving regulatory landscapes, and the increasing complexity of scientific research and healthcare operations. The pervasive adoption of cloud-based solutions is a significant trend, offering enhanced scalability, accessibility, and cost-effectiveness for laboratories of all sizes. This shift towards digital transformation is significantly impacting how reagents are managed, from procurement and storage to utilization and disposal.
Technological shifts are further accelerating market penetration. The integration of Artificial Intelligence (AI) and Machine Learning (ML) into reagent inventory systems is enabling predictive analytics for demand forecasting, proactive identification of expiring reagents, and optimized ordering cycles, thereby minimizing waste and ensuring critical supplies are always available. Internet of Things (IoT) devices, such as smart refrigerators and sensors, are facilitating real-time monitoring of temperature, humidity, and stock levels, further enhancing inventory accuracy and compliance with stringent storage requirements.
Consumer preferences are increasingly leaning towards user-friendly interfaces, seamless integration with existing laboratory information management systems (LIMS), and comprehensive audit trails for regulatory compliance. The demand for specialized functionalities tailored to specific scientific disciplines, such as genomics, proteomics, and drug discovery, is also on the rise. Competitive dynamics are characterized by an intense focus on R&D, strategic partnerships, and the development of comprehensive service offerings. Companies are differentiating themselves through advanced feature sets, robust security protocols, and exceptional customer support. The market penetration rate for advanced reagent inventory management systems is steadily increasing, driven by a growing awareness of the cost savings and operational efficiencies these solutions provide. The historical period from 2019 to 2024 saw a foundational growth phase, establishing the market's potential, with the base year 2025 marking a significant inflection point for accelerated adoption.
Dominant Markets & Segments in Reagent Inventory Management Systems
The Scientific Research Institutions segment stands as the dominant force in the Reagent Inventory Management Systems market, accounting for an estimated 60% of the total market share in the base year 2025. This dominance is driven by the inherent complexity of research workflows, the vast array of specialized reagents required, and the critical need for meticulous inventory control to ensure experimental reproducibility and data integrity. The proliferation of academic research, coupled with increasing government and private funding for scientific endeavors, further bolsters this segment's growth.
Within this segment, key growth drivers include:
- Infrastructure: Expansion of research facilities and the establishment of new laboratories requiring robust inventory management solutions.
- Policies: Government mandates for data traceability and compliance in research, encouraging the adoption of digital inventory systems.
- Technological Advancements: The continuous discovery of new scientific frontiers demands a sophisticated and adaptable inventory management framework.
The Medical Industry represents the second-largest segment, projected to capture approximately 30% of the market by 2025. The increasing demand for accurate diagnostics, personalized medicine, and efficient pharmaceutical development necessitates precise management of a wide range of medical-grade reagents. Stringent regulatory requirements for healthcare facilities, such as those governing blood banks, clinical laboratories, and pharmaceutical manufacturing, further fuel the adoption of advanced inventory management systems.
The Cloud-Based type of Reagent Inventory Management Systems is exhibiting a superior growth trajectory, expected to claim over 70% of the market by 2025. This dominance is attributed to:
- Scalability & Flexibility: Cloud solutions can effortlessly scale to accommodate growing laboratory needs and fluctuating inventory volumes.
- Accessibility: Enables remote access to inventory data, facilitating collaboration and real-time updates from anywhere.
- Cost-Effectiveness: Reduces upfront infrastructure costs and often comes with predictable subscription-based pricing.
- Automatic Updates & Maintenance: Vendors handle software updates and system maintenance, freeing up IT resources.
Conversely, Local-Based systems, while still relevant, are expected to see a gradual decline in market share, primarily in new implementations, as organizations transition to more agile and scalable cloud solutions. The "Others" segment, encompassing biotechnology firms, contract research organizations (CROs), and industrial laboratories, is showing promising growth, driven by specific niche requirements and the increasing adoption of advanced lab technologies.
Reagent Inventory Management Systems Product Analysis
Product innovations in Reagent Inventory Management Systems are centered on enhancing automation, data analytics, and user experience. Companies like LabWare and Scinote are leading the charge with integrated solutions that offer real-time tracking, automated reordering based on usage patterns, and AI-driven expiry date predictions. The competitive advantage lies in systems that seamlessly integrate with LIMS, ERP systems, and other laboratory equipment, providing a unified data ecosystem. Furthermore, advanced features such as barcode and RFID scanning, lot tracking, and quality control integration are becoming standard, ensuring compliance with stringent industry regulations and minimizing human error. The market fit is increasingly defined by customizable workflows and robust reporting capabilities tailored to specific scientific disciplines, from life sciences to materials science.
Key Drivers, Barriers & Challenges in Reagent Inventory Management Systems
Key Drivers:
The Reagent Inventory Management Systems market is propelled by the relentless pursuit of operational efficiency, driven by the need to reduce costs associated with expired or wasted reagents. The increasing complexity of scientific research and pharmaceutical development necessitates precise control over a vast array of chemical and biological substances. Stringent regulatory compliance mandates, particularly in the medical and pharmaceutical sectors, act as a significant catalyst, requiring robust audit trails and accurate inventory records. Technological advancements, including the integration of AI, IoT, and cloud computing, are enabling more sophisticated and automated inventory management solutions.
Barriers & Challenges:
Despite the robust growth, challenges persist. The initial investment in advanced Reagent Inventory Management Systems can be a barrier for smaller institutions with limited budgets. Resistance to change and the learning curve associated with adopting new software can hinder widespread adoption. Integrating these systems with existing legacy laboratory infrastructure can be complex and time-consuming, leading to potential compatibility issues. Furthermore, ensuring data security and privacy, especially with cloud-based solutions, remains a critical concern for organizations handling sensitive research and patient data. Cybersecurity threats and the cost of maintaining data integrity present ongoing challenges, with an estimated 2% of organizations experiencing data breaches annually due to inadequate security measures.
Growth Drivers in the Reagent Inventory Management Systems Market
The Reagent Inventory Management Systems market is experiencing robust growth driven by several key factors. Technological advancements are paramount, with the integration of AI and IoT enabling predictive analytics for demand forecasting, automated reordering, and real-time environmental monitoring of sensitive reagents. Economic factors, such as the rising cost of reagents and the increasing emphasis on cost containment in research and healthcare, make efficient inventory management a critical strategy for reducing waste and optimizing resource allocation. Regulatory drivers, including stringent compliance requirements in pharmaceutical manufacturing and clinical diagnostics, mandate accurate record-keeping and traceability, pushing organizations towards sophisticated inventory solutions. The expansion of scientific research into new frontiers and the growing personalized medicine trend further necessitate advanced inventory control capabilities.
Challenges Impacting Reagent Inventory Management Systems Growth
The growth of the Reagent Inventory Management Systems market is tempered by several significant challenges. Regulatory complexities, particularly across different international jurisdictions, can create hurdles for companies operating globally, requiring adaptation to varied compliance standards. Supply chain issues, exacerbated by global disruptions, can lead to reagent shortages and unpredictable lead times, impacting inventory planning and necessitating more agile management systems. Competitive pressures among vendors drive innovation but can also lead to market fragmentation and pricing challenges. Furthermore, the integration of disparate laboratory systems remains a technical hurdle, often requiring significant customization and investment. The perceived high cost of advanced solutions can also be a barrier to entry for smaller organizations, and a general resistance to adopting new technologies can slow down market penetration.
Key Players Shaping the Reagent Inventory Management Systems Market
- Smarterlab
- Integle
- Siemens Healthineers
- Zhixuan Internet
- Scinote
- LabKey
- Quartzy
- LabWare
- Chanjet
- eLabNext
- QBench
- FindMolecule
- Dataworks Development
- Third Wave Analytics
- ChemInventory
- CyroTrack
Significant Reagent Inventory Management Systems Industry Milestones
- 2019 May: Launch of advanced AI-driven forecasting modules by LabWare, enhancing predictive capabilities for reagent consumption.
- 2020 January: Smarterlab introduces a comprehensive cloud-based platform, significantly increasing accessibility for academic institutions.
- 2021 July: Siemens Healthineers announces strategic acquisition of a key LIMS provider, expanding its integrated laboratory solutions portfolio.
- 2022 April: Integle launches robust IoT integration for real-time temperature monitoring of critical reagents, addressing storage compliance.
- 2023 November: E labNext unveils a new mobile application for on-the-go inventory management and task assignment, improving field laboratory efficiency.
- 2024 February: Quartzy releases enhanced barcode and RFID scanning capabilities, streamlining stock-taking processes for increased accuracy.
Future Outlook for Reagent Inventory Management Systems Market
The future outlook for the Reagent Inventory Management Systems market is exceptionally bright, driven by a sustained demand for greater laboratory efficiency, accuracy, and regulatory compliance. Strategic opportunities lie in the continued integration of advanced technologies such as AI for predictive analytics and IoT for real-time monitoring, further enhancing operational intelligence. The growing focus on personalized medicine and the expansion of biopharmaceutical research will continue to fuel the need for sophisticated inventory solutions tailored to these specialized fields. Market potential will also be unlocked by the increasing adoption of cloud-based platforms, offering scalability and cost-effectiveness to a wider range of organizations. The continuous evolution of regulatory landscapes will further incentivize the adoption of robust and traceable inventory management systems, solidifying their position as indispensable tools in scientific and medical endeavors.
Reagent Inventory Management Systems Segmentation
-
1. Application
- 1.1. Scientific Research Institutions
- 1.2. Medical Industry
- 1.3. Others
-
2. Types
- 2.1. Cloud-Based
- 2.2. Local-Based
Reagent Inventory Management Systems Segmentation By Geography
-
1. North America
- 1.1. United States
- 1.2. Canada
- 1.3. Mexico
-
2. South America
- 2.1. Brazil
- 2.2. Argentina
- 2.3. Rest of South America
-
3. Europe
- 3.1. United Kingdom
- 3.2. Germany
- 3.3. France
- 3.4. Italy
- 3.5. Spain
- 3.6. Russia
- 3.7. Benelux
- 3.8. Nordics
- 3.9. Rest of Europe
-
4. Middle East & Africa
- 4.1. Turkey
- 4.2. Israel
- 4.3. GCC
- 4.4. North Africa
- 4.5. South Africa
- 4.6. Rest of Middle East & Africa
-
5. Asia Pacific
- 5.1. China
- 5.2. India
- 5.3. Japan
- 5.4. South Korea
- 5.5. ASEAN
- 5.6. Oceania
- 5.7. Rest of Asia Pacific
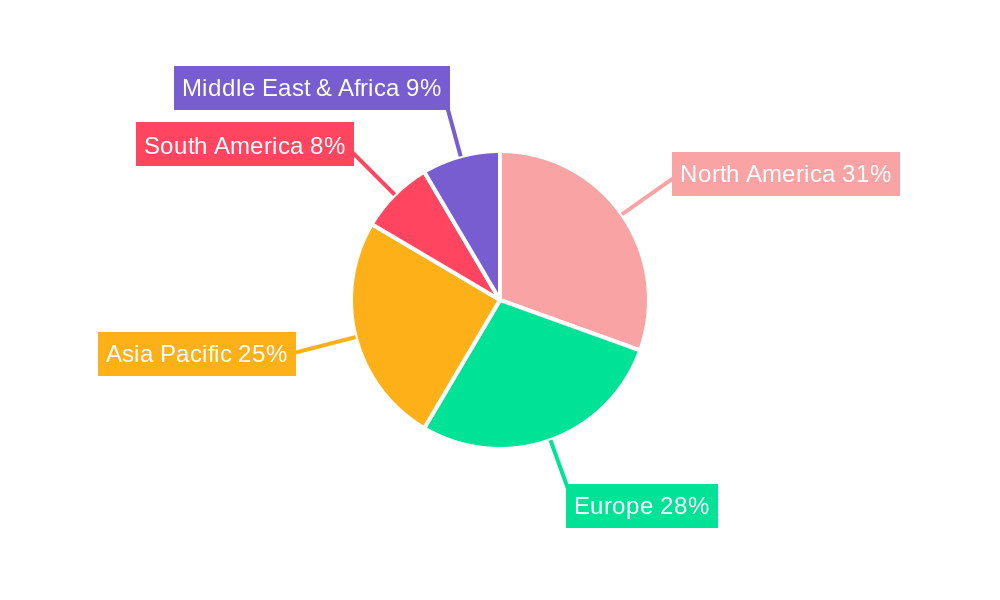
Reagent Inventory Management Systems Regional Market Share
Geographic Coverage of Reagent Inventory Management Systems
Reagent Inventory Management Systems REPORT HIGHLIGHTS
| Aspects | Details |
|---|---|
| Study Period | 2020-2034 |
| Base Year | 2025 |
| Estimated Year | 2026 |
| Forecast Period | 2026-2034 |
| Historical Period | 2020-2025 |
| Growth Rate | CAGR of 7.7% from 2020-2034 |
| Segmentation |
|
Table of Contents
- 1. Introduction
- 1.1. Research Scope
- 1.2. Market Segmentation
- 1.3. Research Methodology
- 1.4. Definitions and Assumptions
- 2. Executive Summary
- 2.1. Introduction
- 3. Market Dynamics
- 3.1. Introduction
- 3.2. Market Drivers
- 3.3. Market Restrains
- 3.4. Market Trends
- 4. Market Factor Analysis
- 4.1. Porters Five Forces
- 4.2. Supply/Value Chain
- 4.3. PESTEL analysis
- 4.4. Market Entropy
- 4.5. Patent/Trademark Analysis
- 5. Global Reagent Inventory Management Systems Analysis, Insights and Forecast, 2020-2032
- 5.1. Market Analysis, Insights and Forecast - by Application
- 5.1.1. Scientific Research Institutions
- 5.1.2. Medical Industry
- 5.1.3. Others
- 5.2. Market Analysis, Insights and Forecast - by Types
- 5.2.1. Cloud-Based
- 5.2.2. Local-Based
- 5.3. Market Analysis, Insights and Forecast - by Region
- 5.3.1. North America
- 5.3.2. South America
- 5.3.3. Europe
- 5.3.4. Middle East & Africa
- 5.3.5. Asia Pacific
- 5.1. Market Analysis, Insights and Forecast - by Application
- 6. North America Reagent Inventory Management Systems Analysis, Insights and Forecast, 2020-2032
- 6.1. Market Analysis, Insights and Forecast - by Application
- 6.1.1. Scientific Research Institutions
- 6.1.2. Medical Industry
- 6.1.3. Others
- 6.2. Market Analysis, Insights and Forecast - by Types
- 6.2.1. Cloud-Based
- 6.2.2. Local-Based
- 6.1. Market Analysis, Insights and Forecast - by Application
- 7. South America Reagent Inventory Management Systems Analysis, Insights and Forecast, 2020-2032
- 7.1. Market Analysis, Insights and Forecast - by Application
- 7.1.1. Scientific Research Institutions
- 7.1.2. Medical Industry
- 7.1.3. Others
- 7.2. Market Analysis, Insights and Forecast - by Types
- 7.2.1. Cloud-Based
- 7.2.2. Local-Based
- 7.1. Market Analysis, Insights and Forecast - by Application
- 8. Europe Reagent Inventory Management Systems Analysis, Insights and Forecast, 2020-2032
- 8.1. Market Analysis, Insights and Forecast - by Application
- 8.1.1. Scientific Research Institutions
- 8.1.2. Medical Industry
- 8.1.3. Others
- 8.2. Market Analysis, Insights and Forecast - by Types
- 8.2.1. Cloud-Based
- 8.2.2. Local-Based
- 8.1. Market Analysis, Insights and Forecast - by Application
- 9. Middle East & Africa Reagent Inventory Management Systems Analysis, Insights and Forecast, 2020-2032
- 9.1. Market Analysis, Insights and Forecast - by Application
- 9.1.1. Scientific Research Institutions
- 9.1.2. Medical Industry
- 9.1.3. Others
- 9.2. Market Analysis, Insights and Forecast - by Types
- 9.2.1. Cloud-Based
- 9.2.2. Local-Based
- 9.1. Market Analysis, Insights and Forecast - by Application
- 10. Asia Pacific Reagent Inventory Management Systems Analysis, Insights and Forecast, 2020-2032
- 10.1. Market Analysis, Insights and Forecast - by Application
- 10.1.1. Scientific Research Institutions
- 10.1.2. Medical Industry
- 10.1.3. Others
- 10.2. Market Analysis, Insights and Forecast - by Types
- 10.2.1. Cloud-Based
- 10.2.2. Local-Based
- 10.1. Market Analysis, Insights and Forecast - by Application
- 11. Competitive Analysis
- 11.1. Global Market Share Analysis 2025
- 11.2. Company Profiles
- 11.2.1 Smarterlab
- 11.2.1.1. Overview
- 11.2.1.2. Products
- 11.2.1.3. SWOT Analysis
- 11.2.1.4. Recent Developments
- 11.2.1.5. Financials (Based on Availability)
- 11.2.2 Integle
- 11.2.2.1. Overview
- 11.2.2.2. Products
- 11.2.2.3. SWOT Analysis
- 11.2.2.4. Recent Developments
- 11.2.2.5. Financials (Based on Availability)
- 11.2.3 Siemens Healthineers
- 11.2.3.1. Overview
- 11.2.3.2. Products
- 11.2.3.3. SWOT Analysis
- 11.2.3.4. Recent Developments
- 11.2.3.5. Financials (Based on Availability)
- 11.2.4 Zhixuan Internet
- 11.2.4.1. Overview
- 11.2.4.2. Products
- 11.2.4.3. SWOT Analysis
- 11.2.4.4. Recent Developments
- 11.2.4.5. Financials (Based on Availability)
- 11.2.5 Scinote
- 11.2.5.1. Overview
- 11.2.5.2. Products
- 11.2.5.3. SWOT Analysis
- 11.2.5.4. Recent Developments
- 11.2.5.5. Financials (Based on Availability)
- 11.2.6 LabKey
- 11.2.6.1. Overview
- 11.2.6.2. Products
- 11.2.6.3. SWOT Analysis
- 11.2.6.4. Recent Developments
- 11.2.6.5. Financials (Based on Availability)
- 11.2.7 Quartzy
- 11.2.7.1. Overview
- 11.2.7.2. Products
- 11.2.7.3. SWOT Analysis
- 11.2.7.4. Recent Developments
- 11.2.7.5. Financials (Based on Availability)
- 11.2.8 LabWare
- 11.2.8.1. Overview
- 11.2.8.2. Products
- 11.2.8.3. SWOT Analysis
- 11.2.8.4. Recent Developments
- 11.2.8.5. Financials (Based on Availability)
- 11.2.9 Chanjet
- 11.2.9.1. Overview
- 11.2.9.2. Products
- 11.2.9.3. SWOT Analysis
- 11.2.9.4. Recent Developments
- 11.2.9.5. Financials (Based on Availability)
- 11.2.10 eLabNext
- 11.2.10.1. Overview
- 11.2.10.2. Products
- 11.2.10.3. SWOT Analysis
- 11.2.10.4. Recent Developments
- 11.2.10.5. Financials (Based on Availability)
- 11.2.11 QBench
- 11.2.11.1. Overview
- 11.2.11.2. Products
- 11.2.11.3. SWOT Analysis
- 11.2.11.4. Recent Developments
- 11.2.11.5. Financials (Based on Availability)
- 11.2.12 FindMolecule
- 11.2.12.1. Overview
- 11.2.12.2. Products
- 11.2.12.3. SWOT Analysis
- 11.2.12.4. Recent Developments
- 11.2.12.5. Financials (Based on Availability)
- 11.2.13 Dataworks Development
- 11.2.13.1. Overview
- 11.2.13.2. Products
- 11.2.13.3. SWOT Analysis
- 11.2.13.4. Recent Developments
- 11.2.13.5. Financials (Based on Availability)
- 11.2.14 Third Wave Analytics
- 11.2.14.1. Overview
- 11.2.14.2. Products
- 11.2.14.3. SWOT Analysis
- 11.2.14.4. Recent Developments
- 11.2.14.5. Financials (Based on Availability)
- 11.2.15 ChemInventory
- 11.2.15.1. Overview
- 11.2.15.2. Products
- 11.2.15.3. SWOT Analysis
- 11.2.15.4. Recent Developments
- 11.2.15.5. Financials (Based on Availability)
- 11.2.16 CyroTrack
- 11.2.16.1. Overview
- 11.2.16.2. Products
- 11.2.16.3. SWOT Analysis
- 11.2.16.4. Recent Developments
- 11.2.16.5. Financials (Based on Availability)
- 11.2.1 Smarterlab
List of Figures
- Figure 1: Global Reagent Inventory Management Systems Revenue Breakdown (million, %) by Region 2025 & 2033
- Figure 2: North America Reagent Inventory Management Systems Revenue (million), by Application 2025 & 2033
- Figure 3: North America Reagent Inventory Management Systems Revenue Share (%), by Application 2025 & 2033
- Figure 4: North America Reagent Inventory Management Systems Revenue (million), by Types 2025 & 2033
- Figure 5: North America Reagent Inventory Management Systems Revenue Share (%), by Types 2025 & 2033
- Figure 6: North America Reagent Inventory Management Systems Revenue (million), by Country 2025 & 2033
- Figure 7: North America Reagent Inventory Management Systems Revenue Share (%), by Country 2025 & 2033
- Figure 8: South America Reagent Inventory Management Systems Revenue (million), by Application 2025 & 2033
- Figure 9: South America Reagent Inventory Management Systems Revenue Share (%), by Application 2025 & 2033
- Figure 10: South America Reagent Inventory Management Systems Revenue (million), by Types 2025 & 2033
- Figure 11: South America Reagent Inventory Management Systems Revenue Share (%), by Types 2025 & 2033
- Figure 12: South America Reagent Inventory Management Systems Revenue (million), by Country 2025 & 2033
- Figure 13: South America Reagent Inventory Management Systems Revenue Share (%), by Country 2025 & 2033
- Figure 14: Europe Reagent Inventory Management Systems Revenue (million), by Application 2025 & 2033
- Figure 15: Europe Reagent Inventory Management Systems Revenue Share (%), by Application 2025 & 2033
- Figure 16: Europe Reagent Inventory Management Systems Revenue (million), by Types 2025 & 2033
- Figure 17: Europe Reagent Inventory Management Systems Revenue Share (%), by Types 2025 & 2033
- Figure 18: Europe Reagent Inventory Management Systems Revenue (million), by Country 2025 & 2033
- Figure 19: Europe Reagent Inventory Management Systems Revenue Share (%), by Country 2025 & 2033
- Figure 20: Middle East & Africa Reagent Inventory Management Systems Revenue (million), by Application 2025 & 2033
- Figure 21: Middle East & Africa Reagent Inventory Management Systems Revenue Share (%), by Application 2025 & 2033
- Figure 22: Middle East & Africa Reagent Inventory Management Systems Revenue (million), by Types 2025 & 2033
- Figure 23: Middle East & Africa Reagent Inventory Management Systems Revenue Share (%), by Types 2025 & 2033
- Figure 24: Middle East & Africa Reagent Inventory Management Systems Revenue (million), by Country 2025 & 2033
- Figure 25: Middle East & Africa Reagent Inventory Management Systems Revenue Share (%), by Country 2025 & 2033
- Figure 26: Asia Pacific Reagent Inventory Management Systems Revenue (million), by Application 2025 & 2033
- Figure 27: Asia Pacific Reagent Inventory Management Systems Revenue Share (%), by Application 2025 & 2033
- Figure 28: Asia Pacific Reagent Inventory Management Systems Revenue (million), by Types 2025 & 2033
- Figure 29: Asia Pacific Reagent Inventory Management Systems Revenue Share (%), by Types 2025 & 2033
- Figure 30: Asia Pacific Reagent Inventory Management Systems Revenue (million), by Country 2025 & 2033
- Figure 31: Asia Pacific Reagent Inventory Management Systems Revenue Share (%), by Country 2025 & 2033
List of Tables
- Table 1: Global Reagent Inventory Management Systems Revenue million Forecast, by Application 2020 & 2033
- Table 2: Global Reagent Inventory Management Systems Revenue million Forecast, by Types 2020 & 2033
- Table 3: Global Reagent Inventory Management Systems Revenue million Forecast, by Region 2020 & 2033
- Table 4: Global Reagent Inventory Management Systems Revenue million Forecast, by Application 2020 & 2033
- Table 5: Global Reagent Inventory Management Systems Revenue million Forecast, by Types 2020 & 2033
- Table 6: Global Reagent Inventory Management Systems Revenue million Forecast, by Country 2020 & 2033
- Table 7: United States Reagent Inventory Management Systems Revenue (million) Forecast, by Application 2020 & 2033
- Table 8: Canada Reagent Inventory Management Systems Revenue (million) Forecast, by Application 2020 & 2033
- Table 9: Mexico Reagent Inventory Management Systems Revenue (million) Forecast, by Application 2020 & 2033
- Table 10: Global Reagent Inventory Management Systems Revenue million Forecast, by Application 2020 & 2033
- Table 11: Global Reagent Inventory Management Systems Revenue million Forecast, by Types 2020 & 2033
- Table 12: Global Reagent Inventory Management Systems Revenue million Forecast, by Country 2020 & 2033
- Table 13: Brazil Reagent Inventory Management Systems Revenue (million) Forecast, by Application 2020 & 2033
- Table 14: Argentina Reagent Inventory Management Systems Revenue (million) Forecast, by Application 2020 & 2033
- Table 15: Rest of South America Reagent Inventory Management Systems Revenue (million) Forecast, by Application 2020 & 2033
- Table 16: Global Reagent Inventory Management Systems Revenue million Forecast, by Application 2020 & 2033
- Table 17: Global Reagent Inventory Management Systems Revenue million Forecast, by Types 2020 & 2033
- Table 18: Global Reagent Inventory Management Systems Revenue million Forecast, by Country 2020 & 2033
- Table 19: United Kingdom Reagent Inventory Management Systems Revenue (million) Forecast, by Application 2020 & 2033
- Table 20: Germany Reagent Inventory Management Systems Revenue (million) Forecast, by Application 2020 & 2033
- Table 21: France Reagent Inventory Management Systems Revenue (million) Forecast, by Application 2020 & 2033
- Table 22: Italy Reagent Inventory Management Systems Revenue (million) Forecast, by Application 2020 & 2033
- Table 23: Spain Reagent Inventory Management Systems Revenue (million) Forecast, by Application 2020 & 2033
- Table 24: Russia Reagent Inventory Management Systems Revenue (million) Forecast, by Application 2020 & 2033
- Table 25: Benelux Reagent Inventory Management Systems Revenue (million) Forecast, by Application 2020 & 2033
- Table 26: Nordics Reagent Inventory Management Systems Revenue (million) Forecast, by Application 2020 & 2033
- Table 27: Rest of Europe Reagent Inventory Management Systems Revenue (million) Forecast, by Application 2020 & 2033
- Table 28: Global Reagent Inventory Management Systems Revenue million Forecast, by Application 2020 & 2033
- Table 29: Global Reagent Inventory Management Systems Revenue million Forecast, by Types 2020 & 2033
- Table 30: Global Reagent Inventory Management Systems Revenue million Forecast, by Country 2020 & 2033
- Table 31: Turkey Reagent Inventory Management Systems Revenue (million) Forecast, by Application 2020 & 2033
- Table 32: Israel Reagent Inventory Management Systems Revenue (million) Forecast, by Application 2020 & 2033
- Table 33: GCC Reagent Inventory Management Systems Revenue (million) Forecast, by Application 2020 & 2033
- Table 34: North Africa Reagent Inventory Management Systems Revenue (million) Forecast, by Application 2020 & 2033
- Table 35: South Africa Reagent Inventory Management Systems Revenue (million) Forecast, by Application 2020 & 2033
- Table 36: Rest of Middle East & Africa Reagent Inventory Management Systems Revenue (million) Forecast, by Application 2020 & 2033
- Table 37: Global Reagent Inventory Management Systems Revenue million Forecast, by Application 2020 & 2033
- Table 38: Global Reagent Inventory Management Systems Revenue million Forecast, by Types 2020 & 2033
- Table 39: Global Reagent Inventory Management Systems Revenue million Forecast, by Country 2020 & 2033
- Table 40: China Reagent Inventory Management Systems Revenue (million) Forecast, by Application 2020 & 2033
- Table 41: India Reagent Inventory Management Systems Revenue (million) Forecast, by Application 2020 & 2033
- Table 42: Japan Reagent Inventory Management Systems Revenue (million) Forecast, by Application 2020 & 2033
- Table 43: South Korea Reagent Inventory Management Systems Revenue (million) Forecast, by Application 2020 & 2033
- Table 44: ASEAN Reagent Inventory Management Systems Revenue (million) Forecast, by Application 2020 & 2033
- Table 45: Oceania Reagent Inventory Management Systems Revenue (million) Forecast, by Application 2020 & 2033
- Table 46: Rest of Asia Pacific Reagent Inventory Management Systems Revenue (million) Forecast, by Application 2020 & 2033
Frequently Asked Questions
1. What is the projected Compound Annual Growth Rate (CAGR) of the Reagent Inventory Management Systems?
The projected CAGR is approximately 7.7%.
2. Which companies are prominent players in the Reagent Inventory Management Systems?
Key companies in the market include Smarterlab, Integle, Siemens Healthineers, Zhixuan Internet, Scinote, LabKey, Quartzy, LabWare, Chanjet, eLabNext, QBench, FindMolecule, Dataworks Development, Third Wave Analytics, ChemInventory, CyroTrack.
3. What are the main segments of the Reagent Inventory Management Systems?
The market segments include Application, Types.
4. Can you provide details about the market size?
The market size is estimated to be USD 658 million as of 2022.
5. What are some drivers contributing to market growth?
N/A
6. What are the notable trends driving market growth?
N/A
7. Are there any restraints impacting market growth?
N/A
8. Can you provide examples of recent developments in the market?
N/A
9. What pricing options are available for accessing the report?
Pricing options include single-user, multi-user, and enterprise licenses priced at USD 2900.00, USD 4350.00, and USD 5800.00 respectively.
10. Is the market size provided in terms of value or volume?
The market size is provided in terms of value, measured in million.
11. Are there any specific market keywords associated with the report?
Yes, the market keyword associated with the report is "Reagent Inventory Management Systems," which aids in identifying and referencing the specific market segment covered.
12. How do I determine which pricing option suits my needs best?
The pricing options vary based on user requirements and access needs. Individual users may opt for single-user licenses, while businesses requiring broader access may choose multi-user or enterprise licenses for cost-effective access to the report.
13. Are there any additional resources or data provided in the Reagent Inventory Management Systems report?
While the report offers comprehensive insights, it's advisable to review the specific contents or supplementary materials provided to ascertain if additional resources or data are available.
14. How can I stay updated on further developments or reports in the Reagent Inventory Management Systems?
To stay informed about further developments, trends, and reports in the Reagent Inventory Management Systems, consider subscribing to industry newsletters, following relevant companies and organizations, or regularly checking reputable industry news sources and publications.
Methodology
Step 1 - Identification of Relevant Samples Size from Population Database


Step 2 - Approaches for Defining Global Market Size (Value, Volume* & Price*)

Note*: In applicable scenarios
Step 3 - Data Sources
Primary Research
- Web Analytics
- Survey Reports
- Research Institute
- Latest Research Reports
- Opinion Leaders
Secondary Research
- Annual Reports
- White Paper
- Latest Press Release
- Industry Association
- Paid Database
- Investor Presentations

Step 4 - Data Triangulation
Involves using different sources of information in order to increase the validity of a study
These sources are likely to be stakeholders in a program - participants, other researchers, program staff, other community members, and so on.
Then we put all data in single framework & apply various statistical tools to find out the dynamic on the market.
During the analysis stage, feedback from the stakeholder groups would be compared to determine areas of agreement as well as areas of divergence