

Key Insights
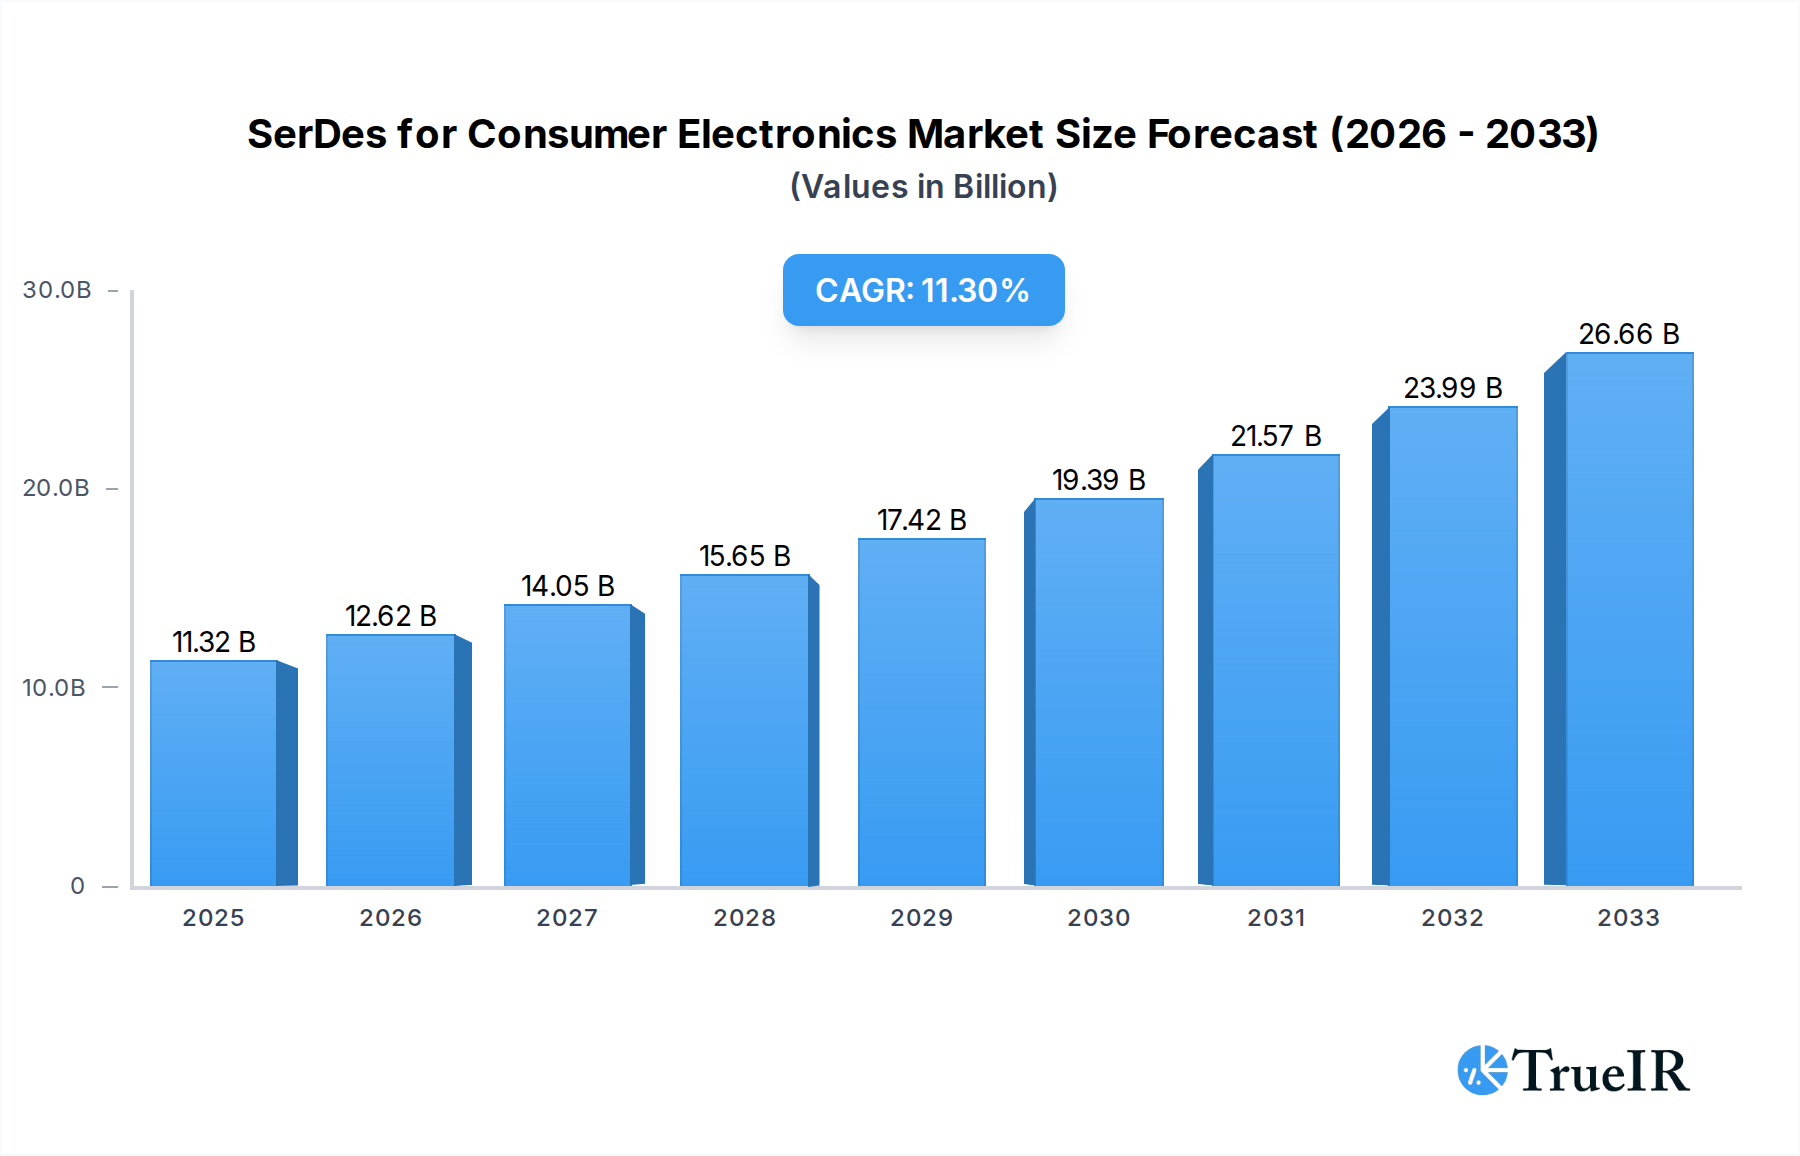
The SerDes (Serializer/Deserializer) market for consumer electronics is poised for significant expansion, projected to reach $11.32 billion by 2025. This growth is underpinned by a robust CAGR of 11.29% throughout the forecast period of 2025-2033. The escalating demand for higher bandwidth and faster data transmission speeds within an ever-increasing array of consumer devices serves as a primary catalyst. Key applications such as mobile phones and computers, cameras, and televisions are continuously pushing the boundaries of data throughput, necessitating advanced SerDes solutions for seamless connectivity and enhanced user experiences. Furthermore, the proliferation of high-definition content, immersive gaming, and advanced display technologies directly fuels the need for efficient SerDes integration to manage the massive data flows involved. The growing adoption of 5G technology, with its inherent demand for rapid data exchange, also plays a crucial role in driving SerDes adoption within the consumer electronics sector.

SerDes for Consumer Electronics Market Size (In Billion)
The market is characterized by dynamic trends and evolving technological landscapes. Innovations in SerDes technology, including reduced power consumption, smaller form factors, and increased integration capabilities, are key differentiators for market players. The rising popularity of wearable devices, smart home ecosystems, and the Internet of Things (IoT) further broadens the application scope for SerDes. While the market exhibits strong growth, potential restraints such as the high cost of advanced SerDes integration in certain price-sensitive consumer segments and the complexity of design and implementation can pose challenges. However, the continuous drive towards miniaturization, energy efficiency, and superior performance in consumer electronics ensures that SerDes technology remains a critical enabler, with companies like Texas Instruments, Maxim Integrated, and ON Semiconductor leading the charge in delivering innovative solutions to meet these evolving demands across the globe.
SerDes for Consumer Electronics Company Market Share
This comprehensive SerDes for Consumer Electronics market report delivers an in-depth analysis of the Serializer/Deserializer landscape, crucial for enabling high-speed data transmission in a vast array of consumer devices. Our research forecasts substantial growth, driven by the insatiable demand for richer multimedia experiences, advanced mobile computing, and the proliferation of connected home ecosystems. With a study period spanning 2019 to 2033, a base year of 2025, and a forecast period from 2025 to 2033, this report provides actionable intelligence for stakeholders seeking to capitalize on emerging opportunities in this dynamic sector. We meticulously examine market size, growth trends, technological advancements, competitive strategies, and regional dominance, offering a definitive guide for Semiconductor Manufacturers, IP Providers, System Integrators, and Consumer Electronics OEMs.
SerDes for Consumer Electronics Market Structure & Competitive Landscape
The SerDes for Consumer Electronics market exhibits a moderately concentrated structure, with key players like Texas Instruments, Maxim Integrated, ON Semiconductor, NXP, and ROHM Semiconductor holding significant market share. Innovation drivers are primarily fueled by the relentless pursuit of higher bandwidth, lower power consumption, and miniaturization to meet the demands of next-generation consumer devices. Regulatory impacts, while less direct than in industrial or automotive sectors, influence standardization efforts for interoperability and safety. Product substitutes are largely limited to alternative interface technologies for specific applications, but the inherent efficiency of SerDes for high-speed data makes it indispensable. End-user segmentation reveals the paramount importance of the Mobile Phone and Computer segment, followed by Television and Camera applications. Mergers and acquisitions (M&A) trends, including the acquisition of Cypress by Infineon and Intesil by Renesas, indicate a consolidation strategy among larger players to expand their IP portfolios and market reach. The number of significant M&A activities in the past five years has been approximately 10, contributing to market consolidation. The concentration ratio for the top 5 players is estimated to be around 65 billion.
SerDes for Consumer Electronics Market Trends & Opportunities
The global SerDes for Consumer Electronics market is poised for remarkable expansion, projected to witness a Compound Annual Growth Rate (CAGR) of approximately 12.50% from 2025 to 2033, reaching an estimated market value of over 85 billion by the end of the forecast period. This growth is intrinsically linked to the burgeoning demand for enhanced consumer experiences, where faster and more efficient data transfer is paramount. The advent of 5G technology, the increasing adoption of 8K televisions, and the evolution of virtual and augmented reality (VR/AR) devices are creating an insatiable appetite for high-bandwidth interfaces, directly benefiting the SerDes market. Furthermore, the proliferation of sophisticated mobile devices, including smartphones and tablets with advanced camera systems and high-resolution displays, necessitates robust SerDes solutions. The shift towards miniaturization and energy efficiency in portable electronics also presents a significant opportunity for SerDes providers to innovate and offer compact, low-power designs. IP Core SerDes solutions are gaining traction as system-on-chip (SoC) designs become more prevalent, allowing for greater integration and flexibility. The increasing complexity of display technologies, such as flexible screens and micro-LED displays, requires advanced SerDes capabilities for signal integrity. The market penetration rate for SerDes in the consumer electronics sector is expected to rise from approximately 70 billion in 2025 to over 85 billion by 2033. Competitive dynamics are characterized by fierce innovation, with companies continually striving to develop SerDes solutions that offer higher data rates (e.g., 100 Gbps and beyond), lower latency, and superior power efficiency. The integration of SerDes IPs into SoCs for application processors in mobile devices and chipsets for smart TVs is a key trend, driving market growth and increasing the competitive edge for integrated solution providers. The demand for robust signal integrity in increasingly noisy environments within consumer devices also fuels innovation in SerDes equalization and jitter cancellation techniques.
Dominant Markets & Segments in SerDes for Consumer Electronics
The Mobile Phone and Computer segment undeniably dominates the SerDes for Consumer Electronics market, driven by the sheer volume of devices and the ever-increasing need for faster data throughput. This segment is expected to account for over 50 billion of the market value by 2033. Key growth drivers include the demand for higher resolution displays, faster data storage and retrieval, and the seamless connectivity required for complex mobile applications and gaming. Within this segment, the Type: Stand-Alone SerDes solutions are prevalent in discrete chipset designs, while IP Core SerDes are increasingly integrated into System-on-Chips (SoCs) for mobile processors and graphics processing units (GPUs), offering a significant competitive advantage in terms of integration and cost-effectiveness. The Television segment also represents a substantial market, with the transition to 4K and 8K resolutions, HDR content, and the integration of advanced smart TV functionalities demanding higher bandwidth SerDes for display interfaces and internal data routing. The Camera segment, encompassing both professional video cameras and advanced smartphone camera modules, relies heavily on SerDes for high-speed image sensor interfaces and data transmission to image processing units. The Other application segment, which includes devices like printers, wearables, and gaming consoles, also contributes to market growth, each with unique SerDes requirements. Geographically, Asia-Pacific is the leading region, driven by its robust consumer electronics manufacturing base and high consumer adoption rates of new technologies. Countries like China, South Korea, and Taiwan are pivotal in this dominance. Emerging markets in Southeast Asia also present significant growth opportunities. Infrastructure development, particularly in high-speed networking and display technology advancements, directly fuels the demand for advanced SerDes solutions. Policies promoting technological innovation and consumer electronics manufacturing further bolster the market in leading regions.
SerDes for Consumer Electronics Product Analysis
Product innovations in SerDes for consumer electronics are centered on achieving higher data rates exceeding 100 Gbps, enabling lower power consumption (e.g., sub-milliwatts per Gbps), and enhancing signal integrity through advanced equalization and pre-emphasis techniques. These advancements are crucial for supporting next-generation displays, faster storage interfaces, and immersive multimedia experiences. Competitive advantages are derived from offering highly integrated IP cores for SoC designs, reducing form factors and bill of materials for consumer devices, and providing robust solutions that minimize bit error rates in complex electromagnetic environments.
Key Drivers, Barriers & Challenges in SerDes for Consumer Electronics
Key Drivers:
- Explosive growth in demand for high-resolution displays (4K, 8K) and immersive media experiences (VR/AR), necessitating higher bandwidth.
- Proliferation of 5G technology and connected devices, creating a need for faster data transfer between components and to the network.
- Miniaturization and power efficiency demands in mobile and portable electronics, pushing for compact and low-power SerDes solutions.
- Increasing complexity of consumer electronics devices, requiring efficient internal data routing and interfaces.
Barriers & Challenges:
- Supply chain disruptions and component shortages, impacting manufacturing timelines and costs. An estimated impact of supply chain disruptions has led to a 5-10 billion dollar increase in production costs for some manufacturers in recent years.
- Intense price competition and commoditization pressures within the consumer electronics market.
- Rapid technological obsolescence, requiring continuous investment in R&D and product development.
- Stringent power consumption requirements, especially for battery-powered devices.
- Navigating complex intellectual property (IP) landscapes and ensuring interoperability.
Growth Drivers in the SerDes for Consumer Electronics Market
The SerDes for Consumer Electronics market is propelled by several key growth drivers. Technologically, the relentless push for higher resolution displays, from 4K to 8K and beyond, directly translates into a demand for SerDes solutions capable of handling immense bandwidth. The widespread adoption of 5G technology fuels the need for faster data transfer within devices and between connected ecosystems. Economically, the increasing disposable income globally and the consumer's desire for cutting-edge entertainment and communication devices are significant catalysts. Regulatory factors, such as evolving standards for display interfaces and data transfer protocols, also encourage the adoption of advanced SerDes technologies. The growth of the Internet of Things (IoT) and smart home devices further expands the application scope for SerDes.
Challenges Impacting SerDes for Consumer Electronics Growth
Despite strong growth prospects, the SerDes for Consumer Electronics market faces several challenges. Supply chain volatility and the ongoing global semiconductor shortage continue to pose significant risks to production volumes and lead times, potentially impacting revenue by 15-20 billion in lost sales opportunities for some firms. Regulatory complexities, while often driving innovation, can also create hurdles in terms of compliance and standardization across different regions. Competitive pressures are immense, with numerous established players and emerging startups vying for market share, leading to pricing challenges. Furthermore, the rapid pace of technological advancement necessitates continuous and substantial investment in research and development to remain competitive.
Key Players Shaping the SerDes for Consumer Electronics Market
- Texas Instruments
- Maxim Integrated
- ON Semiconductor
- NXP Semiconductors
- ROHM Semiconductor
- Cypress (Infineon)
- Intesil (Renesas)
- Semtech
- Vitesse (Microsemi)
- Faraday Technology
- Inova Semiconductors
- THine Electronics
Significant SerDes for Consumer Electronics Industry Milestones
- 2019: Launch of new SerDes solutions supporting 112 Gbps PAM4 signaling for high-end consumer applications.
- 2020: Increased integration of SerDes IP cores into mobile SoC designs for enhanced performance and reduced power consumption.
- 2021: Growing adoption of SerDes for camera interfaces in smartphones to support advanced multi-lens systems and higher resolution sensors.
- 2022: Development of ultra-low power SerDes technologies for wearable devices and compact consumer electronics.
- 2023: Expansion of SerDes applications in smart home devices and IoT gateways to enable seamless data flow.
- 2024: Introduction of advanced SerDes with enhanced signal integrity features to combat noise in complex consumer device environments.
Future Outlook for SerDes for Consumer Electronics Market
The future outlook for the SerDes for Consumer Electronics market is exceptionally bright, fueled by an ongoing wave of technological innovation and escalating consumer demand for richer digital experiences. Strategic opportunities lie in the development of even higher bandwidth SerDes solutions capable of supporting future display technologies and immersive VR/AR applications. The increasing integration of AI and machine learning into consumer devices will also create new demands for efficient data processing and communication, further boosting the SerDes market. Companies that can offer highly integrated, low-power, and cost-effective SerDes solutions will be well-positioned to capture significant market share. The continued growth of the mobile phone and computer segments, coupled with emerging applications in the metaverse and advanced gaming, promises sustained expansion for years to come.
SerDes for Consumer Electronics Segmentation
-
1. Application
- 1.1. Mobile Phone and Computer
- 1.2. Camera
- 1.3. Television
- 1.4. Printer
- 1.5. Other
-
2. Types
- 2.1. Stand-Alone SerDes
- 2.2. IP Core SerDes
SerDes for Consumer Electronics Segmentation By Geography
-
1. North America
- 1.1. United States
- 1.2. Canada
- 1.3. Mexico
-
2. South America
- 2.1. Brazil
- 2.2. Argentina
- 2.3. Rest of South America
-
3. Europe
- 3.1. United Kingdom
- 3.2. Germany
- 3.3. France
- 3.4. Italy
- 3.5. Spain
- 3.6. Russia
- 3.7. Benelux
- 3.8. Nordics
- 3.9. Rest of Europe
-
4. Middle East & Africa
- 4.1. Turkey
- 4.2. Israel
- 4.3. GCC
- 4.4. North Africa
- 4.5. South Africa
- 4.6. Rest of Middle East & Africa
-
5. Asia Pacific
- 5.1. China
- 5.2. India
- 5.3. Japan
- 5.4. South Korea
- 5.5. ASEAN
- 5.6. Oceania
- 5.7. Rest of Asia Pacific
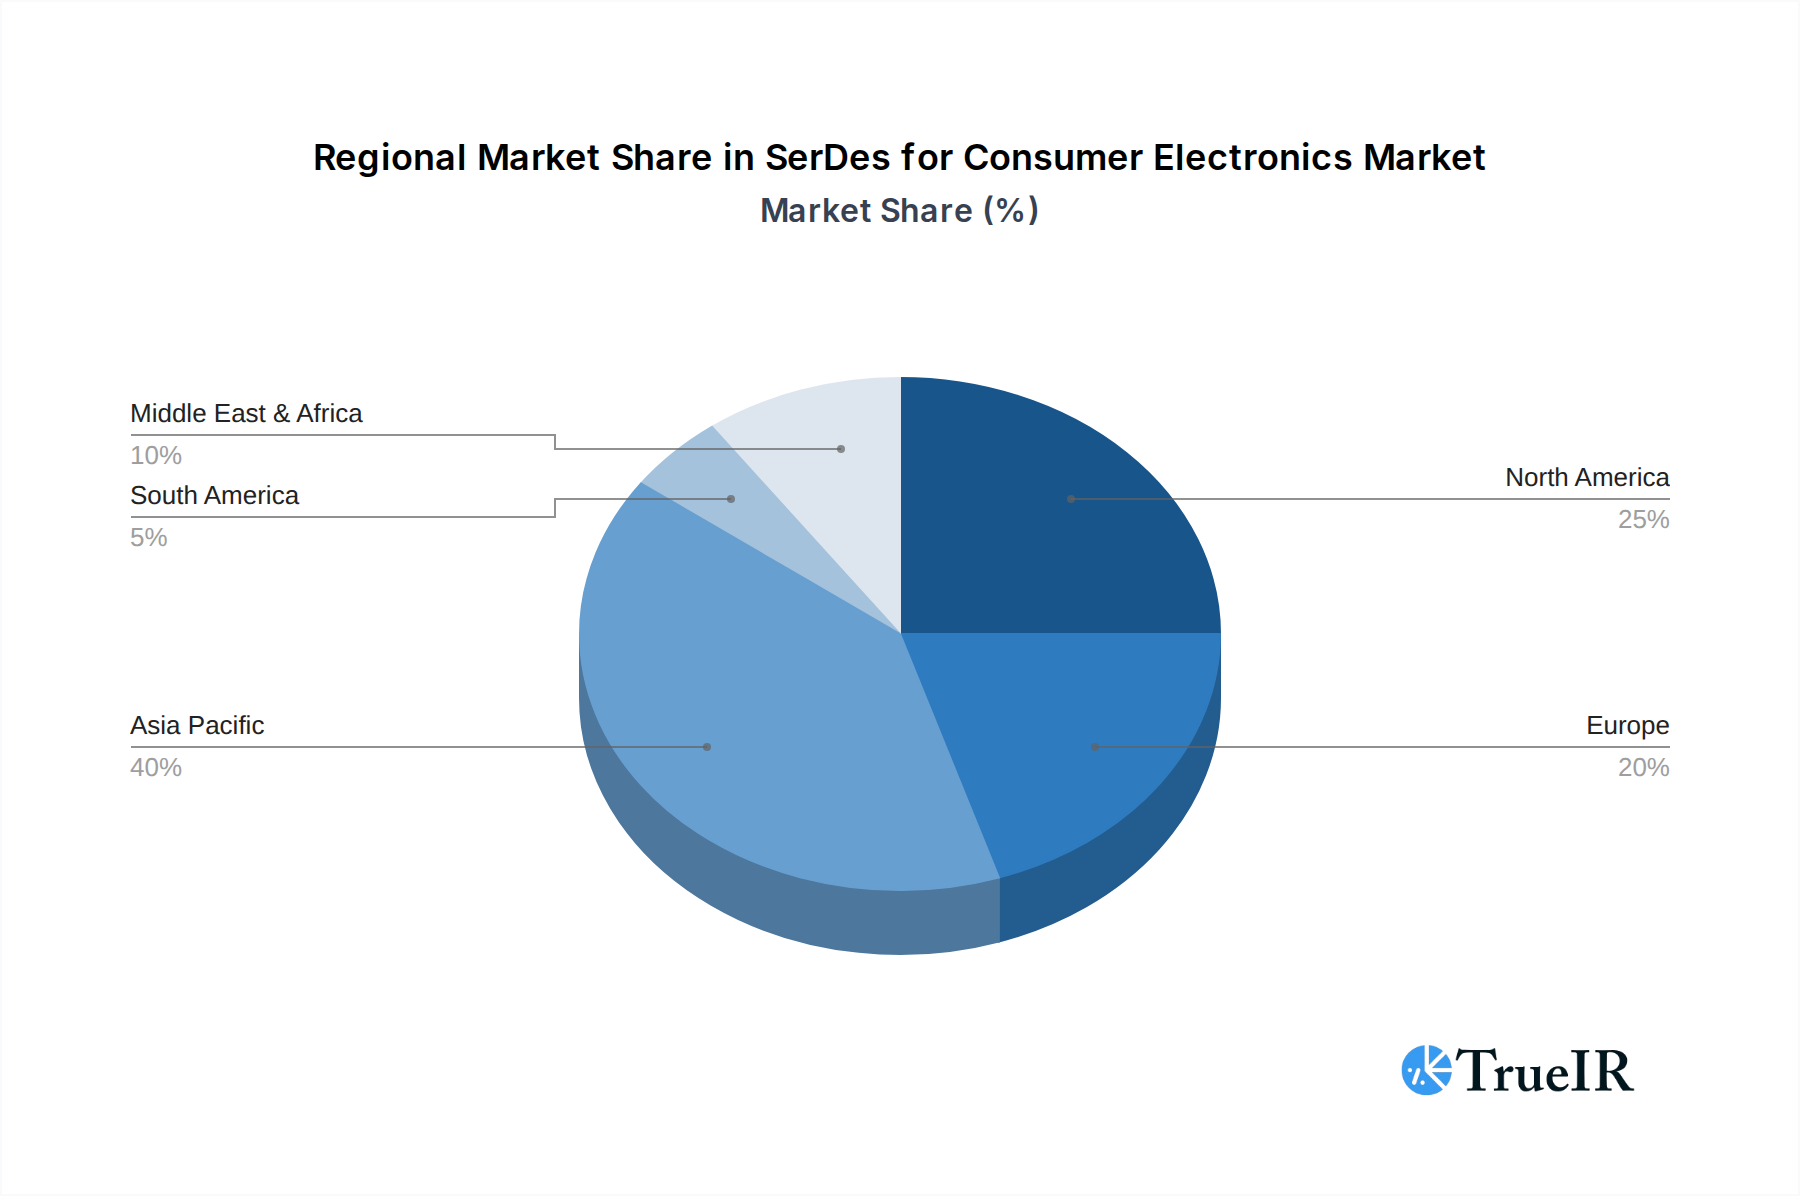
SerDes for Consumer Electronics Regional Market Share
Geographic Coverage of SerDes for Consumer Electronics
SerDes for Consumer Electronics REPORT HIGHLIGHTS
| Aspects | Details |
|---|---|
| Study Period | 2020-2034 |
| Base Year | 2025 |
| Estimated Year | 2026 |
| Forecast Period | 2026-2034 |
| Historical Period | 2020-2025 |
| Growth Rate | CAGR of 11.29% from 2020-2034 |
| Segmentation |
|
Table of Contents
- 1. Introduction
- 1.1. Research Scope
- 1.2. Market Segmentation
- 1.3. Research Objective
- 1.4. Definitions and Assumptions
- 2. Executive Summary
- 2.1. Market Snapshot
- 3. Market Dynamics
- 3.1. Market Drivers
- 3.2. Market Restrains
- 3.3. Market Trends
- 3.4. Market Opportunities
- 4. Market Factor Analysis
- 4.1. Porters Five Forces
- 4.1.1. Bargaining Power of Suppliers
- 4.1.2. Bargaining Power of Buyers
- 4.1.3. Threat of New Entrants
- 4.1.4. Threat of Substitutes
- 4.1.5. Competitive Rivalry
- 4.2. PESTEL analysis
- 4.3. BCG Analysis
- 4.3.1. Stars (High Growth, High Market Share)
- 4.3.2. Cash Cows (Low Growth, High Market Share)
- 4.3.3. Question Mark (High Growth, Low Market Share)
- 4.3.4. Dogs (Low Growth, Low Market Share)
- 4.4. Ansoff Matrix Analysis
- 4.5. Supply Chain Analysis
- 4.6. Regulatory Landscape
- 4.7. Current Market Potential and Opportunity Assessment (TAM–SAM–SOM Framework)
- 4.8. TIR Analyst Note
- 4.1. Porters Five Forces
- 5. Market Analysis, Insights and Forecast 2021-2033
- 5.1. Market Analysis, Insights and Forecast - by Application
- 5.1.1. Mobile Phone and Computer
- 5.1.2. Camera
- 5.1.3. Television
- 5.1.4. Printer
- 5.1.5. Other
- 5.2. Market Analysis, Insights and Forecast - by Types
- 5.2.1. Stand-Alone SerDes
- 5.2.2. IP Core SerDes
- 5.3. Market Analysis, Insights and Forecast - by Region
- 5.3.1. North America
- 5.3.2. South America
- 5.3.3. Europe
- 5.3.4. Middle East & Africa
- 5.3.5. Asia Pacific
- 5.1. Market Analysis, Insights and Forecast - by Application
- 6. Global SerDes for Consumer Electronics Analysis, Insights and Forecast, 2021-2033
- 6.1. Market Analysis, Insights and Forecast - by Application
- 6.1.1. Mobile Phone and Computer
- 6.1.2. Camera
- 6.1.3. Television
- 6.1.4. Printer
- 6.1.5. Other
- 6.2. Market Analysis, Insights and Forecast - by Types
- 6.2.1. Stand-Alone SerDes
- 6.2.2. IP Core SerDes
- 6.1. Market Analysis, Insights and Forecast - by Application
- 7. North America SerDes for Consumer Electronics Analysis, Insights and Forecast, 2020-2032
- 7.1. Market Analysis, Insights and Forecast - by Application
- 7.1.1. Mobile Phone and Computer
- 7.1.2. Camera
- 7.1.3. Television
- 7.1.4. Printer
- 7.1.5. Other
- 7.2. Market Analysis, Insights and Forecast - by Types
- 7.2.1. Stand-Alone SerDes
- 7.2.2. IP Core SerDes
- 7.1. Market Analysis, Insights and Forecast - by Application
- 8. South America SerDes for Consumer Electronics Analysis, Insights and Forecast, 2020-2032
- 8.1. Market Analysis, Insights and Forecast - by Application
- 8.1.1. Mobile Phone and Computer
- 8.1.2. Camera
- 8.1.3. Television
- 8.1.4. Printer
- 8.1.5. Other
- 8.2. Market Analysis, Insights and Forecast - by Types
- 8.2.1. Stand-Alone SerDes
- 8.2.2. IP Core SerDes
- 8.1. Market Analysis, Insights and Forecast - by Application
- 9. Europe SerDes for Consumer Electronics Analysis, Insights and Forecast, 2020-2032
- 9.1. Market Analysis, Insights and Forecast - by Application
- 9.1.1. Mobile Phone and Computer
- 9.1.2. Camera
- 9.1.3. Television
- 9.1.4. Printer
- 9.1.5. Other
- 9.2. Market Analysis, Insights and Forecast - by Types
- 9.2.1. Stand-Alone SerDes
- 9.2.2. IP Core SerDes
- 9.1. Market Analysis, Insights and Forecast - by Application
- 10. Middle East & Africa SerDes for Consumer Electronics Analysis, Insights and Forecast, 2020-2032
- 10.1. Market Analysis, Insights and Forecast - by Application
- 10.1.1. Mobile Phone and Computer
- 10.1.2. Camera
- 10.1.3. Television
- 10.1.4. Printer
- 10.1.5. Other
- 10.2. Market Analysis, Insights and Forecast - by Types
- 10.2.1. Stand-Alone SerDes
- 10.2.2. IP Core SerDes
- 10.1. Market Analysis, Insights and Forecast - by Application
- 11. Asia Pacific SerDes for Consumer Electronics Analysis, Insights and Forecast, 2020-2032
- 11.1. Market Analysis, Insights and Forecast - by Application
- 11.1.1. Mobile Phone and Computer
- 11.1.2. Camera
- 11.1.3. Television
- 11.1.4. Printer
- 11.1.5. Other
- 11.2. Market Analysis, Insights and Forecast - by Types
- 11.2.1. Stand-Alone SerDes
- 11.2.2. IP Core SerDes
- 11.1. Market Analysis, Insights and Forecast - by Application
- 12. Competitive Analysis
- 12.1. Company Profiles
- 12.1.1 Texas Instruments
- 12.1.1.1. Company Overview
- 12.1.1.2. Products
- 12.1.1.3. Company Financials
- 12.1.1.4. SWOT Analysis
- 12.1.2 Maxim Integrated
- 12.1.2.1. Company Overview
- 12.1.2.2. Products
- 12.1.2.3. Company Financials
- 12.1.2.4. SWOT Analysis
- 12.1.3 ON Semiconductor
- 12.1.3.1. Company Overview
- 12.1.3.2. Products
- 12.1.3.3. Company Financials
- 12.1.3.4. SWOT Analysis
- 12.1.4 NXP
- 12.1.4.1. Company Overview
- 12.1.4.2. Products
- 12.1.4.3. Company Financials
- 12.1.4.4. SWOT Analysis
- 12.1.5 ROHM Semiconductor
- 12.1.5.1. Company Overview
- 12.1.5.2. Products
- 12.1.5.3. Company Financials
- 12.1.5.4. SWOT Analysis
- 12.1.6 Cypress (Infineon)
- 12.1.6.1. Company Overview
- 12.1.6.2. Products
- 12.1.6.3. Company Financials
- 12.1.6.4. SWOT Analysis
- 12.1.7 Intesil (Renesas)
- 12.1.7.1. Company Overview
- 12.1.7.2. Products
- 12.1.7.3. Company Financials
- 12.1.7.4. SWOT Analysis
- 12.1.8 Semtech
- 12.1.8.1. Company Overview
- 12.1.8.2. Products
- 12.1.8.3. Company Financials
- 12.1.8.4. SWOT Analysis
- 12.1.9 Vitesse (Microsemi)
- 12.1.9.1. Company Overview
- 12.1.9.2. Products
- 12.1.9.3. Company Financials
- 12.1.9.4. SWOT Analysis
- 12.1.10 Faraday Technology
- 12.1.10.1. Company Overview
- 12.1.10.2. Products
- 12.1.10.3. Company Financials
- 12.1.10.4. SWOT Analysis
- 12.1.11 Inova Semiconductors
- 12.1.11.1. Company Overview
- 12.1.11.2. Products
- 12.1.11.3. Company Financials
- 12.1.11.4. SWOT Analysis
- 12.1.12 THine Electronics
- 12.1.12.1. Company Overview
- 12.1.12.2. Products
- 12.1.12.3. Company Financials
- 12.1.12.4. SWOT Analysis
- 12.1.1 Texas Instruments
- 12.2. Market Entropy
- 12.2.1 Company's Key Areas Served
- 12.2.2 Recent Developments
- 12.3. Company Market Share Analysis 2025
- 12.3.1 Top 5 Companies Market Share Analysis
- 12.3.2 Top 3 Companies Market Share Analysis
- 12.4. List of Potential Customers
- 13. Research Methodology
List of Figures
- Figure 1: Global SerDes for Consumer Electronics Revenue Breakdown (billion, %) by Region 2025 & 2033
- Figure 2: Global SerDes for Consumer Electronics Volume Breakdown (K, %) by Region 2025 & 2033
- Figure 3: North America SerDes for Consumer Electronics Revenue (billion), by Application 2025 & 2033
- Figure 4: North America SerDes for Consumer Electronics Volume (K), by Application 2025 & 2033
- Figure 5: North America SerDes for Consumer Electronics Revenue Share (%), by Application 2025 & 2033
- Figure 6: North America SerDes for Consumer Electronics Volume Share (%), by Application 2025 & 2033
- Figure 7: North America SerDes for Consumer Electronics Revenue (billion), by Types 2025 & 2033
- Figure 8: North America SerDes for Consumer Electronics Volume (K), by Types 2025 & 2033
- Figure 9: North America SerDes for Consumer Electronics Revenue Share (%), by Types 2025 & 2033
- Figure 10: North America SerDes for Consumer Electronics Volume Share (%), by Types 2025 & 2033
- Figure 11: North America SerDes for Consumer Electronics Revenue (billion), by Country 2025 & 2033
- Figure 12: North America SerDes for Consumer Electronics Volume (K), by Country 2025 & 2033
- Figure 13: North America SerDes for Consumer Electronics Revenue Share (%), by Country 2025 & 2033
- Figure 14: North America SerDes for Consumer Electronics Volume Share (%), by Country 2025 & 2033
- Figure 15: South America SerDes for Consumer Electronics Revenue (billion), by Application 2025 & 2033
- Figure 16: South America SerDes for Consumer Electronics Volume (K), by Application 2025 & 2033
- Figure 17: South America SerDes for Consumer Electronics Revenue Share (%), by Application 2025 & 2033
- Figure 18: South America SerDes for Consumer Electronics Volume Share (%), by Application 2025 & 2033
- Figure 19: South America SerDes for Consumer Electronics Revenue (billion), by Types 2025 & 2033
- Figure 20: South America SerDes for Consumer Electronics Volume (K), by Types 2025 & 2033
- Figure 21: South America SerDes for Consumer Electronics Revenue Share (%), by Types 2025 & 2033
- Figure 22: South America SerDes for Consumer Electronics Volume Share (%), by Types 2025 & 2033
- Figure 23: South America SerDes for Consumer Electronics Revenue (billion), by Country 2025 & 2033
- Figure 24: South America SerDes for Consumer Electronics Volume (K), by Country 2025 & 2033
- Figure 25: South America SerDes for Consumer Electronics Revenue Share (%), by Country 2025 & 2033
- Figure 26: South America SerDes for Consumer Electronics Volume Share (%), by Country 2025 & 2033
- Figure 27: Europe SerDes for Consumer Electronics Revenue (billion), by Application 2025 & 2033
- Figure 28: Europe SerDes for Consumer Electronics Volume (K), by Application 2025 & 2033
- Figure 29: Europe SerDes for Consumer Electronics Revenue Share (%), by Application 2025 & 2033
- Figure 30: Europe SerDes for Consumer Electronics Volume Share (%), by Application 2025 & 2033
- Figure 31: Europe SerDes for Consumer Electronics Revenue (billion), by Types 2025 & 2033
- Figure 32: Europe SerDes for Consumer Electronics Volume (K), by Types 2025 & 2033
- Figure 33: Europe SerDes for Consumer Electronics Revenue Share (%), by Types 2025 & 2033
- Figure 34: Europe SerDes for Consumer Electronics Volume Share (%), by Types 2025 & 2033
- Figure 35: Europe SerDes for Consumer Electronics Revenue (billion), by Country 2025 & 2033
- Figure 36: Europe SerDes for Consumer Electronics Volume (K), by Country 2025 & 2033
- Figure 37: Europe SerDes for Consumer Electronics Revenue Share (%), by Country 2025 & 2033
- Figure 38: Europe SerDes for Consumer Electronics Volume Share (%), by Country 2025 & 2033
- Figure 39: Middle East & Africa SerDes for Consumer Electronics Revenue (billion), by Application 2025 & 2033
- Figure 40: Middle East & Africa SerDes for Consumer Electronics Volume (K), by Application 2025 & 2033
- Figure 41: Middle East & Africa SerDes for Consumer Electronics Revenue Share (%), by Application 2025 & 2033
- Figure 42: Middle East & Africa SerDes for Consumer Electronics Volume Share (%), by Application 2025 & 2033
- Figure 43: Middle East & Africa SerDes for Consumer Electronics Revenue (billion), by Types 2025 & 2033
- Figure 44: Middle East & Africa SerDes for Consumer Electronics Volume (K), by Types 2025 & 2033
- Figure 45: Middle East & Africa SerDes for Consumer Electronics Revenue Share (%), by Types 2025 & 2033
- Figure 46: Middle East & Africa SerDes for Consumer Electronics Volume Share (%), by Types 2025 & 2033
- Figure 47: Middle East & Africa SerDes for Consumer Electronics Revenue (billion), by Country 2025 & 2033
- Figure 48: Middle East & Africa SerDes for Consumer Electronics Volume (K), by Country 2025 & 2033
- Figure 49: Middle East & Africa SerDes for Consumer Electronics Revenue Share (%), by Country 2025 & 2033
- Figure 50: Middle East & Africa SerDes for Consumer Electronics Volume Share (%), by Country 2025 & 2033
- Figure 51: Asia Pacific SerDes for Consumer Electronics Revenue (billion), by Application 2025 & 2033
- Figure 52: Asia Pacific SerDes for Consumer Electronics Volume (K), by Application 2025 & 2033
- Figure 53: Asia Pacific SerDes for Consumer Electronics Revenue Share (%), by Application 2025 & 2033
- Figure 54: Asia Pacific SerDes for Consumer Electronics Volume Share (%), by Application 2025 & 2033
- Figure 55: Asia Pacific SerDes for Consumer Electronics Revenue (billion), by Types 2025 & 2033
- Figure 56: Asia Pacific SerDes for Consumer Electronics Volume (K), by Types 2025 & 2033
- Figure 57: Asia Pacific SerDes for Consumer Electronics Revenue Share (%), by Types 2025 & 2033
- Figure 58: Asia Pacific SerDes for Consumer Electronics Volume Share (%), by Types 2025 & 2033
- Figure 59: Asia Pacific SerDes for Consumer Electronics Revenue (billion), by Country 2025 & 2033
- Figure 60: Asia Pacific SerDes for Consumer Electronics Volume (K), by Country 2025 & 2033
- Figure 61: Asia Pacific SerDes for Consumer Electronics Revenue Share (%), by Country 2025 & 2033
- Figure 62: Asia Pacific SerDes for Consumer Electronics Volume Share (%), by Country 2025 & 2033
List of Tables
- Table 1: Global SerDes for Consumer Electronics Revenue billion Forecast, by Application 2020 & 2033
- Table 2: Global SerDes for Consumer Electronics Volume K Forecast, by Application 2020 & 2033
- Table 3: Global SerDes for Consumer Electronics Revenue billion Forecast, by Types 2020 & 2033
- Table 4: Global SerDes for Consumer Electronics Volume K Forecast, by Types 2020 & 2033
- Table 5: Global SerDes for Consumer Electronics Revenue billion Forecast, by Region 2020 & 2033
- Table 6: Global SerDes for Consumer Electronics Volume K Forecast, by Region 2020 & 2033
- Table 7: Global SerDes for Consumer Electronics Revenue billion Forecast, by Application 2020 & 2033
- Table 8: Global SerDes for Consumer Electronics Volume K Forecast, by Application 2020 & 2033
- Table 9: Global SerDes for Consumer Electronics Revenue billion Forecast, by Types 2020 & 2033
- Table 10: Global SerDes for Consumer Electronics Volume K Forecast, by Types 2020 & 2033
- Table 11: Global SerDes for Consumer Electronics Revenue billion Forecast, by Country 2020 & 2033
- Table 12: Global SerDes for Consumer Electronics Volume K Forecast, by Country 2020 & 2033
- Table 13: United States SerDes for Consumer Electronics Revenue (billion) Forecast, by Application 2020 & 2033
- Table 14: United States SerDes for Consumer Electronics Volume (K) Forecast, by Application 2020 & 2033
- Table 15: Canada SerDes for Consumer Electronics Revenue (billion) Forecast, by Application 2020 & 2033
- Table 16: Canada SerDes for Consumer Electronics Volume (K) Forecast, by Application 2020 & 2033
- Table 17: Mexico SerDes for Consumer Electronics Revenue (billion) Forecast, by Application 2020 & 2033
- Table 18: Mexico SerDes for Consumer Electronics Volume (K) Forecast, by Application 2020 & 2033
- Table 19: Global SerDes for Consumer Electronics Revenue billion Forecast, by Application 2020 & 2033
- Table 20: Global SerDes for Consumer Electronics Volume K Forecast, by Application 2020 & 2033
- Table 21: Global SerDes for Consumer Electronics Revenue billion Forecast, by Types 2020 & 2033
- Table 22: Global SerDes for Consumer Electronics Volume K Forecast, by Types 2020 & 2033
- Table 23: Global SerDes for Consumer Electronics Revenue billion Forecast, by Country 2020 & 2033
- Table 24: Global SerDes for Consumer Electronics Volume K Forecast, by Country 2020 & 2033
- Table 25: Brazil SerDes for Consumer Electronics Revenue (billion) Forecast, by Application 2020 & 2033
- Table 26: Brazil SerDes for Consumer Electronics Volume (K) Forecast, by Application 2020 & 2033
- Table 27: Argentina SerDes for Consumer Electronics Revenue (billion) Forecast, by Application 2020 & 2033
- Table 28: Argentina SerDes for Consumer Electronics Volume (K) Forecast, by Application 2020 & 2033
- Table 29: Rest of South America SerDes for Consumer Electronics Revenue (billion) Forecast, by Application 2020 & 2033
- Table 30: Rest of South America SerDes for Consumer Electronics Volume (K) Forecast, by Application 2020 & 2033
- Table 31: Global SerDes for Consumer Electronics Revenue billion Forecast, by Application 2020 & 2033
- Table 32: Global SerDes for Consumer Electronics Volume K Forecast, by Application 2020 & 2033
- Table 33: Global SerDes for Consumer Electronics Revenue billion Forecast, by Types 2020 & 2033
- Table 34: Global SerDes for Consumer Electronics Volume K Forecast, by Types 2020 & 2033
- Table 35: Global SerDes for Consumer Electronics Revenue billion Forecast, by Country 2020 & 2033
- Table 36: Global SerDes for Consumer Electronics Volume K Forecast, by Country 2020 & 2033
- Table 37: United Kingdom SerDes for Consumer Electronics Revenue (billion) Forecast, by Application 2020 & 2033
- Table 38: United Kingdom SerDes for Consumer Electronics Volume (K) Forecast, by Application 2020 & 2033
- Table 39: Germany SerDes for Consumer Electronics Revenue (billion) Forecast, by Application 2020 & 2033
- Table 40: Germany SerDes for Consumer Electronics Volume (K) Forecast, by Application 2020 & 2033
- Table 41: France SerDes for Consumer Electronics Revenue (billion) Forecast, by Application 2020 & 2033
- Table 42: France SerDes for Consumer Electronics Volume (K) Forecast, by Application 2020 & 2033
- Table 43: Italy SerDes for Consumer Electronics Revenue (billion) Forecast, by Application 2020 & 2033
- Table 44: Italy SerDes for Consumer Electronics Volume (K) Forecast, by Application 2020 & 2033
- Table 45: Spain SerDes for Consumer Electronics Revenue (billion) Forecast, by Application 2020 & 2033
- Table 46: Spain SerDes for Consumer Electronics Volume (K) Forecast, by Application 2020 & 2033
- Table 47: Russia SerDes for Consumer Electronics Revenue (billion) Forecast, by Application 2020 & 2033
- Table 48: Russia SerDes for Consumer Electronics Volume (K) Forecast, by Application 2020 & 2033
- Table 49: Benelux SerDes for Consumer Electronics Revenue (billion) Forecast, by Application 2020 & 2033
- Table 50: Benelux SerDes for Consumer Electronics Volume (K) Forecast, by Application 2020 & 2033
- Table 51: Nordics SerDes for Consumer Electronics Revenue (billion) Forecast, by Application 2020 & 2033
- Table 52: Nordics SerDes for Consumer Electronics Volume (K) Forecast, by Application 2020 & 2033
- Table 53: Rest of Europe SerDes for Consumer Electronics Revenue (billion) Forecast, by Application 2020 & 2033
- Table 54: Rest of Europe SerDes for Consumer Electronics Volume (K) Forecast, by Application 2020 & 2033
- Table 55: Global SerDes for Consumer Electronics Revenue billion Forecast, by Application 2020 & 2033
- Table 56: Global SerDes for Consumer Electronics Volume K Forecast, by Application 2020 & 2033
- Table 57: Global SerDes for Consumer Electronics Revenue billion Forecast, by Types 2020 & 2033
- Table 58: Global SerDes for Consumer Electronics Volume K Forecast, by Types 2020 & 2033
- Table 59: Global SerDes for Consumer Electronics Revenue billion Forecast, by Country 2020 & 2033
- Table 60: Global SerDes for Consumer Electronics Volume K Forecast, by Country 2020 & 2033
- Table 61: Turkey SerDes for Consumer Electronics Revenue (billion) Forecast, by Application 2020 & 2033
- Table 62: Turkey SerDes for Consumer Electronics Volume (K) Forecast, by Application 2020 & 2033
- Table 63: Israel SerDes for Consumer Electronics Revenue (billion) Forecast, by Application 2020 & 2033
- Table 64: Israel SerDes for Consumer Electronics Volume (K) Forecast, by Application 2020 & 2033
- Table 65: GCC SerDes for Consumer Electronics Revenue (billion) Forecast, by Application 2020 & 2033
- Table 66: GCC SerDes for Consumer Electronics Volume (K) Forecast, by Application 2020 & 2033
- Table 67: North Africa SerDes for Consumer Electronics Revenue (billion) Forecast, by Application 2020 & 2033
- Table 68: North Africa SerDes for Consumer Electronics Volume (K) Forecast, by Application 2020 & 2033
- Table 69: South Africa SerDes for Consumer Electronics Revenue (billion) Forecast, by Application 2020 & 2033
- Table 70: South Africa SerDes for Consumer Electronics Volume (K) Forecast, by Application 2020 & 2033
- Table 71: Rest of Middle East & Africa SerDes for Consumer Electronics Revenue (billion) Forecast, by Application 2020 & 2033
- Table 72: Rest of Middle East & Africa SerDes for Consumer Electronics Volume (K) Forecast, by Application 2020 & 2033
- Table 73: Global SerDes for Consumer Electronics Revenue billion Forecast, by Application 2020 & 2033
- Table 74: Global SerDes for Consumer Electronics Volume K Forecast, by Application 2020 & 2033
- Table 75: Global SerDes for Consumer Electronics Revenue billion Forecast, by Types 2020 & 2033
- Table 76: Global SerDes for Consumer Electronics Volume K Forecast, by Types 2020 & 2033
- Table 77: Global SerDes for Consumer Electronics Revenue billion Forecast, by Country 2020 & 2033
- Table 78: Global SerDes for Consumer Electronics Volume K Forecast, by Country 2020 & 2033
- Table 79: China SerDes for Consumer Electronics Revenue (billion) Forecast, by Application 2020 & 2033
- Table 80: China SerDes for Consumer Electronics Volume (K) Forecast, by Application 2020 & 2033
- Table 81: India SerDes for Consumer Electronics Revenue (billion) Forecast, by Application 2020 & 2033
- Table 82: India SerDes for Consumer Electronics Volume (K) Forecast, by Application 2020 & 2033
- Table 83: Japan SerDes for Consumer Electronics Revenue (billion) Forecast, by Application 2020 & 2033
- Table 84: Japan SerDes for Consumer Electronics Volume (K) Forecast, by Application 2020 & 2033
- Table 85: South Korea SerDes for Consumer Electronics Revenue (billion) Forecast, by Application 2020 & 2033
- Table 86: South Korea SerDes for Consumer Electronics Volume (K) Forecast, by Application 2020 & 2033
- Table 87: ASEAN SerDes for Consumer Electronics Revenue (billion) Forecast, by Application 2020 & 2033
- Table 88: ASEAN SerDes for Consumer Electronics Volume (K) Forecast, by Application 2020 & 2033
- Table 89: Oceania SerDes for Consumer Electronics Revenue (billion) Forecast, by Application 2020 & 2033
- Table 90: Oceania SerDes for Consumer Electronics Volume (K) Forecast, by Application 2020 & 2033
- Table 91: Rest of Asia Pacific SerDes for Consumer Electronics Revenue (billion) Forecast, by Application 2020 & 2033
- Table 92: Rest of Asia Pacific SerDes for Consumer Electronics Volume (K) Forecast, by Application 2020 & 2033
Frequently Asked Questions
1. What is the projected Compound Annual Growth Rate (CAGR) of the SerDes for Consumer Electronics?
The projected CAGR is approximately 11.29%.
2. Which companies are prominent players in the SerDes for Consumer Electronics?
Key companies in the market include Texas Instruments, Maxim Integrated, ON Semiconductor, NXP, ROHM Semiconductor, Cypress (Infineon), Intesil (Renesas), Semtech, Vitesse (Microsemi), Faraday Technology, Inova Semiconductors, THine Electronics.
3. What are the main segments of the SerDes for Consumer Electronics?
The market segments include Application, Types.
4. Can you provide details about the market size?
The market size is estimated to be USD 11.32 billion as of 2022.
5. What are some drivers contributing to market growth?
N/A
6. What are the notable trends driving market growth?
N/A
7. Are there any restraints impacting market growth?
N/A
8. Can you provide examples of recent developments in the market?
N/A
9. What pricing options are available for accessing the report?
Pricing options include single-user, multi-user, and enterprise licenses priced at USD 3350.00, USD 5025.00, and USD 6700.00 respectively.
10. Is the market size provided in terms of value or volume?
The market size is provided in terms of value, measured in billion and volume, measured in K.
11. Are there any specific market keywords associated with the report?
Yes, the market keyword associated with the report is "SerDes for Consumer Electronics," which aids in identifying and referencing the specific market segment covered.
12. How do I determine which pricing option suits my needs best?
The pricing options vary based on user requirements and access needs. Individual users may opt for single-user licenses, while businesses requiring broader access may choose multi-user or enterprise licenses for cost-effective access to the report.
13. Are there any additional resources or data provided in the SerDes for Consumer Electronics report?
While the report offers comprehensive insights, it's advisable to review the specific contents or supplementary materials provided to ascertain if additional resources or data are available.
14. How can I stay updated on further developments or reports in the SerDes for Consumer Electronics?
To stay informed about further developments, trends, and reports in the SerDes for Consumer Electronics, consider subscribing to industry newsletters, following relevant companies and organizations, or regularly checking reputable industry news sources and publications.
Methodology
Step 1 - Identification of Relevant Samples Size from Population Database


Step 2 - Approaches for Defining Global Market Size (Value, Volume* & Price*)

Note*: In applicable scenarios
Step 3 - Data Sources
Primary Research
- Web Analytics
- Survey Reports
- Research Institute
- Latest Research Reports
- Opinion Leaders
Secondary Research
- Annual Reports
- White Paper
- Latest Press Release
- Industry Association
- Paid Database
- Investor Presentations

Step 4 - Data Triangulation
Involves using different sources of information in order to increase the validity of a study
These sources are likely to be stakeholders in a program - participants, other researchers, program staff, other community members, and so on.
Then we put all data in single framework & apply various statistical tools to find out the dynamic on the market.
During the analysis stage, feedback from the stakeholder groups would be compared to determine areas of agreement as well as areas of divergence