

Key Insights
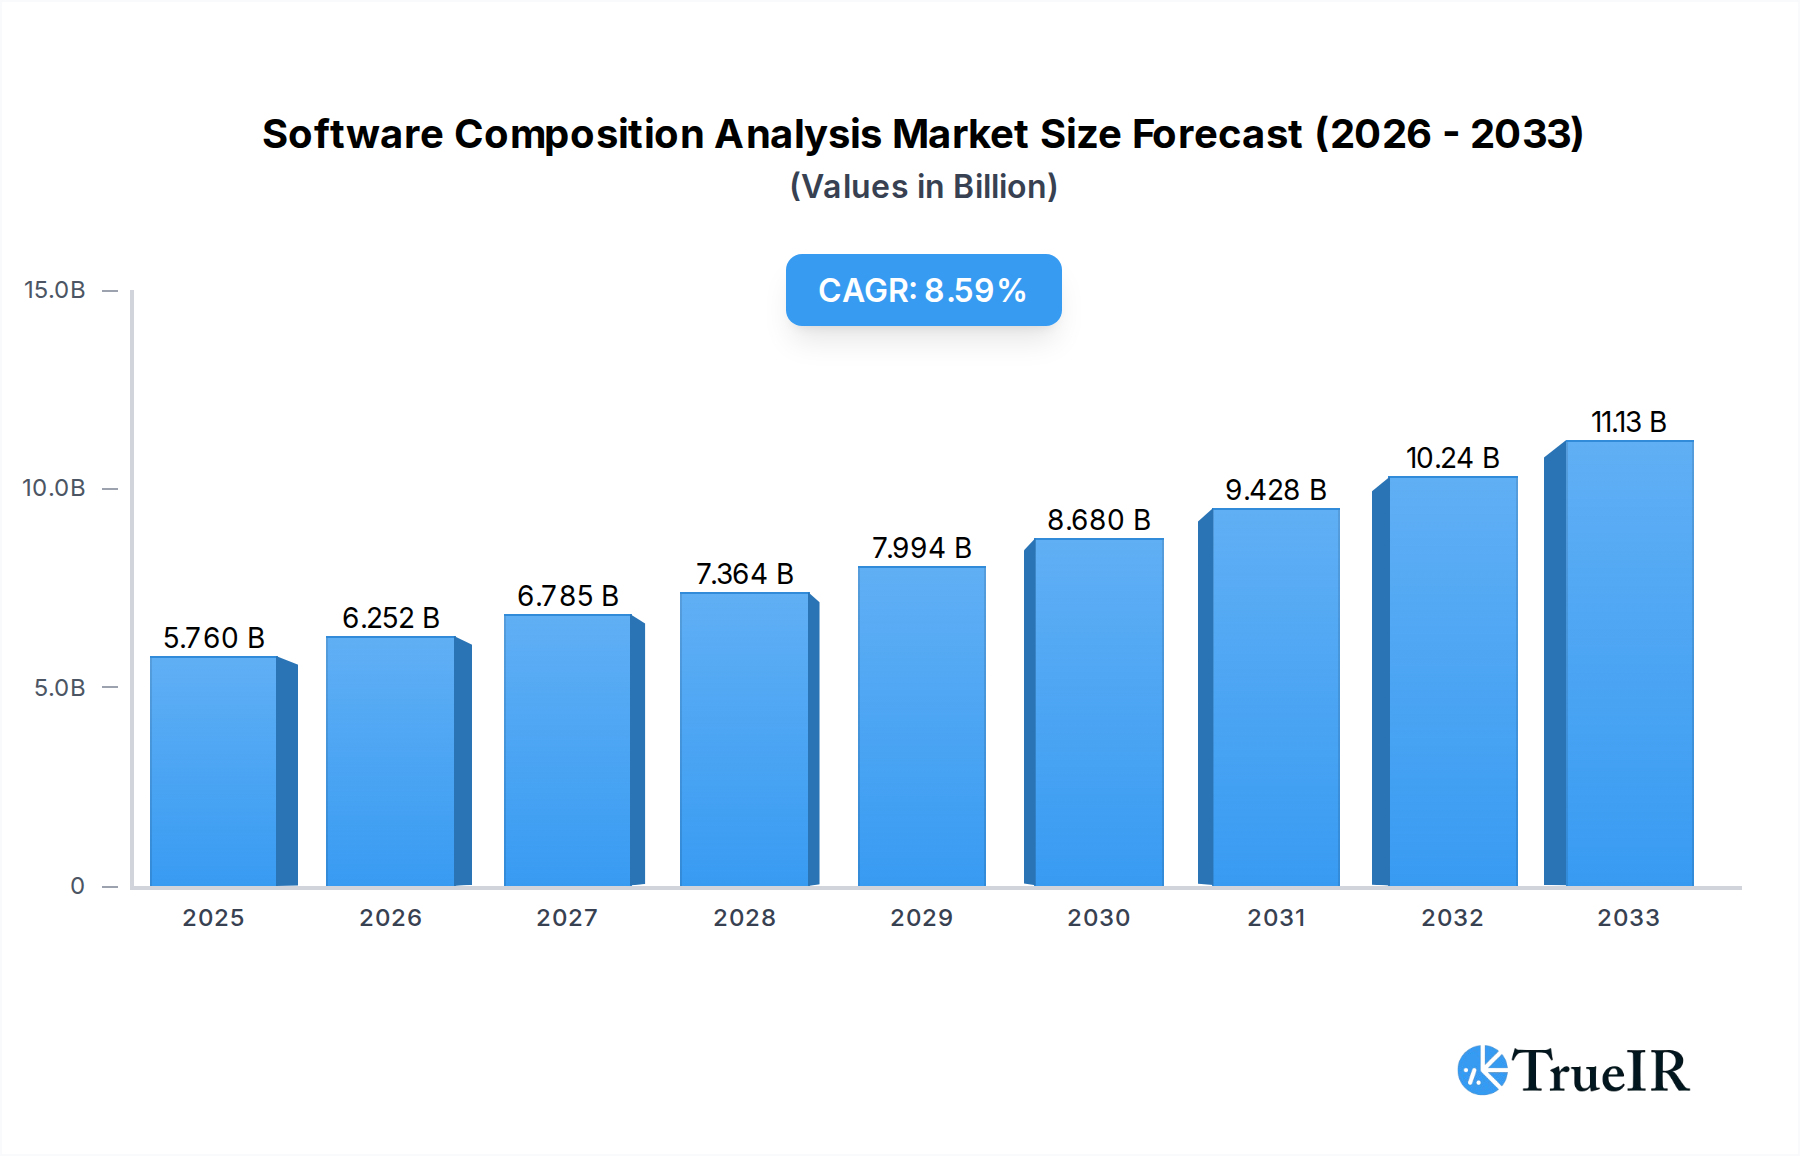
The Software Composition Analysis (SCA) market is poised for substantial growth, driven by the increasing adoption of open-source software and the escalating threat of cyberattacks targeting software vulnerabilities. With a projected market size of $5.76 billion in 2025, the industry is expected to expand at a robust Compound Annual Growth Rate (CAGR) of 8.62% through 2033. This significant expansion is fueled by a growing awareness among organizations regarding the inherent risks associated with open-source components, including licensing compliance issues and security vulnerabilities. As businesses increasingly rely on third-party and open-source code to accelerate development cycles, the demand for comprehensive SCA solutions that can identify, track, and manage these components effectively is skyrocketing. The market is further propelled by stringent regulatory requirements and the need for robust application security, pushing enterprises to integrate SCA tools as a fundamental part of their DevOps and security workflows.

Software Composition Analysis Market Market Size (In Billion)
The SCA market is segmented across various components, including solutions and services, with deployment modes ranging from cloud-based to on-premises. Key industry verticals such as IT & Telecom, BFSI, Retail & E-Commerce, and Government are leading the adoption of SCA solutions due to their critical reliance on software and the high stakes involved in data security. Emerging trends indicate a move towards more automated and integrated SCA capabilities within the software development lifecycle (SDLC). However, challenges such as the complexity of managing vast open-source ecosystems, the need for skilled personnel to interpret SCA findings, and the initial investment costs for comprehensive solutions may act as minor restraints. Despite these hurdles, the imperative to secure software supply chains and mitigate evolving cyber threats ensures a dynamic and promising future for the Software Composition Analysis market.
Software Composition Analysis Market Company Market Share
The Software Composition Analysis (SCA) market is experiencing unprecedented growth driven by the escalating complexity of software supply chains, stringent regulatory mandates, and the ever-present threat of cyberattacks. This comprehensive report delves into the dynamic landscape of SCA, providing in-depth analysis of market trends, competitive strategies, technological advancements, and future growth trajectories. With an estimated market size projected to reach $XX billion by 2033, this study is an indispensable resource for stakeholders seeking to navigate the intricacies of software security and leverage the full potential of SCA solutions.
Software Composition Analysis Market Market Structure & Competitive Landscape
The Software Composition Analysis (SCA) market is characterized by a moderately consolidated structure, with key players like Synopsys Inc., Veracode Inc., and Sonatype Inc. holding significant market share. Innovation is a primary driver, fueled by the continuous evolution of open-source components and the increasing sophistication of cyber threats. Regulatory impacts, such as the growing emphasis on software supply chain security from government bodies worldwide, are significantly shaping market dynamics. Product substitutes, while nascent, include manual code reviews and basic vulnerability scanning, which lack the comprehensive visibility and automation offered by SCA. End-user segmentation reveals a strong demand across IT & Telecom, BFSI, and Government sectors, with emerging interest from Healthcare and Automotive. Mergers and acquisitions (M&A) are a recurring theme, with companies acquiring smaller, specialized SCA vendors to expand their product portfolios and technological capabilities. For instance, the acquisition of SourceClear Inc. by VMware underscores the trend of integration into broader security platforms. The market concentration ratio for the top 5 players is estimated to be around 65%, indicating a competitive yet somewhat dominated landscape.
- Market Concentration: Moderately consolidated with a few dominant players.
- Innovation Drivers: Open-source evolution, advanced persistent threats, proactive vulnerability management.
- Regulatory Impacts: Increasing mandates for SBOMs and supply chain transparency.
- Product Substitutes: Manual code reviews, basic vulnerability scanners (limited efficacy).
- End-User Segmentation: Strong adoption in IT & Telecom, BFSI, Government; growing in Healthcare, Automotive.
- M&A Trends: Strategic acquisitions for technology enhancement and market expansion.
Software Composition Analysis Market Market Trends & Opportunities
The Software Composition Analysis (SCA) market is poised for substantial expansion, driven by a confluence of technological advancements, evolving consumer preferences for secure software, and intensifying competitive dynamics. The global SCA market size is projected to surge from an estimated $X.XX billion in 2025 to $XX billion by 2033, exhibiting a robust Compound Annual Growth Rate (CAGR) of XX% during the forecast period of 2025–2033. This remarkable growth trajectory is underpinned by several key trends. Firstly, the proliferation of open-source software in modern application development has made it imperative for organizations to understand and manage the associated risks, including licensing compliance and security vulnerabilities. SCA solutions offer the critical visibility required to address these challenges effectively. Secondly, the increasing sophistication and frequency of cyberattacks targeting software supply chains are compelling businesses to adopt proactive security measures. High-profile breaches have underscored the importance of securing every component of the software development lifecycle. Thirdly, regulatory bodies worldwide are implementing stricter guidelines concerning software transparency and security, such as mandating Software Bills of Materials (SBOMs). This regulatory push is a significant catalyst for SCA adoption, particularly within government and critical infrastructure sectors.
Opportunities abound for SCA vendors to innovate and expand their market reach. The growing demand for automated SCA solutions integrated into DevSecOps pipelines presents a significant opportunity for enhanced market penetration. Furthermore, the development of advanced AI and machine learning capabilities within SCA tools to predict and identify novel vulnerabilities offers a competitive edge. The expansion of SCA services, including expert consultation and managed services, caters to organizations lacking in-house security expertise. The increasing adoption of cloud-based SCA solutions, offering scalability and flexibility, is another significant trend. The market penetration rate for SCA solutions is estimated to be XX% in developed economies, with substantial room for growth in emerging markets. Competitive dynamics are characterized by a focus on comprehensive vulnerability detection, license compliance, and seamless integration with existing development and security workflows. Companies are investing heavily in research and development to offer more accurate and efficient SCA tools, thereby capturing a larger market share. The global market is projected to witness a market size of $X.XX billion in the base year of 2025.
Dominant Markets & Segments in Software Composition Analysis Market
The Software Composition Analysis (SCA) market demonstrates strong dominance across several key segments, driven by specific industry needs and technological infrastructure.
Component: Solution
The Solution segment is the largest and most dominant within the SCA market. Organizations are increasingly prioritizing comprehensive SCA platforms that offer a suite of capabilities beyond basic vulnerability scanning.
- Key Growth Drivers:
- Demand for automated security testing throughout the SDLC.
- Need for detailed insights into open-source license compliance.
- Growing adoption of DevSecOps practices.
- Enhanced capabilities for SBOM generation and management.
The SCA solution segment is further categorized into vulnerability detection, license compliance, and management & reporting. The vulnerability detection sub-segment holds the largest share due to the paramount importance of identifying and mitigating security risks inherent in open-source components. As software supply chains become more intricate, the need for robust solutions that can accurately identify known and unknown vulnerabilities is critical.
Deployment Mode: Cloud
The Cloud deployment mode is rapidly emerging as the preferred choice for SCA solutions, outpacing on-premises alternatives. This shift is driven by the inherent advantages of cloud-based services.
- Key Growth Drivers:
- Scalability and flexibility to accommodate evolving organizational needs.
- Reduced IT infrastructure costs and maintenance overhead.
- Faster deployment and easier updates.
- Enhanced accessibility from anywhere, facilitating remote work.
Cloud-based SCA solutions offer organizations the agility to adapt to changing security landscapes and scale their security operations without significant upfront investments. This mode is particularly attractive to small and medium-sized enterprises (SMEs) that may have limited IT resources.
Industry Vertical: IT & Telecom
The IT & Telecom industry vertical represents the leading market for SCA solutions. This sector is at the forefront of digital innovation, heavily reliant on open-source software, and consequently faces the most significant software supply chain risks.
- Key Growth Drivers:
- Extensive use of open-source software in developing and deploying services.
- High exposure to cyber threats and the need for robust security.
- Rapid development cycles and continuous integration/continuous delivery (CI/CD) pipelines.
- Strict regulatory compliance requirements for data protection.
Following closely are BFSI (Banking, Financial Services, and Insurance) and Government, both of which are increasingly scrutinized for data security and compliance. BFSI institutions handle sensitive financial data, making them prime targets for cyberattacks, while government entities are mandated to secure critical infrastructure and citizen data. The Retail & E-Commerce sector is also a significant growth area, driven by the need to protect customer data and ensure the integrity of online transactions. Other industry verticals, including Healthcare and Automotive, are witnessing growing adoption as they increasingly integrate software into their operations and face evolving cybersecurity challenges. The automotive industry, in particular, is seeing a surge in software-defined vehicles, necessitating rigorous SCA for embedded systems.
Software Composition Analysis Market Product Analysis
Product innovations in the Software Composition Analysis (SCA) market are centered on enhancing accuracy, automation, and integration. Vendors are developing advanced AI-powered engines for more precise vulnerability detection, including zero-day exploits and sophisticated threat intelligence feeds. Competitive advantages are being forged through seamless integration with CI/CD pipelines, enabling developers to identify and remediate issues early in the development lifecycle, thereby reducing the cost and time associated with security fixes. Applications of SCA are expanding beyond traditional vulnerability management to include comprehensive license compliance, intellectual property management, and proactive risk assessment of the entire software supply chain. This technological advancement ensures that organizations can maintain both security and legal compliance effectively.
Key Drivers, Barriers & Challenges in Software Composition Analysis Market
The Software Composition Analysis (SCA) market is propelled by several key drivers.
- Technological Advancements: The continuous evolution of open-source components and the increasing complexity of software supply chains necessitate robust SCA solutions.
- Regulatory Compliance: Growing mandates for software supply chain security and SBOMs, such as those from government agencies, are a significant catalyst.
- Escalating Cyber Threats: The rise in sophisticated cyberattacks targeting software dependencies drives the adoption of proactive security measures.
- DevSecOps Adoption: The integration of security practices into the development lifecycle demands automated SCA tools.
However, the market also faces barriers and challenges.
- Complexity of Implementation: Integrating SCA tools into existing workflows can be challenging for some organizations.
- False Positives/Negatives: The accuracy of SCA tools can sometimes lead to an overwhelming number of alerts or missed vulnerabilities.
- Talent Shortage: A lack of skilled cybersecurity professionals to effectively manage and interpret SCA findings.
- Cost of Advanced Solutions: High-end SCA solutions with extensive features can be a significant investment for smaller businesses.
- Supply Chain Issues: The inherent complexity and distributed nature of global software supply chains make comprehensive analysis difficult.
Growth Drivers in the Software Composition Analysis Market Market
The growth of the Software Composition Analysis (SCA) market is significantly influenced by a variety of factors. The pervasive adoption of open-source software across all industries is a primary driver, as it necessitates thorough risk management. Furthermore, increasing regulatory pressures worldwide, mandating transparency and security in software supply chains, are compelling organizations to invest in SCA. Economically, the rising cost of data breaches and the associated reputational damage are pushing businesses towards preventative security measures like SCA. Technologically, the ongoing innovation in AI and machine learning is enabling SCA tools to become more intelligent and accurate in identifying vulnerabilities and license compliance issues. The shift towards cloud-native development and microservices architecture also fuels the demand for dynamic SCA solutions.
Challenges Impacting Software Composition Analysis Market Growth
Despite the robust growth, several challenges impact the Software Composition Analysis (SCA) market. Regulatory complexities, while a driver, can also be a barrier if implementations are unclear or burdensome. Supply chain issues, including the vastness and constant evolution of open-source repositories, present ongoing challenges in maintaining up-to-date and comprehensive vulnerability databases. Competitive pressures from a growing number of vendors can lead to price wars, potentially impacting profitability and investment in R&D for smaller players. Furthermore, the inherent complexity of integrating SCA tools into diverse development environments and the ongoing need for skilled personnel to interpret and act upon SCA findings remain significant hurdles. The potential for false positives and negatives from SCA tools can also lead to user fatigue and reduced confidence if not managed effectively.
Key Players Shaping the Software Composition Analysis Market Market
- WhiteHat Security Inc.
- NexB Inc.
- Sonatype Inc.
- Veracode Inc.
- Flexera Inc.
- WhiteSource Software Inc.
- SourceClear Inc.
- Contrast Security Inc.
- Rogue Wave Software
- Synopsys Inc.
- Dahua Technology Co Ltd
Significant Software Composition Analysis Market Industry Milestones
- February 2023: SOOS announced a new cooperation with Vanta to simplify the declaration of software dependencies, aiding compliance with global security, privacy, and regulatory standards. Vanta assists businesses in automating compliance with frameworks like SOC 2, ISO 27001, HIPAA, and GDPR, and scaling their security processes.
- September 2022: Revenera released Revenera SBOM Insights, a SaaS solution designed to help software companies manage Software Bills of Materials from multiple sources, improving completeness, correctness, and supply chain collaboration for enhanced security. Revenera SBOM Insights compiles open-source and third-party component data from SCA scans and other sources.
Future Outlook for Software Composition Analysis Market Market
The future outlook for the Software Composition Analysis (SCA) market is exceptionally bright, driven by an unwavering demand for secure software supply chains. Continued innovation in AI and machine learning will lead to more predictive and accurate vulnerability identification, expanding the capabilities of SCA beyond known threats. The increasing adoption of DevSecOps will further embed SCA into the core of software development, making security a continuous process rather than an afterthought. Furthermore, the growing regulatory landscape, with more nations implementing stringent software security mandates, will continue to fuel market growth. Strategic partnerships and acquisitions will likely reshape the competitive landscape, leading to more integrated and comprehensive security solutions. The expansion of SCA into emerging markets and new industry verticals, such as IoT and embedded systems, presents significant untapped potential for sustained growth and market penetration.
Software Composition Analysis Market Segmentation
-
1. Component
- 1.1. Solution
- 1.2. Services
-
2. Deployment Mode
- 2.1. Cloud
- 2.2. On-premises
-
3. Industry Vertical
- 3.1. IT & Telecom
- 3.2. BFSI
- 3.3. Retail & E-Commerce
- 3.4. Government
- 3.5. Other Industry Verticals (Healthcare, Automotive)
Software Composition Analysis Market Segmentation By Geography
- 1. North America
- 2. Europe
- 3. Asia Pacific
- 4. Latin America
- 5. Middle East and Africa
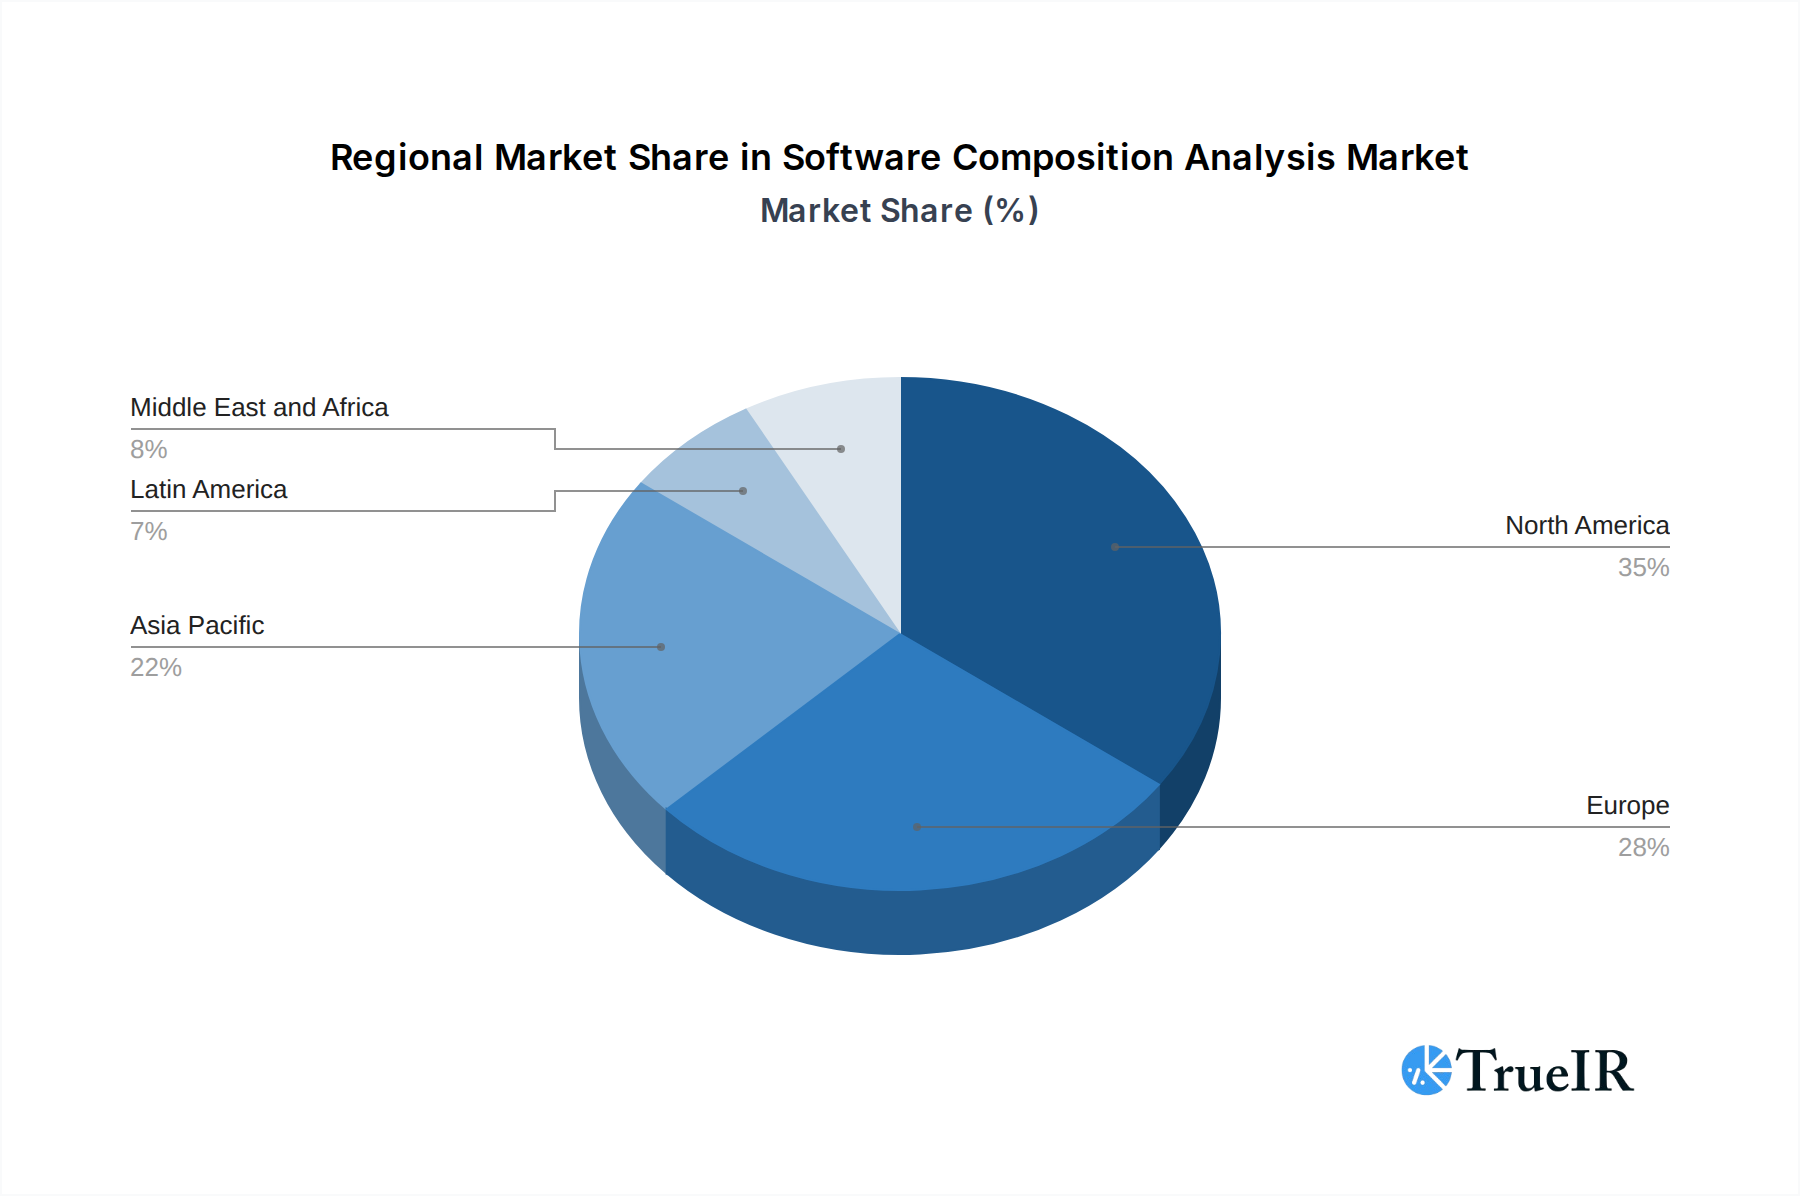
Software Composition Analysis Market Regional Market Share
Geographic Coverage of Software Composition Analysis Market
Software Composition Analysis Market REPORT HIGHLIGHTS
| Aspects | Details |
|---|---|
| Study Period | 2020-2034 |
| Base Year | 2025 |
| Estimated Year | 2026 |
| Forecast Period | 2026-2034 |
| Historical Period | 2020-2025 |
| Growth Rate | CAGR of 8.62% from 2020-2034 |
| Segmentation |
|
Table of Contents
- 1. Introduction
- 1.1. Research Scope
- 1.2. Market Segmentation
- 1.3. Research Objective
- 1.4. Definitions and Assumptions
- 2. Executive Summary
- 2.1. Market Snapshot
- 3. Market Dynamics
- 3.1. Market Drivers
- 3.2. Market Restrains
- 3.3. Market Trends
- 3.4. Market Opportunities
- 4. Market Factor Analysis
- 4.1. Porters Five Forces
- 4.1.1. Bargaining Power of Suppliers
- 4.1.2. Bargaining Power of Buyers
- 4.1.3. Threat of New Entrants
- 4.1.4. Threat of Substitutes
- 4.1.5. Competitive Rivalry
- 4.2. PESTEL analysis
- 4.3. BCG Analysis
- 4.3.1. Stars (High Growth, High Market Share)
- 4.3.2. Cash Cows (Low Growth, High Market Share)
- 4.3.3. Question Mark (High Growth, Low Market Share)
- 4.3.4. Dogs (Low Growth, Low Market Share)
- 4.4. Ansoff Matrix Analysis
- 4.5. Supply Chain Analysis
- 4.6. Regulatory Landscape
- 4.7. Current Market Potential and Opportunity Assessment (TAM–SAM–SOM Framework)
- 4.8. TIR Analyst Note
- 4.1. Porters Five Forces
- 5. Market Analysis, Insights and Forecast 2021-2033
- 5.1. Market Analysis, Insights and Forecast - by Component
- 5.1.1. Solution
- 5.1.2. Services
- 5.2. Market Analysis, Insights and Forecast - by Deployment Mode
- 5.2.1. Cloud
- 5.2.2. On-premises
- 5.3. Market Analysis, Insights and Forecast - by Industry Vertical
- 5.3.1. IT & Telecom
- 5.3.2. BFSI
- 5.3.3. Retail & E-Commerce
- 5.3.4. Government
- 5.3.5. Other Industry Verticals (Healthcare, Automotive)
- 5.4. Market Analysis, Insights and Forecast - by Region
- 5.4.1. North America
- 5.4.2. Europe
- 5.4.3. Asia Pacific
- 5.4.4. Latin America
- 5.4.5. Middle East and Africa
- 5.1. Market Analysis, Insights and Forecast - by Component
- 6. Global Software Composition Analysis Market Analysis, Insights and Forecast, 2021-2033
- 6.1. Market Analysis, Insights and Forecast - by Component
- 6.1.1. Solution
- 6.1.2. Services
- 6.2. Market Analysis, Insights and Forecast - by Deployment Mode
- 6.2.1. Cloud
- 6.2.2. On-premises
- 6.3. Market Analysis, Insights and Forecast - by Industry Vertical
- 6.3.1. IT & Telecom
- 6.3.2. BFSI
- 6.3.3. Retail & E-Commerce
- 6.3.4. Government
- 6.3.5. Other Industry Verticals (Healthcare, Automotive)
- 6.1. Market Analysis, Insights and Forecast - by Component
- 7. North America Software Composition Analysis Market Analysis, Insights and Forecast, 2020-2032
- 7.1. Market Analysis, Insights and Forecast - by Component
- 7.1.1. Solution
- 7.1.2. Services
- 7.2. Market Analysis, Insights and Forecast - by Deployment Mode
- 7.2.1. Cloud
- 7.2.2. On-premises
- 7.3. Market Analysis, Insights and Forecast - by Industry Vertical
- 7.3.1. IT & Telecom
- 7.3.2. BFSI
- 7.3.3. Retail & E-Commerce
- 7.3.4. Government
- 7.3.5. Other Industry Verticals (Healthcare, Automotive)
- 7.1. Market Analysis, Insights and Forecast - by Component
- 8. Europe Software Composition Analysis Market Analysis, Insights and Forecast, 2020-2032
- 8.1. Market Analysis, Insights and Forecast - by Component
- 8.1.1. Solution
- 8.1.2. Services
- 8.2. Market Analysis, Insights and Forecast - by Deployment Mode
- 8.2.1. Cloud
- 8.2.2. On-premises
- 8.3. Market Analysis, Insights and Forecast - by Industry Vertical
- 8.3.1. IT & Telecom
- 8.3.2. BFSI
- 8.3.3. Retail & E-Commerce
- 8.3.4. Government
- 8.3.5. Other Industry Verticals (Healthcare, Automotive)
- 8.1. Market Analysis, Insights and Forecast - by Component
- 9. Asia Pacific Software Composition Analysis Market Analysis, Insights and Forecast, 2020-2032
- 9.1. Market Analysis, Insights and Forecast - by Component
- 9.1.1. Solution
- 9.1.2. Services
- 9.2. Market Analysis, Insights and Forecast - by Deployment Mode
- 9.2.1. Cloud
- 9.2.2. On-premises
- 9.3. Market Analysis, Insights and Forecast - by Industry Vertical
- 9.3.1. IT & Telecom
- 9.3.2. BFSI
- 9.3.3. Retail & E-Commerce
- 9.3.4. Government
- 9.3.5. Other Industry Verticals (Healthcare, Automotive)
- 9.1. Market Analysis, Insights and Forecast - by Component
- 10. Latin America Software Composition Analysis Market Analysis, Insights and Forecast, 2020-2032
- 10.1. Market Analysis, Insights and Forecast - by Component
- 10.1.1. Solution
- 10.1.2. Services
- 10.2. Market Analysis, Insights and Forecast - by Deployment Mode
- 10.2.1. Cloud
- 10.2.2. On-premises
- 10.3. Market Analysis, Insights and Forecast - by Industry Vertical
- 10.3.1. IT & Telecom
- 10.3.2. BFSI
- 10.3.3. Retail & E-Commerce
- 10.3.4. Government
- 10.3.5. Other Industry Verticals (Healthcare, Automotive)
- 10.1. Market Analysis, Insights and Forecast - by Component
- 11. Middle East and Africa Software Composition Analysis Market Analysis, Insights and Forecast, 2020-2032
- 11.1. Market Analysis, Insights and Forecast - by Component
- 11.1.1. Solution
- 11.1.2. Services
- 11.2. Market Analysis, Insights and Forecast - by Deployment Mode
- 11.2.1. Cloud
- 11.2.2. On-premises
- 11.3. Market Analysis, Insights and Forecast - by Industry Vertical
- 11.3.1. IT & Telecom
- 11.3.2. BFSI
- 11.3.3. Retail & E-Commerce
- 11.3.4. Government
- 11.3.5. Other Industry Verticals (Healthcare, Automotive)
- 11.1. Market Analysis, Insights and Forecast - by Component
- 12. Competitive Analysis
- 12.1. Company Profiles
- 12.1.1 WhiteHat Security Inc
- 12.1.1.1. Company Overview
- 12.1.1.2. Products
- 12.1.1.3. Company Financials
- 12.1.1.4. SWOT Analysis
- 12.1.2 NexB Inc
- 12.1.2.1. Company Overview
- 12.1.2.2. Products
- 12.1.2.3. Company Financials
- 12.1.2.4. SWOT Analysis
- 12.1.3 Sonatype Inc
- 12.1.3.1. Company Overview
- 12.1.3.2. Products
- 12.1.3.3. Company Financials
- 12.1.3.4. SWOT Analysis
- 12.1.4 Veracode Inc
- 12.1.4.1. Company Overview
- 12.1.4.2. Products
- 12.1.4.3. Company Financials
- 12.1.4.4. SWOT Analysis
- 12.1.5 Flexera Inc
- 12.1.5.1. Company Overview
- 12.1.5.2. Products
- 12.1.5.3. Company Financials
- 12.1.5.4. SWOT Analysis
- 12.1.6 WhiteSource Software Inc
- 12.1.6.1. Company Overview
- 12.1.6.2. Products
- 12.1.6.3. Company Financials
- 12.1.6.4. SWOT Analysis
- 12.1.7 SourceClear Inc
- 12.1.7.1. Company Overview
- 12.1.7.2. Products
- 12.1.7.3. Company Financials
- 12.1.7.4. SWOT Analysis
- 12.1.8 Contrast Security Inc
- 12.1.8.1. Company Overview
- 12.1.8.2. Products
- 12.1.8.3. Company Financials
- 12.1.8.4. SWOT Analysis
- 12.1.9 Rogue Wave Softwar
- 12.1.9.1. Company Overview
- 12.1.9.2. Products
- 12.1.9.3. Company Financials
- 12.1.9.4. SWOT Analysis
- 12.1.10 Synopsys Inc
- 12.1.10.1. Company Overview
- 12.1.10.2. Products
- 12.1.10.3. Company Financials
- 12.1.10.4. SWOT Analysis
- 12.1.11 Dahua Technology Co Ltd
- 12.1.11.1. Company Overview
- 12.1.11.2. Products
- 12.1.11.3. Company Financials
- 12.1.11.4. SWOT Analysis
- 12.1.1 WhiteHat Security Inc
- 12.2. Market Entropy
- 12.2.1 Company's Key Areas Served
- 12.2.2 Recent Developments
- 12.3. Company Market Share Analysis 2025
- 12.3.1 Top 5 Companies Market Share Analysis
- 12.3.2 Top 3 Companies Market Share Analysis
- 12.4. List of Potential Customers
- 13. Research Methodology
List of Figures
- Figure 1: Global Software Composition Analysis Market Revenue Breakdown (billion, %) by Region 2025 & 2033
- Figure 2: North America Software Composition Analysis Market Revenue (billion), by Component 2025 & 2033
- Figure 3: North America Software Composition Analysis Market Revenue Share (%), by Component 2025 & 2033
- Figure 4: North America Software Composition Analysis Market Revenue (billion), by Deployment Mode 2025 & 2033
- Figure 5: North America Software Composition Analysis Market Revenue Share (%), by Deployment Mode 2025 & 2033
- Figure 6: North America Software Composition Analysis Market Revenue (billion), by Industry Vertical 2025 & 2033
- Figure 7: North America Software Composition Analysis Market Revenue Share (%), by Industry Vertical 2025 & 2033
- Figure 8: North America Software Composition Analysis Market Revenue (billion), by Country 2025 & 2033
- Figure 9: North America Software Composition Analysis Market Revenue Share (%), by Country 2025 & 2033
- Figure 10: Europe Software Composition Analysis Market Revenue (billion), by Component 2025 & 2033
- Figure 11: Europe Software Composition Analysis Market Revenue Share (%), by Component 2025 & 2033
- Figure 12: Europe Software Composition Analysis Market Revenue (billion), by Deployment Mode 2025 & 2033
- Figure 13: Europe Software Composition Analysis Market Revenue Share (%), by Deployment Mode 2025 & 2033
- Figure 14: Europe Software Composition Analysis Market Revenue (billion), by Industry Vertical 2025 & 2033
- Figure 15: Europe Software Composition Analysis Market Revenue Share (%), by Industry Vertical 2025 & 2033
- Figure 16: Europe Software Composition Analysis Market Revenue (billion), by Country 2025 & 2033
- Figure 17: Europe Software Composition Analysis Market Revenue Share (%), by Country 2025 & 2033
- Figure 18: Asia Pacific Software Composition Analysis Market Revenue (billion), by Component 2025 & 2033
- Figure 19: Asia Pacific Software Composition Analysis Market Revenue Share (%), by Component 2025 & 2033
- Figure 20: Asia Pacific Software Composition Analysis Market Revenue (billion), by Deployment Mode 2025 & 2033
- Figure 21: Asia Pacific Software Composition Analysis Market Revenue Share (%), by Deployment Mode 2025 & 2033
- Figure 22: Asia Pacific Software Composition Analysis Market Revenue (billion), by Industry Vertical 2025 & 2033
- Figure 23: Asia Pacific Software Composition Analysis Market Revenue Share (%), by Industry Vertical 2025 & 2033
- Figure 24: Asia Pacific Software Composition Analysis Market Revenue (billion), by Country 2025 & 2033
- Figure 25: Asia Pacific Software Composition Analysis Market Revenue Share (%), by Country 2025 & 2033
- Figure 26: Latin America Software Composition Analysis Market Revenue (billion), by Component 2025 & 2033
- Figure 27: Latin America Software Composition Analysis Market Revenue Share (%), by Component 2025 & 2033
- Figure 28: Latin America Software Composition Analysis Market Revenue (billion), by Deployment Mode 2025 & 2033
- Figure 29: Latin America Software Composition Analysis Market Revenue Share (%), by Deployment Mode 2025 & 2033
- Figure 30: Latin America Software Composition Analysis Market Revenue (billion), by Industry Vertical 2025 & 2033
- Figure 31: Latin America Software Composition Analysis Market Revenue Share (%), by Industry Vertical 2025 & 2033
- Figure 32: Latin America Software Composition Analysis Market Revenue (billion), by Country 2025 & 2033
- Figure 33: Latin America Software Composition Analysis Market Revenue Share (%), by Country 2025 & 2033
- Figure 34: Middle East and Africa Software Composition Analysis Market Revenue (billion), by Component 2025 & 2033
- Figure 35: Middle East and Africa Software Composition Analysis Market Revenue Share (%), by Component 2025 & 2033
- Figure 36: Middle East and Africa Software Composition Analysis Market Revenue (billion), by Deployment Mode 2025 & 2033
- Figure 37: Middle East and Africa Software Composition Analysis Market Revenue Share (%), by Deployment Mode 2025 & 2033
- Figure 38: Middle East and Africa Software Composition Analysis Market Revenue (billion), by Industry Vertical 2025 & 2033
- Figure 39: Middle East and Africa Software Composition Analysis Market Revenue Share (%), by Industry Vertical 2025 & 2033
- Figure 40: Middle East and Africa Software Composition Analysis Market Revenue (billion), by Country 2025 & 2033
- Figure 41: Middle East and Africa Software Composition Analysis Market Revenue Share (%), by Country 2025 & 2033
List of Tables
- Table 1: Global Software Composition Analysis Market Revenue billion Forecast, by Component 2020 & 2033
- Table 2: Global Software Composition Analysis Market Revenue billion Forecast, by Deployment Mode 2020 & 2033
- Table 3: Global Software Composition Analysis Market Revenue billion Forecast, by Industry Vertical 2020 & 2033
- Table 4: Global Software Composition Analysis Market Revenue billion Forecast, by Region 2020 & 2033
- Table 5: Global Software Composition Analysis Market Revenue billion Forecast, by Component 2020 & 2033
- Table 6: Global Software Composition Analysis Market Revenue billion Forecast, by Deployment Mode 2020 & 2033
- Table 7: Global Software Composition Analysis Market Revenue billion Forecast, by Industry Vertical 2020 & 2033
- Table 8: Global Software Composition Analysis Market Revenue billion Forecast, by Country 2020 & 2033
- Table 9: Global Software Composition Analysis Market Revenue billion Forecast, by Component 2020 & 2033
- Table 10: Global Software Composition Analysis Market Revenue billion Forecast, by Deployment Mode 2020 & 2033
- Table 11: Global Software Composition Analysis Market Revenue billion Forecast, by Industry Vertical 2020 & 2033
- Table 12: Global Software Composition Analysis Market Revenue billion Forecast, by Country 2020 & 2033
- Table 13: Global Software Composition Analysis Market Revenue billion Forecast, by Component 2020 & 2033
- Table 14: Global Software Composition Analysis Market Revenue billion Forecast, by Deployment Mode 2020 & 2033
- Table 15: Global Software Composition Analysis Market Revenue billion Forecast, by Industry Vertical 2020 & 2033
- Table 16: Global Software Composition Analysis Market Revenue billion Forecast, by Country 2020 & 2033
- Table 17: Global Software Composition Analysis Market Revenue billion Forecast, by Component 2020 & 2033
- Table 18: Global Software Composition Analysis Market Revenue billion Forecast, by Deployment Mode 2020 & 2033
- Table 19: Global Software Composition Analysis Market Revenue billion Forecast, by Industry Vertical 2020 & 2033
- Table 20: Global Software Composition Analysis Market Revenue billion Forecast, by Country 2020 & 2033
- Table 21: Global Software Composition Analysis Market Revenue billion Forecast, by Component 2020 & 2033
- Table 22: Global Software Composition Analysis Market Revenue billion Forecast, by Deployment Mode 2020 & 2033
- Table 23: Global Software Composition Analysis Market Revenue billion Forecast, by Industry Vertical 2020 & 2033
- Table 24: Global Software Composition Analysis Market Revenue billion Forecast, by Country 2020 & 2033
Frequently Asked Questions
1. What is the projected Compound Annual Growth Rate (CAGR) of the Software Composition Analysis Market?
The projected CAGR is approximately 8.62%.
2. Which companies are prominent players in the Software Composition Analysis Market?
Key companies in the market include WhiteHat Security Inc, NexB Inc, Sonatype Inc, Veracode Inc, Flexera Inc, WhiteSource Software Inc, SourceClear Inc, Contrast Security Inc, Rogue Wave Softwar, Synopsys Inc, Dahua Technology Co Ltd.
3. What are the main segments of the Software Composition Analysis Market?
The market segments include Component, Deployment Mode, Industry Vertical .
4. Can you provide details about the market size?
The market size is estimated to be USD 5.76 billion as of 2022.
5. What are some drivers contributing to market growth?
Commercial and IoT-based Software Products' Dependence on Open-Source Codes; Strict Laws & Regulations and Growing Levels of Threats and Risks in Open-Source Codes.
6. What are the notable trends driving market growth?
Cloud Segment is one of the Factor Driving the Market.
7. Are there any restraints impacting market growth?
Shortage of Technical Expertise Amongst the Enterprise Workforce; Smooth Services and Agility Due to Devops Repress the Growth.
8. Can you provide examples of recent developments in the market?
February 2023: SOOS has announced a new cooperation with Vanta to make it easier to declare software dependencies to fulfill worldwide security, privacy, and regulatory standards. Vanta helps businesses automate their compliance with the most important security and privacy frameworks, like SOC 2, ISO 27001, HIPAA, GDPR, and others, and scale their security processes.
9. What pricing options are available for accessing the report?
Pricing options include single-user, multi-user, and enterprise licenses priced at USD 4750, USD 5250, and USD 8750 respectively.
10. Is the market size provided in terms of value or volume?
The market size is provided in terms of value, measured in billion.
11. Are there any specific market keywords associated with the report?
Yes, the market keyword associated with the report is "Software Composition Analysis Market," which aids in identifying and referencing the specific market segment covered.
12. How do I determine which pricing option suits my needs best?
The pricing options vary based on user requirements and access needs. Individual users may opt for single-user licenses, while businesses requiring broader access may choose multi-user or enterprise licenses for cost-effective access to the report.
13. Are there any additional resources or data provided in the Software Composition Analysis Market report?
While the report offers comprehensive insights, it's advisable to review the specific contents or supplementary materials provided to ascertain if additional resources or data are available.
14. How can I stay updated on further developments or reports in the Software Composition Analysis Market?
To stay informed about further developments, trends, and reports in the Software Composition Analysis Market, consider subscribing to industry newsletters, following relevant companies and organizations, or regularly checking reputable industry news sources and publications.
Methodology
Step 1 - Identification of Relevant Samples Size from Population Database


Step 2 - Approaches for Defining Global Market Size (Value, Volume* & Price*)

Note*: In applicable scenarios
Step 3 - Data Sources
Primary Research
- Web Analytics
- Survey Reports
- Research Institute
- Latest Research Reports
- Opinion Leaders
Secondary Research
- Annual Reports
- White Paper
- Latest Press Release
- Industry Association
- Paid Database
- Investor Presentations

Step 4 - Data Triangulation
Involves using different sources of information in order to increase the validity of a study
These sources are likely to be stakeholders in a program - participants, other researchers, program staff, other community members, and so on.
Then we put all data in single framework & apply various statistical tools to find out the dynamic on the market.
During the analysis stage, feedback from the stakeholder groups would be compared to determine areas of agreement as well as areas of divergence