

Key Insights
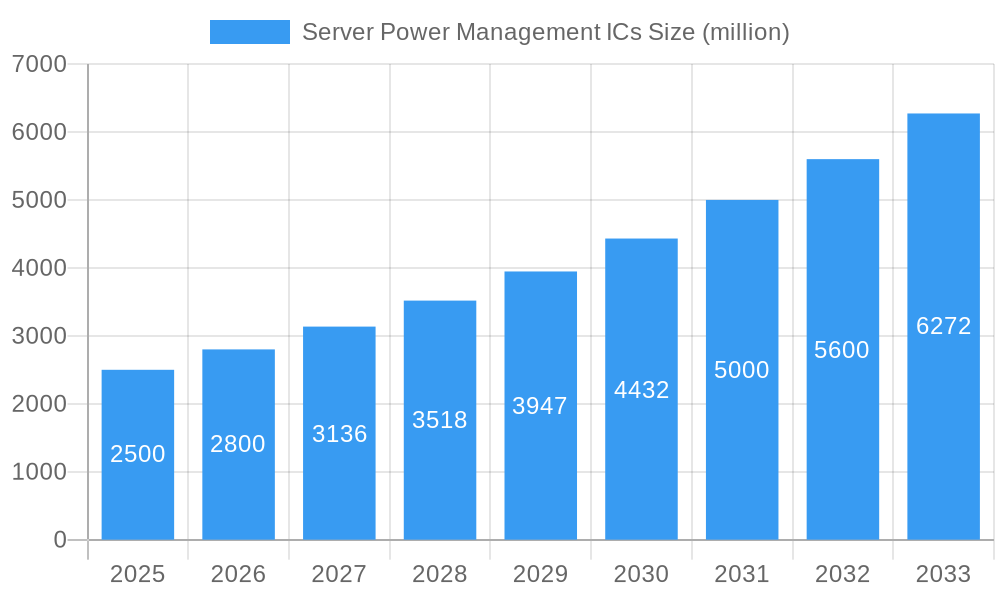
The server power management integrated circuit (PMIC) market is experiencing robust growth, driven by the increasing demand for energy-efficient data centers and the proliferation of high-performance computing (HPC) applications. The market, estimated at $2.5 billion in 2025, is projected to achieve a Compound Annual Growth Rate (CAGR) of 12% from 2025 to 2033, reaching approximately $6 billion by 2033. This expansion is fueled by several key factors: the rising adoption of cloud computing and edge computing, which necessitates efficient power management in increasingly dense server deployments; the growing prevalence of artificial intelligence (AI) and machine learning (ML) workloads, demanding significant processing power and, consequently, sophisticated power management solutions; and the ongoing push for sustainability within data centers, driving the need for optimized power consumption. Key players like Texas Instruments, Analog Devices, Infineon Technologies, onsemi, MPS, Renesas Electronics, JOULWATT, and Bright Power Semiconductor are actively competing in this dynamic market, constantly innovating to meet the evolving demands of server manufacturers.
Server Power Management ICs Market Size (In Billion)
The market segmentation is largely defined by the type of server (e.g., blade servers, rack servers), the power level managed, and the specific features offered by the PMICs. While precise segment breakdowns are unavailable, it is reasonable to assume that high-performance computing servers, requiring more sophisticated power management, represent a significant portion of the market. Geographic distribution shows strong growth in North America and Asia-Pacific, reflecting the concentration of data centers and technological advancements in these regions. Market restraints include potential supply chain disruptions and the complexities of designing PMICs capable of handling the ever-increasing power demands of modern servers. However, continuous innovation in silicon technology and packaging solutions is mitigating these challenges and promoting sustainable market expansion.
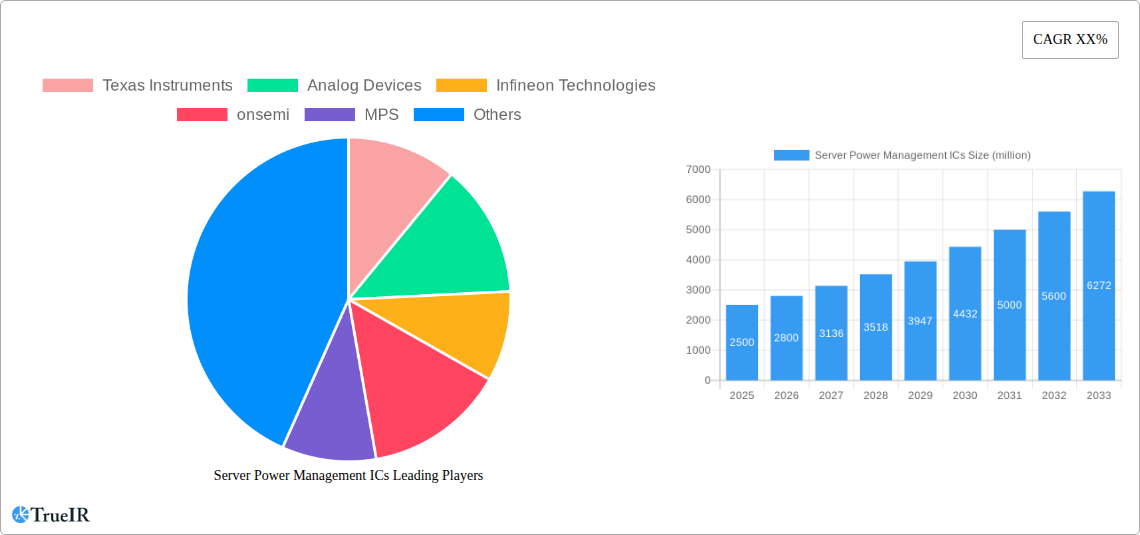
Server Power Management ICs Company Market Share
Server Power Management ICs Market: A Comprehensive Report (2019-2033)
This dynamic report provides a comprehensive analysis of the Server Power Management ICs market, offering invaluable insights for industry stakeholders. We delve into market structure, competitive dynamics, growth trends, and future projections, covering the period from 2019 to 2033. The report leverages extensive data analysis to deliver actionable intelligence, forecasting a market valued at $XX billion by 2033.
Server Power Management ICs Market Structure & Competitive Landscape
The Server Power Management ICs market exhibits a moderately concentrated structure, with key players such as Texas Instruments, Analog Devices, Infineon Technologies, onsemi, MPS, Renesas Electronics, JOULWATT, and Bright Power Semiconductor holding significant market share. The market concentration ratio (CR4) is estimated at xx% in 2025. Innovation is a primary driver, with companies constantly striving to improve efficiency, power density, and thermal management. Regulatory compliance, particularly regarding energy efficiency standards (e.g., EU's Ecodesign Directive), significantly impacts market dynamics. Product substitutes, such as alternative power architectures, present a challenge, although the inherent advantages of ICs in terms of integration and cost-effectiveness often prevail.
The market is segmented primarily by end-user (data centers, cloud computing providers, enterprise servers) and by IC type (DC-DC converters, AC-DC converters, voltage regulators). Mergers and acquisitions (M&A) activity has been moderate in recent years, with xx major deals recorded between 2019 and 2024, primarily driven by strategic expansion and technology acquisition. Qualitative insights indicate a trend towards increased vertical integration, with larger companies acquiring smaller specialized firms to bolster their product portfolios.
Server Power Management ICs Market Trends & Opportunities
The Server Power Management ICs market is experiencing robust growth, with a Compound Annual Growth Rate (CAGR) projected at xx% during the forecast period (2025-2033). This growth is fueled by several factors: the explosive growth of data centers and cloud computing, the increasing demand for energy-efficient servers, and the ongoing advancements in server architectures. Technological shifts, particularly towards higher power densities and increased integration, are creating significant opportunities for innovation. Consumer preferences are increasingly focused on sustainability and reduced energy consumption, further driving demand for efficient power management solutions. The competitive landscape is characterized by intense rivalry, with companies vying for market share through product innovation, strategic partnerships, and aggressive pricing strategies. Market penetration rates for advanced IC technologies, such as GaN-based solutions, are expected to increase significantly in the coming years. The market size is projected to reach $XX billion by 2033, reflecting a considerable expansion from the $XX billion estimated for 2025.
Dominant Markets & Segments in Server Power Management ICs
The North American region currently dominates the Server Power Management ICs market, driven by the high concentration of data centers and cloud computing infrastructure. China is experiencing rapid growth, fueled by increasing domestic demand and government support for digital infrastructure development.
- Key Growth Drivers in North America: Robust investments in cloud computing, stringent energy efficiency regulations, and a mature technology ecosystem.
- Key Growth Drivers in China: Rapid expansion of data centers, government initiatives promoting digital transformation, and increasing domestic semiconductor manufacturing capabilities.
- Key Growth Drivers in Europe: Growing adoption of high-performance computing, increasing focus on renewable energy integration, and supportive policies promoting energy efficiency.
The data center segment holds the largest share of the market, owing to the high power consumption of these facilities. However, the edge computing segment is anticipated to experience faster growth in the coming years, driven by the decentralized nature of edge applications and the increasing demand for low-latency processing.
Server Power Management ICs Product Analysis
Significant advancements in Server Power Management ICs include the adoption of GaN (Gallium Nitride) and SiC (Silicon Carbide) technologies, enabling higher switching frequencies and improved efficiency. These innovations lead to smaller form factors, reduced heat dissipation, and increased power density. Products are tailored to specific server applications, addressing varying power requirements and thermal constraints. The competitive advantage hinges on superior efficiency, cost-effectiveness, integration levels, and adherence to industry standards.
Key Drivers, Barriers & Challenges in Server Power Management ICs
Key Drivers: The growing adoption of cloud computing and big data analytics, stringent energy efficiency regulations, increasing demand for high-performance computing, and the need for reliable power delivery solutions in data centers are driving growth.
Key Challenges: The semiconductor industry's dependence on global supply chains makes it vulnerable to geopolitical risks and disruptions. Stringent regulatory approvals and certifications add to product development timelines and costs. Intense competition among established players and the emergence of new entrants creates price pressure and necessitates continuous innovation to maintain a competitive edge. Supply chain disruptions caused a xx% increase in production costs during 2022, impacting market profitability.
Growth Drivers in the Server Power Management ICs Market
The key drivers for growth include: The rapid expansion of data centers globally, the rise of AI and machine learning applications demanding high processing power, and increasing government regulations promoting energy efficiency. These factors are collectively pushing the need for more advanced and efficient power management solutions in servers.
Challenges Impacting Server Power Management ICs Growth
Major challenges include supply chain constraints impacting component availability and increasing production costs, escalating competition from established and emerging players, and regulatory hurdles related to compliance with energy efficiency standards and data security regulations.
Key Players Shaping the Server Power Management ICs Market
- Texas Instruments
- Analog Devices
- Infineon Technologies
- onsemi
- MPS
- Renesas Electronics
- JOULWATT
- Bright Power Semiconductor
Significant Server Power Management ICs Industry Milestones
- 2020: Texas Instruments launched its new family of high-efficiency GaN-based power ICs.
- 2021: Analog Devices acquired Maxim Integrated, strengthening its position in the power management market.
- 2022: Infineon announced a significant investment in its SiC manufacturing capacity.
- 2023: Onsemi introduced a new generation of power management ICs optimized for AI servers.
Future Outlook for Server Power Management ICs Market
The Server Power Management ICs market is poised for continued growth, driven by the ongoing expansion of data centers, cloud computing, and high-performance computing. Strategic opportunities exist in developing energy-efficient power solutions for next-generation server architectures, particularly those utilizing AI and machine learning. The market potential is substantial, with projections indicating significant revenue growth throughout the forecast period.
Server Power Management ICs Segmentation
-
1. Application
- 1.1. General Purpose Server
- 1.2. AI Server
-
2. Types
- 2.1. DrMOS
- 2.2. Multiphase Controller
- 2.3. Others
Server Power Management ICs Segmentation By Geography
-
1. North America
- 1.1. United States
- 1.2. Canada
- 1.3. Mexico
-
2. South America
- 2.1. Brazil
- 2.2. Argentina
- 2.3. Rest of South America
-
3. Europe
- 3.1. United Kingdom
- 3.2. Germany
- 3.3. France
- 3.4. Italy
- 3.5. Spain
- 3.6. Russia
- 3.7. Benelux
- 3.8. Nordics
- 3.9. Rest of Europe
-
4. Middle East & Africa
- 4.1. Turkey
- 4.2. Israel
- 4.3. GCC
- 4.4. North Africa
- 4.5. South Africa
- 4.6. Rest of Middle East & Africa
-
5. Asia Pacific
- 5.1. China
- 5.2. India
- 5.3. Japan
- 5.4. South Korea
- 5.5. ASEAN
- 5.6. Oceania
- 5.7. Rest of Asia Pacific
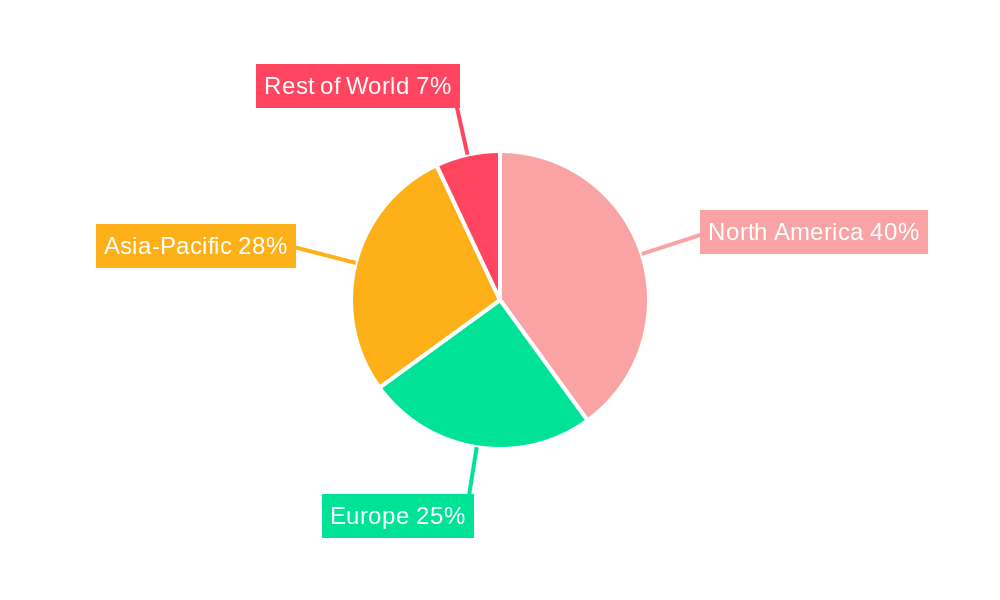
Server Power Management ICs Regional Market Share
Geographic Coverage of Server Power Management ICs
Server Power Management ICs REPORT HIGHLIGHTS
| Aspects | Details |
|---|---|
| Study Period | 2020-2034 |
| Base Year | 2025 |
| Estimated Year | 2026 |
| Forecast Period | 2026-2034 |
| Historical Period | 2020-2025 |
| Growth Rate | CAGR of 12% from 2020-2034 |
| Segmentation |
|
Table of Contents
- 1. Introduction
- 1.1. Research Scope
- 1.2. Market Segmentation
- 1.3. Research Methodology
- 1.4. Definitions and Assumptions
- 2. Executive Summary
- 2.1. Introduction
- 3. Market Dynamics
- 3.1. Introduction
- 3.2. Market Drivers
- 3.3. Market Restrains
- 3.4. Market Trends
- 4. Market Factor Analysis
- 4.1. Porters Five Forces
- 4.2. Supply/Value Chain
- 4.3. PESTEL analysis
- 4.4. Market Entropy
- 4.5. Patent/Trademark Analysis
- 5. Global Server Power Management ICs Analysis, Insights and Forecast, 2020-2032
- 5.1. Market Analysis, Insights and Forecast - by Application
- 5.1.1. General Purpose Server
- 5.1.2. AI Server
- 5.2. Market Analysis, Insights and Forecast - by Types
- 5.2.1. DrMOS
- 5.2.2. Multiphase Controller
- 5.2.3. Others
- 5.3. Market Analysis, Insights and Forecast - by Region
- 5.3.1. North America
- 5.3.2. South America
- 5.3.3. Europe
- 5.3.4. Middle East & Africa
- 5.3.5. Asia Pacific
- 5.1. Market Analysis, Insights and Forecast - by Application
- 6. North America Server Power Management ICs Analysis, Insights and Forecast, 2020-2032
- 6.1. Market Analysis, Insights and Forecast - by Application
- 6.1.1. General Purpose Server
- 6.1.2. AI Server
- 6.2. Market Analysis, Insights and Forecast - by Types
- 6.2.1. DrMOS
- 6.2.2. Multiphase Controller
- 6.2.3. Others
- 6.1. Market Analysis, Insights and Forecast - by Application
- 7. South America Server Power Management ICs Analysis, Insights and Forecast, 2020-2032
- 7.1. Market Analysis, Insights and Forecast - by Application
- 7.1.1. General Purpose Server
- 7.1.2. AI Server
- 7.2. Market Analysis, Insights and Forecast - by Types
- 7.2.1. DrMOS
- 7.2.2. Multiphase Controller
- 7.2.3. Others
- 7.1. Market Analysis, Insights and Forecast - by Application
- 8. Europe Server Power Management ICs Analysis, Insights and Forecast, 2020-2032
- 8.1. Market Analysis, Insights and Forecast - by Application
- 8.1.1. General Purpose Server
- 8.1.2. AI Server
- 8.2. Market Analysis, Insights and Forecast - by Types
- 8.2.1. DrMOS
- 8.2.2. Multiphase Controller
- 8.2.3. Others
- 8.1. Market Analysis, Insights and Forecast - by Application
- 9. Middle East & Africa Server Power Management ICs Analysis, Insights and Forecast, 2020-2032
- 9.1. Market Analysis, Insights and Forecast - by Application
- 9.1.1. General Purpose Server
- 9.1.2. AI Server
- 9.2. Market Analysis, Insights and Forecast - by Types
- 9.2.1. DrMOS
- 9.2.2. Multiphase Controller
- 9.2.3. Others
- 9.1. Market Analysis, Insights and Forecast - by Application
- 10. Asia Pacific Server Power Management ICs Analysis, Insights and Forecast, 2020-2032
- 10.1. Market Analysis, Insights and Forecast - by Application
- 10.1.1. General Purpose Server
- 10.1.2. AI Server
- 10.2. Market Analysis, Insights and Forecast - by Types
- 10.2.1. DrMOS
- 10.2.2. Multiphase Controller
- 10.2.3. Others
- 10.1. Market Analysis, Insights and Forecast - by Application
- 11. Competitive Analysis
- 11.1. Global Market Share Analysis 2025
- 11.2. Company Profiles
- 11.2.1 Texas Instruments
- 11.2.1.1. Overview
- 11.2.1.2. Products
- 11.2.1.3. SWOT Analysis
- 11.2.1.4. Recent Developments
- 11.2.1.5. Financials (Based on Availability)
- 11.2.2 Analog Devices
- 11.2.2.1. Overview
- 11.2.2.2. Products
- 11.2.2.3. SWOT Analysis
- 11.2.2.4. Recent Developments
- 11.2.2.5. Financials (Based on Availability)
- 11.2.3 Infineon Technologies
- 11.2.3.1. Overview
- 11.2.3.2. Products
- 11.2.3.3. SWOT Analysis
- 11.2.3.4. Recent Developments
- 11.2.3.5. Financials (Based on Availability)
- 11.2.4 onsemi
- 11.2.4.1. Overview
- 11.2.4.2. Products
- 11.2.4.3. SWOT Analysis
- 11.2.4.4. Recent Developments
- 11.2.4.5. Financials (Based on Availability)
- 11.2.5 MPS
- 11.2.5.1. Overview
- 11.2.5.2. Products
- 11.2.5.3. SWOT Analysis
- 11.2.5.4. Recent Developments
- 11.2.5.5. Financials (Based on Availability)
- 11.2.6 Renesas Electronics
- 11.2.6.1. Overview
- 11.2.6.2. Products
- 11.2.6.3. SWOT Analysis
- 11.2.6.4. Recent Developments
- 11.2.6.5. Financials (Based on Availability)
- 11.2.7 JOULWATT
- 11.2.7.1. Overview
- 11.2.7.2. Products
- 11.2.7.3. SWOT Analysis
- 11.2.7.4. Recent Developments
- 11.2.7.5. Financials (Based on Availability)
- 11.2.8 Bright Power Semiconductor
- 11.2.8.1. Overview
- 11.2.8.2. Products
- 11.2.8.3. SWOT Analysis
- 11.2.8.4. Recent Developments
- 11.2.8.5. Financials (Based on Availability)
- 11.2.1 Texas Instruments
List of Figures
- Figure 1: Global Server Power Management ICs Revenue Breakdown (undefined, %) by Region 2025 & 2033
- Figure 2: Global Server Power Management ICs Volume Breakdown (K, %) by Region 2025 & 2033
- Figure 3: North America Server Power Management ICs Revenue (undefined), by Application 2025 & 2033
- Figure 4: North America Server Power Management ICs Volume (K), by Application 2025 & 2033
- Figure 5: North America Server Power Management ICs Revenue Share (%), by Application 2025 & 2033
- Figure 6: North America Server Power Management ICs Volume Share (%), by Application 2025 & 2033
- Figure 7: North America Server Power Management ICs Revenue (undefined), by Types 2025 & 2033
- Figure 8: North America Server Power Management ICs Volume (K), by Types 2025 & 2033
- Figure 9: North America Server Power Management ICs Revenue Share (%), by Types 2025 & 2033
- Figure 10: North America Server Power Management ICs Volume Share (%), by Types 2025 & 2033
- Figure 11: North America Server Power Management ICs Revenue (undefined), by Country 2025 & 2033
- Figure 12: North America Server Power Management ICs Volume (K), by Country 2025 & 2033
- Figure 13: North America Server Power Management ICs Revenue Share (%), by Country 2025 & 2033
- Figure 14: North America Server Power Management ICs Volume Share (%), by Country 2025 & 2033
- Figure 15: South America Server Power Management ICs Revenue (undefined), by Application 2025 & 2033
- Figure 16: South America Server Power Management ICs Volume (K), by Application 2025 & 2033
- Figure 17: South America Server Power Management ICs Revenue Share (%), by Application 2025 & 2033
- Figure 18: South America Server Power Management ICs Volume Share (%), by Application 2025 & 2033
- Figure 19: South America Server Power Management ICs Revenue (undefined), by Types 2025 & 2033
- Figure 20: South America Server Power Management ICs Volume (K), by Types 2025 & 2033
- Figure 21: South America Server Power Management ICs Revenue Share (%), by Types 2025 & 2033
- Figure 22: South America Server Power Management ICs Volume Share (%), by Types 2025 & 2033
- Figure 23: South America Server Power Management ICs Revenue (undefined), by Country 2025 & 2033
- Figure 24: South America Server Power Management ICs Volume (K), by Country 2025 & 2033
- Figure 25: South America Server Power Management ICs Revenue Share (%), by Country 2025 & 2033
- Figure 26: South America Server Power Management ICs Volume Share (%), by Country 2025 & 2033
- Figure 27: Europe Server Power Management ICs Revenue (undefined), by Application 2025 & 2033
- Figure 28: Europe Server Power Management ICs Volume (K), by Application 2025 & 2033
- Figure 29: Europe Server Power Management ICs Revenue Share (%), by Application 2025 & 2033
- Figure 30: Europe Server Power Management ICs Volume Share (%), by Application 2025 & 2033
- Figure 31: Europe Server Power Management ICs Revenue (undefined), by Types 2025 & 2033
- Figure 32: Europe Server Power Management ICs Volume (K), by Types 2025 & 2033
- Figure 33: Europe Server Power Management ICs Revenue Share (%), by Types 2025 & 2033
- Figure 34: Europe Server Power Management ICs Volume Share (%), by Types 2025 & 2033
- Figure 35: Europe Server Power Management ICs Revenue (undefined), by Country 2025 & 2033
- Figure 36: Europe Server Power Management ICs Volume (K), by Country 2025 & 2033
- Figure 37: Europe Server Power Management ICs Revenue Share (%), by Country 2025 & 2033
- Figure 38: Europe Server Power Management ICs Volume Share (%), by Country 2025 & 2033
- Figure 39: Middle East & Africa Server Power Management ICs Revenue (undefined), by Application 2025 & 2033
- Figure 40: Middle East & Africa Server Power Management ICs Volume (K), by Application 2025 & 2033
- Figure 41: Middle East & Africa Server Power Management ICs Revenue Share (%), by Application 2025 & 2033
- Figure 42: Middle East & Africa Server Power Management ICs Volume Share (%), by Application 2025 & 2033
- Figure 43: Middle East & Africa Server Power Management ICs Revenue (undefined), by Types 2025 & 2033
- Figure 44: Middle East & Africa Server Power Management ICs Volume (K), by Types 2025 & 2033
- Figure 45: Middle East & Africa Server Power Management ICs Revenue Share (%), by Types 2025 & 2033
- Figure 46: Middle East & Africa Server Power Management ICs Volume Share (%), by Types 2025 & 2033
- Figure 47: Middle East & Africa Server Power Management ICs Revenue (undefined), by Country 2025 & 2033
- Figure 48: Middle East & Africa Server Power Management ICs Volume (K), by Country 2025 & 2033
- Figure 49: Middle East & Africa Server Power Management ICs Revenue Share (%), by Country 2025 & 2033
- Figure 50: Middle East & Africa Server Power Management ICs Volume Share (%), by Country 2025 & 2033
- Figure 51: Asia Pacific Server Power Management ICs Revenue (undefined), by Application 2025 & 2033
- Figure 52: Asia Pacific Server Power Management ICs Volume (K), by Application 2025 & 2033
- Figure 53: Asia Pacific Server Power Management ICs Revenue Share (%), by Application 2025 & 2033
- Figure 54: Asia Pacific Server Power Management ICs Volume Share (%), by Application 2025 & 2033
- Figure 55: Asia Pacific Server Power Management ICs Revenue (undefined), by Types 2025 & 2033
- Figure 56: Asia Pacific Server Power Management ICs Volume (K), by Types 2025 & 2033
- Figure 57: Asia Pacific Server Power Management ICs Revenue Share (%), by Types 2025 & 2033
- Figure 58: Asia Pacific Server Power Management ICs Volume Share (%), by Types 2025 & 2033
- Figure 59: Asia Pacific Server Power Management ICs Revenue (undefined), by Country 2025 & 2033
- Figure 60: Asia Pacific Server Power Management ICs Volume (K), by Country 2025 & 2033
- Figure 61: Asia Pacific Server Power Management ICs Revenue Share (%), by Country 2025 & 2033
- Figure 62: Asia Pacific Server Power Management ICs Volume Share (%), by Country 2025 & 2033
List of Tables
- Table 1: Global Server Power Management ICs Revenue undefined Forecast, by Application 2020 & 2033
- Table 2: Global Server Power Management ICs Volume K Forecast, by Application 2020 & 2033
- Table 3: Global Server Power Management ICs Revenue undefined Forecast, by Types 2020 & 2033
- Table 4: Global Server Power Management ICs Volume K Forecast, by Types 2020 & 2033
- Table 5: Global Server Power Management ICs Revenue undefined Forecast, by Region 2020 & 2033
- Table 6: Global Server Power Management ICs Volume K Forecast, by Region 2020 & 2033
- Table 7: Global Server Power Management ICs Revenue undefined Forecast, by Application 2020 & 2033
- Table 8: Global Server Power Management ICs Volume K Forecast, by Application 2020 & 2033
- Table 9: Global Server Power Management ICs Revenue undefined Forecast, by Types 2020 & 2033
- Table 10: Global Server Power Management ICs Volume K Forecast, by Types 2020 & 2033
- Table 11: Global Server Power Management ICs Revenue undefined Forecast, by Country 2020 & 2033
- Table 12: Global Server Power Management ICs Volume K Forecast, by Country 2020 & 2033
- Table 13: United States Server Power Management ICs Revenue (undefined) Forecast, by Application 2020 & 2033
- Table 14: United States Server Power Management ICs Volume (K) Forecast, by Application 2020 & 2033
- Table 15: Canada Server Power Management ICs Revenue (undefined) Forecast, by Application 2020 & 2033
- Table 16: Canada Server Power Management ICs Volume (K) Forecast, by Application 2020 & 2033
- Table 17: Mexico Server Power Management ICs Revenue (undefined) Forecast, by Application 2020 & 2033
- Table 18: Mexico Server Power Management ICs Volume (K) Forecast, by Application 2020 & 2033
- Table 19: Global Server Power Management ICs Revenue undefined Forecast, by Application 2020 & 2033
- Table 20: Global Server Power Management ICs Volume K Forecast, by Application 2020 & 2033
- Table 21: Global Server Power Management ICs Revenue undefined Forecast, by Types 2020 & 2033
- Table 22: Global Server Power Management ICs Volume K Forecast, by Types 2020 & 2033
- Table 23: Global Server Power Management ICs Revenue undefined Forecast, by Country 2020 & 2033
- Table 24: Global Server Power Management ICs Volume K Forecast, by Country 2020 & 2033
- Table 25: Brazil Server Power Management ICs Revenue (undefined) Forecast, by Application 2020 & 2033
- Table 26: Brazil Server Power Management ICs Volume (K) Forecast, by Application 2020 & 2033
- Table 27: Argentina Server Power Management ICs Revenue (undefined) Forecast, by Application 2020 & 2033
- Table 28: Argentina Server Power Management ICs Volume (K) Forecast, by Application 2020 & 2033
- Table 29: Rest of South America Server Power Management ICs Revenue (undefined) Forecast, by Application 2020 & 2033
- Table 30: Rest of South America Server Power Management ICs Volume (K) Forecast, by Application 2020 & 2033
- Table 31: Global Server Power Management ICs Revenue undefined Forecast, by Application 2020 & 2033
- Table 32: Global Server Power Management ICs Volume K Forecast, by Application 2020 & 2033
- Table 33: Global Server Power Management ICs Revenue undefined Forecast, by Types 2020 & 2033
- Table 34: Global Server Power Management ICs Volume K Forecast, by Types 2020 & 2033
- Table 35: Global Server Power Management ICs Revenue undefined Forecast, by Country 2020 & 2033
- Table 36: Global Server Power Management ICs Volume K Forecast, by Country 2020 & 2033
- Table 37: United Kingdom Server Power Management ICs Revenue (undefined) Forecast, by Application 2020 & 2033
- Table 38: United Kingdom Server Power Management ICs Volume (K) Forecast, by Application 2020 & 2033
- Table 39: Germany Server Power Management ICs Revenue (undefined) Forecast, by Application 2020 & 2033
- Table 40: Germany Server Power Management ICs Volume (K) Forecast, by Application 2020 & 2033
- Table 41: France Server Power Management ICs Revenue (undefined) Forecast, by Application 2020 & 2033
- Table 42: France Server Power Management ICs Volume (K) Forecast, by Application 2020 & 2033
- Table 43: Italy Server Power Management ICs Revenue (undefined) Forecast, by Application 2020 & 2033
- Table 44: Italy Server Power Management ICs Volume (K) Forecast, by Application 2020 & 2033
- Table 45: Spain Server Power Management ICs Revenue (undefined) Forecast, by Application 2020 & 2033
- Table 46: Spain Server Power Management ICs Volume (K) Forecast, by Application 2020 & 2033
- Table 47: Russia Server Power Management ICs Revenue (undefined) Forecast, by Application 2020 & 2033
- Table 48: Russia Server Power Management ICs Volume (K) Forecast, by Application 2020 & 2033
- Table 49: Benelux Server Power Management ICs Revenue (undefined) Forecast, by Application 2020 & 2033
- Table 50: Benelux Server Power Management ICs Volume (K) Forecast, by Application 2020 & 2033
- Table 51: Nordics Server Power Management ICs Revenue (undefined) Forecast, by Application 2020 & 2033
- Table 52: Nordics Server Power Management ICs Volume (K) Forecast, by Application 2020 & 2033
- Table 53: Rest of Europe Server Power Management ICs Revenue (undefined) Forecast, by Application 2020 & 2033
- Table 54: Rest of Europe Server Power Management ICs Volume (K) Forecast, by Application 2020 & 2033
- Table 55: Global Server Power Management ICs Revenue undefined Forecast, by Application 2020 & 2033
- Table 56: Global Server Power Management ICs Volume K Forecast, by Application 2020 & 2033
- Table 57: Global Server Power Management ICs Revenue undefined Forecast, by Types 2020 & 2033
- Table 58: Global Server Power Management ICs Volume K Forecast, by Types 2020 & 2033
- Table 59: Global Server Power Management ICs Revenue undefined Forecast, by Country 2020 & 2033
- Table 60: Global Server Power Management ICs Volume K Forecast, by Country 2020 & 2033
- Table 61: Turkey Server Power Management ICs Revenue (undefined) Forecast, by Application 2020 & 2033
- Table 62: Turkey Server Power Management ICs Volume (K) Forecast, by Application 2020 & 2033
- Table 63: Israel Server Power Management ICs Revenue (undefined) Forecast, by Application 2020 & 2033
- Table 64: Israel Server Power Management ICs Volume (K) Forecast, by Application 2020 & 2033
- Table 65: GCC Server Power Management ICs Revenue (undefined) Forecast, by Application 2020 & 2033
- Table 66: GCC Server Power Management ICs Volume (K) Forecast, by Application 2020 & 2033
- Table 67: North Africa Server Power Management ICs Revenue (undefined) Forecast, by Application 2020 & 2033
- Table 68: North Africa Server Power Management ICs Volume (K) Forecast, by Application 2020 & 2033
- Table 69: South Africa Server Power Management ICs Revenue (undefined) Forecast, by Application 2020 & 2033
- Table 70: South Africa Server Power Management ICs Volume (K) Forecast, by Application 2020 & 2033
- Table 71: Rest of Middle East & Africa Server Power Management ICs Revenue (undefined) Forecast, by Application 2020 & 2033
- Table 72: Rest of Middle East & Africa Server Power Management ICs Volume (K) Forecast, by Application 2020 & 2033
- Table 73: Global Server Power Management ICs Revenue undefined Forecast, by Application 2020 & 2033
- Table 74: Global Server Power Management ICs Volume K Forecast, by Application 2020 & 2033
- Table 75: Global Server Power Management ICs Revenue undefined Forecast, by Types 2020 & 2033
- Table 76: Global Server Power Management ICs Volume K Forecast, by Types 2020 & 2033
- Table 77: Global Server Power Management ICs Revenue undefined Forecast, by Country 2020 & 2033
- Table 78: Global Server Power Management ICs Volume K Forecast, by Country 2020 & 2033
- Table 79: China Server Power Management ICs Revenue (undefined) Forecast, by Application 2020 & 2033
- Table 80: China Server Power Management ICs Volume (K) Forecast, by Application 2020 & 2033
- Table 81: India Server Power Management ICs Revenue (undefined) Forecast, by Application 2020 & 2033
- Table 82: India Server Power Management ICs Volume (K) Forecast, by Application 2020 & 2033
- Table 83: Japan Server Power Management ICs Revenue (undefined) Forecast, by Application 2020 & 2033
- Table 84: Japan Server Power Management ICs Volume (K) Forecast, by Application 2020 & 2033
- Table 85: South Korea Server Power Management ICs Revenue (undefined) Forecast, by Application 2020 & 2033
- Table 86: South Korea Server Power Management ICs Volume (K) Forecast, by Application 2020 & 2033
- Table 87: ASEAN Server Power Management ICs Revenue (undefined) Forecast, by Application 2020 & 2033
- Table 88: ASEAN Server Power Management ICs Volume (K) Forecast, by Application 2020 & 2033
- Table 89: Oceania Server Power Management ICs Revenue (undefined) Forecast, by Application 2020 & 2033
- Table 90: Oceania Server Power Management ICs Volume (K) Forecast, by Application 2020 & 2033
- Table 91: Rest of Asia Pacific Server Power Management ICs Revenue (undefined) Forecast, by Application 2020 & 2033
- Table 92: Rest of Asia Pacific Server Power Management ICs Volume (K) Forecast, by Application 2020 & 2033
Frequently Asked Questions
1. What is the projected Compound Annual Growth Rate (CAGR) of the Server Power Management ICs?
The projected CAGR is approximately 12%.
2. Which companies are prominent players in the Server Power Management ICs?
Key companies in the market include Texas Instruments, Analog Devices, Infineon Technologies, onsemi, MPS, Renesas Electronics, JOULWATT, Bright Power Semiconductor.
3. What are the main segments of the Server Power Management ICs?
The market segments include Application, Types.
4. Can you provide details about the market size?
The market size is estimated to be USD XXX N/A as of 2022.
5. What are some drivers contributing to market growth?
N/A
6. What are the notable trends driving market growth?
N/A
7. Are there any restraints impacting market growth?
N/A
8. Can you provide examples of recent developments in the market?
N/A
9. What pricing options are available for accessing the report?
Pricing options include single-user, multi-user, and enterprise licenses priced at USD 4350.00, USD 6525.00, and USD 8700.00 respectively.
10. Is the market size provided in terms of value or volume?
The market size is provided in terms of value, measured in N/A and volume, measured in K.
11. Are there any specific market keywords associated with the report?
Yes, the market keyword associated with the report is "Server Power Management ICs," which aids in identifying and referencing the specific market segment covered.
12. How do I determine which pricing option suits my needs best?
The pricing options vary based on user requirements and access needs. Individual users may opt for single-user licenses, while businesses requiring broader access may choose multi-user or enterprise licenses for cost-effective access to the report.
13. Are there any additional resources or data provided in the Server Power Management ICs report?
While the report offers comprehensive insights, it's advisable to review the specific contents or supplementary materials provided to ascertain if additional resources or data are available.
14. How can I stay updated on further developments or reports in the Server Power Management ICs?
To stay informed about further developments, trends, and reports in the Server Power Management ICs, consider subscribing to industry newsletters, following relevant companies and organizations, or regularly checking reputable industry news sources and publications.
Methodology
Step 1 - Identification of Relevant Samples Size from Population Database


Step 2 - Approaches for Defining Global Market Size (Value, Volume* & Price*)

Note*: In applicable scenarios
Step 3 - Data Sources
Primary Research
- Web Analytics
- Survey Reports
- Research Institute
- Latest Research Reports
- Opinion Leaders
Secondary Research
- Annual Reports
- White Paper
- Latest Press Release
- Industry Association
- Paid Database
- Investor Presentations

Step 4 - Data Triangulation
Involves using different sources of information in order to increase the validity of a study
These sources are likely to be stakeholders in a program - participants, other researchers, program staff, other community members, and so on.
Then we put all data in single framework & apply various statistical tools to find out the dynamic on the market.
During the analysis stage, feedback from the stakeholder groups would be compared to determine areas of agreement as well as areas of divergence