

Key Insights
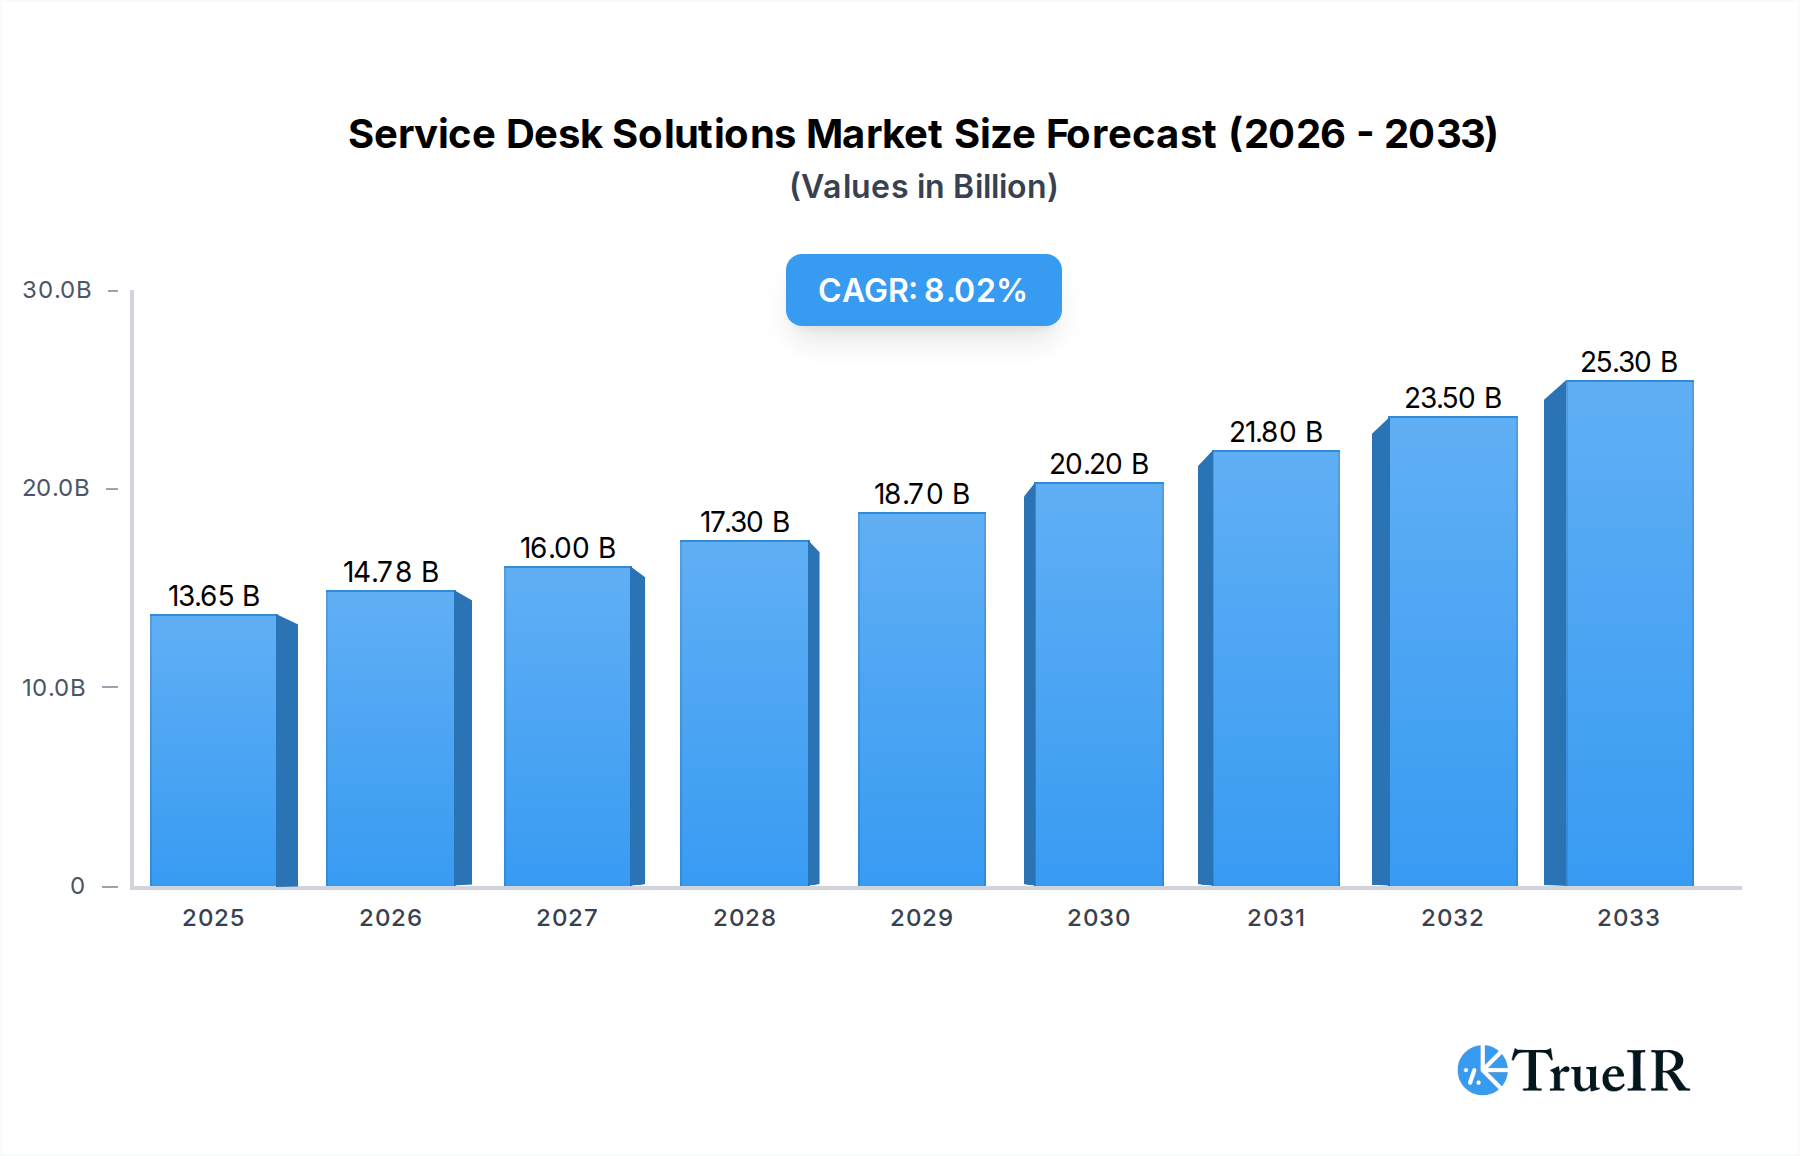
The global Service Desk Solutions market is poised for significant expansion, projecting a market size of $13.65 billion in 2025, with a robust CAGR of 8.3% anticipated from 2019 to 2033. This upward trajectory is primarily fueled by the escalating need for streamlined IT operations, enhanced customer support, and improved employee productivity across organizations of all sizes. The increasing adoption of cloud-based service desk solutions, driven by their scalability, cost-effectiveness, and accessibility, is a key growth enabler. Furthermore, the digital transformation initiatives undertaken by businesses worldwide are compelling them to invest in sophisticated service desk platforms to manage complex IT infrastructure, automate service delivery, and gain deeper insights into service performance. The growing demand for self-service portals and AI-powered chatbots to resolve common IT issues efficiently is also contributing to market growth, allowing IT teams to focus on more strategic tasks.

Service Desk Solutions Market Size (In Billion)
The market is segmented by application into Small and Medium-sized Businesses (SMBs) and Large Enterprises, both presenting substantial growth opportunities. While large enterprises have historically been the primary adopters, SMBs are increasingly recognizing the value of integrated service desk solutions to enhance their operational efficiency and competitive edge. On-premise solutions continue to hold relevance for organizations with stringent data security and compliance requirements, but the trend clearly favors cloud-based deployments due to their inherent flexibility and lower upfront investment. Geographically, North America and Europe are expected to lead the market, driven by advanced IT infrastructure and a high concentration of technology-driven businesses. However, the Asia Pacific region is anticipated to witness the fastest growth, propelled by rapid digitalization and the burgeoning IT service industry in countries like China and India. Emerging markets in the Middle East and Africa also present untapped potential as organizations in these regions increasingly embrace digital solutions.
Service Desk Solutions Company Market Share
Unlock unparalleled insights into the dynamic Service Desk Solutions market with this definitive report. Spanning a comprehensive study period from 2019 to 2033, with a base and estimated year of 2025, and a forecast period of 2025–2033, this analysis dissects market structure, identifies key trends, and forecasts future growth opportunities. Leveraging high-volume SEO keywords, this report is designed to attract industry professionals, IT decision-makers, and market analysts seeking in-depth intelligence.
Service Desk Solutions Market Structure & Competitive Landscape
The Service Desk Solutions market exhibits a dynamic competitive landscape characterized by a moderate concentration ratio, estimated to be around 0.45 in the base year 2025, indicating a mix of established players and emerging innovators. Innovation drivers are primarily fueled by the increasing demand for enhanced IT support efficiency, automation of routine tasks through AI and machine learning, and the growing adoption of cloud-based solutions. Regulatory impacts are minimal, with compliance requirements largely centered on data privacy and security, influencing platform design and service delivery. Product substitutes, such as internal IT support teams without dedicated software, represent a low but persistent threat. End-user segmentation reveals a strong preference for solutions tailored to specific business needs, with SMBs demanding cost-effectiveness and scalability, while Large Enterprises prioritize robust features, integration capabilities, and advanced analytics. Merger and acquisition (M&A) trends are moderately active, with an estimated 5 billion USD in M&A volumes during the historical period 2019-2024, as larger players acquire niche technology providers to expand their service portfolios and market reach. Key M&A activities are driven by the consolidation of cloud-native service desk platforms and the integration of AI-powered capabilities.
- Market Concentration: Moderate, with an estimated concentration ratio of 0.45 in 2025.
- Innovation Drivers: AI/ML for automation, cloud adoption, enhanced user experience, proactive issue resolution.
- Regulatory Impacts: Data privacy (GDPR, CCPA), cybersecurity standards.
- Product Substitutes: Internal IT teams, manual tracking systems.
- End-User Segmentation: Distinct needs for SMBs (cost, scalability) and Large Enterprises (features, integration, analytics).
- M&A Trends: Active, with an estimated 5 billion USD in volumes from 2019-2024, focusing on cloud and AI acquisitions.
Service Desk Solutions Market Trends & Opportunities
The global Service Desk Solutions market is poised for significant expansion, projected to grow at a compound annual growth rate (CAGR) of approximately 12.5% during the forecast period 2025–2033. This robust growth is underpinned by a fundamental shift towards digital transformation initiatives across all industries, compelling organizations to invest in efficient IT support and service management tools. The market size, estimated at 15 billion USD in the base year 2025, is expected to reach over 35 billion USD by 2033. Technological shifts are prominently marked by the widespread adoption of cloud-based Software-as-a-Service (SaaS) models, offering greater flexibility, scalability, and accessibility compared to traditional on-premise deployments. Artificial Intelligence (AI) and Machine Learning (ML) are revolutionizing service desk operations through intelligent automation, predictive analytics for issue resolution, and enhanced chatbots for self-service support, significantly improving first-call resolution rates and reducing IT workload. Consumer preferences are increasingly leaning towards intuitive user interfaces, seamless omnichannel support experiences, and personalized service delivery. The competitive dynamics are intensifying, with established leaders continuously innovating and new entrants disrupting the market with specialized solutions. Market penetration rates for sophisticated service desk solutions are expected to climb from around 55% in 2025 to over 75% by 2033, particularly in mid-market and enterprise segments. The growing complexity of IT infrastructure, including hybrid and multi-cloud environments, further necessitates advanced service desk capabilities for efficient management and support. Furthermore, the increasing emphasis on employee productivity and seamless end-user experience is driving demand for proactive and self-healing IT environments, which service desk solutions are instrumental in enabling. The integration of IT Service Management (ITSM) best practices, such as ITIL, within service desk platforms is also a key trend, ensuring standardized and efficient service delivery processes. The rise of remote work scenarios has amplified the need for accessible and responsive IT support, further accelerating the adoption of cloud-based service desk solutions. Opportunities abound for vendors who can offer integrated platforms that encompass not only incident and problem management but also change management, asset management, and knowledge management, providing a holistic approach to IT service delivery. The continuous evolution of cybersecurity threats also places a premium on service desk solutions that can effectively manage security incidents and integrate with security operations centers (SOCs).
Dominant Markets & Segments in Service Desk Solutions
The global Service Desk Solutions market demonstrates clear dominance across specific regions and segments, driven by distinct technological, economic, and policy factors. North America is projected to remain the largest regional market throughout the forecast period 2025–2033, primarily due to its high adoption rate of advanced technologies, robust IT infrastructure, and the presence of numerous large enterprises with significant IT spending. The United States, in particular, is a major contributor, fueled by a strong innovation ecosystem and stringent cybersecurity regulations that necessitate sophisticated service desk solutions.
Within segmentations, Cloud-based solutions are unequivocally the dominant type, capturing an estimated 70% of the market share in 2025 and projected to grow to over 85% by 2033. This dominance is fueled by the inherent advantages of cloud solutions: cost-effectiveness, rapid scalability, lower upfront investment, and easier maintenance compared to on-premise alternatives. The ability to access services from anywhere, coupled with automatic updates and enhanced data security measures offered by reputable cloud providers, makes them the preferred choice for businesses of all sizes.
In terms of application, Large Enterprises constitute a significant portion of the market, accounting for an estimated 60% of the revenue in 2025. This is attributed to their complex IT environments, higher volume of support tickets, and greater demand for advanced features such as comprehensive reporting, customization, integration with existing enterprise resource planning (ERP) and customer relationship management (CRM) systems, and robust workflow automation. The need for centralized IT management and compliance adherence in large organizations further propels their investment in sophisticated service desk platforms. However, the SMBs (Small and Medium-sized Businesses) segment is experiencing the fastest growth, with an estimated CAGR of 13.8% during the forecast period. This surge is driven by the increasing availability of affordable, user-friendly, and feature-rich cloud-based service desk solutions tailored to their specific needs, enabling them to compete more effectively by improving their internal IT efficiency and customer support.
- Leading Region: North America, driven by technological adoption and large enterprise presence.
- Dominant Type: Cloud-based solutions, projected to reach over 85% market share by 2033, due to scalability, cost-effectiveness, and accessibility.
- Dominant Application Segment: Large Enterprises, currently holding a 60% market share, due to complex IT needs and compliance requirements.
- Fastest Growing Application Segment: SMBs, experiencing a robust CAGR of 13.8%, driven by affordable and accessible cloud solutions.
- Key Growth Drivers (Cloud-based): Reduced IT overhead, rapid deployment, continuous updates, enhanced accessibility.
- Key Growth Drivers (Large Enterprises): Complex IT infrastructure, compliance needs, integration requirements, centralized management.
- Key Growth Drivers (SMBs): Cost-effectiveness, ease of use, scalability, competitive edge through improved IT support.
Service Desk Solutions Product Analysis
Service Desk Solutions are rapidly evolving, with a strong emphasis on AI-powered automation, intelligent knowledge management, and omnichannel user experience. Innovations are focused on proactive issue detection and resolution, predictive analytics to anticipate user needs, and self-service portals that empower end-users. Competitive advantages are derived from seamless integration capabilities with third-party applications, robust reporting and analytics dashboards, and highly customizable workflows that adapt to diverse business processes. The market fit is increasingly defined by the ability of these solutions to enhance IT efficiency, improve employee productivity, and deliver superior customer satisfaction in an increasingly complex digital landscape.
Key Drivers, Barriers & Challenges in Service Desk Solutions
The Service Desk Solutions market is propelled by several key drivers including the escalating need for digital transformation and improved IT operational efficiency, the continuous advancement of AI and automation technologies, and the growing demand for enhanced employee productivity and superior customer experiences. Economic factors such as the increasing IT budgets in enterprises and the cost-effectiveness of cloud-based solutions for SMBs also play a crucial role. Policy-driven factors, such as data privacy regulations, are indirectly driving adoption by necessitating robust IT governance and support systems.
Conversely, the market faces several challenges and restraints. Supply chain issues are largely non-existent for software solutions, but can impact hardware integration where applicable. Regulatory hurdles primarily revolve around data security and privacy compliance, requiring continuous updates and adherence to evolving standards. Competitive pressures are intense, with a crowded market demanding continuous innovation and differentiation. A significant restraint is the initial cost of implementation and integration for complex enterprise-grade solutions, and the resistance to change from organizations with deeply entrenched legacy systems. The ongoing need for skilled IT professionals to manage and leverage these advanced solutions also poses a challenge.
Growth Drivers in the Service Desk Solutions Market
The Service Desk Solutions market is experiencing significant growth driven by the relentless pursuit of digital transformation across industries, compelling businesses to optimize their IT support functions for enhanced efficiency and agility. The rapid advancements in Artificial Intelligence (AI) and Machine Learning (ML) are enabling intelligent automation of routine tasks, predictive analytics for proactive issue resolution, and improved self-service capabilities. Economic factors, such as increased IT spending by enterprises and the cost-effectiveness of cloud-based solutions for SMBs, are also contributing significantly. Furthermore, regulatory compliance requirements, particularly around data privacy and cybersecurity, are indirectly fueling the demand for robust and secure service desk platforms.
Challenges Impacting Service Desk Solutions Growth
Despite robust growth, the Service Desk Solutions market encounters several challenges. The primary restraint is the complexity and cost associated with implementing and integrating advanced service desk platforms within existing legacy IT infrastructures, especially for large enterprises. Resistance to change and the need for comprehensive employee training to effectively utilize new systems can also slow adoption rates. Competitive pressures are intense, with numerous vendors vying for market share, often leading to price wars and a need for continuous innovation to maintain differentiation. Regulatory complexities, particularly concerning data sovereignty and evolving privacy laws in different regions, require constant vigilance and adaptation from solution providers. Quantifiable impacts include longer sales cycles for enterprise solutions and the potential for customer churn if integration or user adoption challenges are not adequately addressed.
Key Players Shaping the Service Desk Solutions Market
- Samanage
- Freshservice
- ManageEngine ServiceDesk
- JIRA Service Desk
- Zendesk
- Track-It!
- BMC Remedy 9
- Cherwell IT Service Management
- Agiloft
- Re:Desk
- ServiceNow
- GoToAssist
- Spiceworks
- EasyVista
- Wolken
Significant Service Desk Solutions Industry Milestones
- 2019: Increased adoption of AI-powered chatbots for enhanced self-service resolution.
- 2020: Surge in demand for remote support capabilities due to the global pandemic.
- 2021: Greater emphasis on integrating ITSM with DevOps and other IT methodologies.
- 2022: Advancements in predictive analytics for proactive incident management.
- 2023: Growing integration of service desk solutions with cybersecurity platforms.
- 2024: Rise of low-code/no-code customization options for service desk workflows.
Future Outlook for Service Desk Solutions Market
The future outlook for the Service Desk Solutions market is exceptionally bright, driven by the accelerating digital transformation and the continuous integration of advanced technologies like AI, machine learning, and hyperautomation. Strategic opportunities lie in developing solutions that offer end-to-end service management, seamlessly integrating IT support with other business functions. The market potential is immense as organizations increasingly recognize the critical role of efficient IT service delivery in driving employee productivity, customer satisfaction, and overall business resilience. Expect further consolidation and innovation as vendors strive to provide more intelligent, automated, and user-centric service desk experiences.
Service Desk Solutions Segmentation
-
1. Application
- 1.1. SMBs
- 1.2. Large Enterprises
-
2. Types
- 2.1. Cloud based
- 2.2. On Premise
Service Desk Solutions Segmentation By Geography
-
1. North America
- 1.1. United States
- 1.2. Canada
- 1.3. Mexico
-
2. South America
- 2.1. Brazil
- 2.2. Argentina
- 2.3. Rest of South America
-
3. Europe
- 3.1. United Kingdom
- 3.2. Germany
- 3.3. France
- 3.4. Italy
- 3.5. Spain
- 3.6. Russia
- 3.7. Benelux
- 3.8. Nordics
- 3.9. Rest of Europe
-
4. Middle East & Africa
- 4.1. Turkey
- 4.2. Israel
- 4.3. GCC
- 4.4. North Africa
- 4.5. South Africa
- 4.6. Rest of Middle East & Africa
-
5. Asia Pacific
- 5.1. China
- 5.2. India
- 5.3. Japan
- 5.4. South Korea
- 5.5. ASEAN
- 5.6. Oceania
- 5.7. Rest of Asia Pacific

Service Desk Solutions Regional Market Share
Geographic Coverage of Service Desk Solutions
Service Desk Solutions REPORT HIGHLIGHTS
| Aspects | Details |
|---|---|
| Study Period | 2020-2034 |
| Base Year | 2025 |
| Estimated Year | 2026 |
| Forecast Period | 2026-2034 |
| Historical Period | 2020-2025 |
| Growth Rate | CAGR of 8.3% from 2020-2034 |
| Segmentation |
|
Table of Contents
- 1. Introduction
- 1.1. Research Scope
- 1.2. Market Segmentation
- 1.3. Research Methodology
- 1.4. Definitions and Assumptions
- 2. Executive Summary
- 2.1. Introduction
- 3. Market Dynamics
- 3.1. Introduction
- 3.2. Market Drivers
- 3.3. Market Restrains
- 3.4. Market Trends
- 4. Market Factor Analysis
- 4.1. Porters Five Forces
- 4.2. Supply/Value Chain
- 4.3. PESTEL analysis
- 4.4. Market Entropy
- 4.5. Patent/Trademark Analysis
- 5. Global Service Desk Solutions Analysis, Insights and Forecast, 2020-2032
- 5.1. Market Analysis, Insights and Forecast - by Application
- 5.1.1. SMBs
- 5.1.2. Large Enterprises
- 5.2. Market Analysis, Insights and Forecast - by Types
- 5.2.1. Cloud based
- 5.2.2. On Premise
- 5.3. Market Analysis, Insights and Forecast - by Region
- 5.3.1. North America
- 5.3.2. South America
- 5.3.3. Europe
- 5.3.4. Middle East & Africa
- 5.3.5. Asia Pacific
- 5.1. Market Analysis, Insights and Forecast - by Application
- 6. North America Service Desk Solutions Analysis, Insights and Forecast, 2020-2032
- 6.1. Market Analysis, Insights and Forecast - by Application
- 6.1.1. SMBs
- 6.1.2. Large Enterprises
- 6.2. Market Analysis, Insights and Forecast - by Types
- 6.2.1. Cloud based
- 6.2.2. On Premise
- 6.1. Market Analysis, Insights and Forecast - by Application
- 7. South America Service Desk Solutions Analysis, Insights and Forecast, 2020-2032
- 7.1. Market Analysis, Insights and Forecast - by Application
- 7.1.1. SMBs
- 7.1.2. Large Enterprises
- 7.2. Market Analysis, Insights and Forecast - by Types
- 7.2.1. Cloud based
- 7.2.2. On Premise
- 7.1. Market Analysis, Insights and Forecast - by Application
- 8. Europe Service Desk Solutions Analysis, Insights and Forecast, 2020-2032
- 8.1. Market Analysis, Insights and Forecast - by Application
- 8.1.1. SMBs
- 8.1.2. Large Enterprises
- 8.2. Market Analysis, Insights and Forecast - by Types
- 8.2.1. Cloud based
- 8.2.2. On Premise
- 8.1. Market Analysis, Insights and Forecast - by Application
- 9. Middle East & Africa Service Desk Solutions Analysis, Insights and Forecast, 2020-2032
- 9.1. Market Analysis, Insights and Forecast - by Application
- 9.1.1. SMBs
- 9.1.2. Large Enterprises
- 9.2. Market Analysis, Insights and Forecast - by Types
- 9.2.1. Cloud based
- 9.2.2. On Premise
- 9.1. Market Analysis, Insights and Forecast - by Application
- 10. Asia Pacific Service Desk Solutions Analysis, Insights and Forecast, 2020-2032
- 10.1. Market Analysis, Insights and Forecast - by Application
- 10.1.1. SMBs
- 10.1.2. Large Enterprises
- 10.2. Market Analysis, Insights and Forecast - by Types
- 10.2.1. Cloud based
- 10.2.2. On Premise
- 10.1. Market Analysis, Insights and Forecast - by Application
- 11. Competitive Analysis
- 11.1. Global Market Share Analysis 2025
- 11.2. Company Profiles
- 11.2.1 Samanage
- 11.2.1.1. Overview
- 11.2.1.2. Products
- 11.2.1.3. SWOT Analysis
- 11.2.1.4. Recent Developments
- 11.2.1.5. Financials (Based on Availability)
- 11.2.2 Freshservice
- 11.2.2.1. Overview
- 11.2.2.2. Products
- 11.2.2.3. SWOT Analysis
- 11.2.2.4. Recent Developments
- 11.2.2.5. Financials (Based on Availability)
- 11.2.3 ManageEngine ServiceDesk
- 11.2.3.1. Overview
- 11.2.3.2. Products
- 11.2.3.3. SWOT Analysis
- 11.2.3.4. Recent Developments
- 11.2.3.5. Financials (Based on Availability)
- 11.2.4 JIRA Service Desk
- 11.2.4.1. Overview
- 11.2.4.2. Products
- 11.2.4.3. SWOT Analysis
- 11.2.4.4. Recent Developments
- 11.2.4.5. Financials (Based on Availability)
- 11.2.5 Zendesk
- 11.2.5.1. Overview
- 11.2.5.2. Products
- 11.2.5.3. SWOT Analysis
- 11.2.5.4. Recent Developments
- 11.2.5.5. Financials (Based on Availability)
- 11.2.6 Track-It!
- 11.2.6.1. Overview
- 11.2.6.2. Products
- 11.2.6.3. SWOT Analysis
- 11.2.6.4. Recent Developments
- 11.2.6.5. Financials (Based on Availability)
- 11.2.7 BMC Remedy 9
- 11.2.7.1. Overview
- 11.2.7.2. Products
- 11.2.7.3. SWOT Analysis
- 11.2.7.4. Recent Developments
- 11.2.7.5. Financials (Based on Availability)
- 11.2.8 Cherwell IT Service Management
- 11.2.8.1. Overview
- 11.2.8.2. Products
- 11.2.8.3. SWOT Analysis
- 11.2.8.4. Recent Developments
- 11.2.8.5. Financials (Based on Availability)
- 11.2.9 Agiloft
- 11.2.9.1. Overview
- 11.2.9.2. Products
- 11.2.9.3. SWOT Analysis
- 11.2.9.4. Recent Developments
- 11.2.9.5. Financials (Based on Availability)
- 11.2.10 Re
- 11.2.10.1. Overview
- 11.2.10.2. Products
- 11.2.10.3. SWOT Analysis
- 11.2.10.4. Recent Developments
- 11.2.10.5. Financials (Based on Availability)
- 11.2.1 Samanage
List of Figures
- Figure 1: Global Service Desk Solutions Revenue Breakdown (undefined, %) by Region 2025 & 2033
- Figure 2: North America Service Desk Solutions Revenue (undefined), by Application 2025 & 2033
- Figure 3: North America Service Desk Solutions Revenue Share (%), by Application 2025 & 2033
- Figure 4: North America Service Desk Solutions Revenue (undefined), by Types 2025 & 2033
- Figure 5: North America Service Desk Solutions Revenue Share (%), by Types 2025 & 2033
- Figure 6: North America Service Desk Solutions Revenue (undefined), by Country 2025 & 2033
- Figure 7: North America Service Desk Solutions Revenue Share (%), by Country 2025 & 2033
- Figure 8: South America Service Desk Solutions Revenue (undefined), by Application 2025 & 2033
- Figure 9: South America Service Desk Solutions Revenue Share (%), by Application 2025 & 2033
- Figure 10: South America Service Desk Solutions Revenue (undefined), by Types 2025 & 2033
- Figure 11: South America Service Desk Solutions Revenue Share (%), by Types 2025 & 2033
- Figure 12: South America Service Desk Solutions Revenue (undefined), by Country 2025 & 2033
- Figure 13: South America Service Desk Solutions Revenue Share (%), by Country 2025 & 2033
- Figure 14: Europe Service Desk Solutions Revenue (undefined), by Application 2025 & 2033
- Figure 15: Europe Service Desk Solutions Revenue Share (%), by Application 2025 & 2033
- Figure 16: Europe Service Desk Solutions Revenue (undefined), by Types 2025 & 2033
- Figure 17: Europe Service Desk Solutions Revenue Share (%), by Types 2025 & 2033
- Figure 18: Europe Service Desk Solutions Revenue (undefined), by Country 2025 & 2033
- Figure 19: Europe Service Desk Solutions Revenue Share (%), by Country 2025 & 2033
- Figure 20: Middle East & Africa Service Desk Solutions Revenue (undefined), by Application 2025 & 2033
- Figure 21: Middle East & Africa Service Desk Solutions Revenue Share (%), by Application 2025 & 2033
- Figure 22: Middle East & Africa Service Desk Solutions Revenue (undefined), by Types 2025 & 2033
- Figure 23: Middle East & Africa Service Desk Solutions Revenue Share (%), by Types 2025 & 2033
- Figure 24: Middle East & Africa Service Desk Solutions Revenue (undefined), by Country 2025 & 2033
- Figure 25: Middle East & Africa Service Desk Solutions Revenue Share (%), by Country 2025 & 2033
- Figure 26: Asia Pacific Service Desk Solutions Revenue (undefined), by Application 2025 & 2033
- Figure 27: Asia Pacific Service Desk Solutions Revenue Share (%), by Application 2025 & 2033
- Figure 28: Asia Pacific Service Desk Solutions Revenue (undefined), by Types 2025 & 2033
- Figure 29: Asia Pacific Service Desk Solutions Revenue Share (%), by Types 2025 & 2033
- Figure 30: Asia Pacific Service Desk Solutions Revenue (undefined), by Country 2025 & 2033
- Figure 31: Asia Pacific Service Desk Solutions Revenue Share (%), by Country 2025 & 2033
List of Tables
- Table 1: Global Service Desk Solutions Revenue undefined Forecast, by Application 2020 & 2033
- Table 2: Global Service Desk Solutions Revenue undefined Forecast, by Types 2020 & 2033
- Table 3: Global Service Desk Solutions Revenue undefined Forecast, by Region 2020 & 2033
- Table 4: Global Service Desk Solutions Revenue undefined Forecast, by Application 2020 & 2033
- Table 5: Global Service Desk Solutions Revenue undefined Forecast, by Types 2020 & 2033
- Table 6: Global Service Desk Solutions Revenue undefined Forecast, by Country 2020 & 2033
- Table 7: United States Service Desk Solutions Revenue (undefined) Forecast, by Application 2020 & 2033
- Table 8: Canada Service Desk Solutions Revenue (undefined) Forecast, by Application 2020 & 2033
- Table 9: Mexico Service Desk Solutions Revenue (undefined) Forecast, by Application 2020 & 2033
- Table 10: Global Service Desk Solutions Revenue undefined Forecast, by Application 2020 & 2033
- Table 11: Global Service Desk Solutions Revenue undefined Forecast, by Types 2020 & 2033
- Table 12: Global Service Desk Solutions Revenue undefined Forecast, by Country 2020 & 2033
- Table 13: Brazil Service Desk Solutions Revenue (undefined) Forecast, by Application 2020 & 2033
- Table 14: Argentina Service Desk Solutions Revenue (undefined) Forecast, by Application 2020 & 2033
- Table 15: Rest of South America Service Desk Solutions Revenue (undefined) Forecast, by Application 2020 & 2033
- Table 16: Global Service Desk Solutions Revenue undefined Forecast, by Application 2020 & 2033
- Table 17: Global Service Desk Solutions Revenue undefined Forecast, by Types 2020 & 2033
- Table 18: Global Service Desk Solutions Revenue undefined Forecast, by Country 2020 & 2033
- Table 19: United Kingdom Service Desk Solutions Revenue (undefined) Forecast, by Application 2020 & 2033
- Table 20: Germany Service Desk Solutions Revenue (undefined) Forecast, by Application 2020 & 2033
- Table 21: France Service Desk Solutions Revenue (undefined) Forecast, by Application 2020 & 2033
- Table 22: Italy Service Desk Solutions Revenue (undefined) Forecast, by Application 2020 & 2033
- Table 23: Spain Service Desk Solutions Revenue (undefined) Forecast, by Application 2020 & 2033
- Table 24: Russia Service Desk Solutions Revenue (undefined) Forecast, by Application 2020 & 2033
- Table 25: Benelux Service Desk Solutions Revenue (undefined) Forecast, by Application 2020 & 2033
- Table 26: Nordics Service Desk Solutions Revenue (undefined) Forecast, by Application 2020 & 2033
- Table 27: Rest of Europe Service Desk Solutions Revenue (undefined) Forecast, by Application 2020 & 2033
- Table 28: Global Service Desk Solutions Revenue undefined Forecast, by Application 2020 & 2033
- Table 29: Global Service Desk Solutions Revenue undefined Forecast, by Types 2020 & 2033
- Table 30: Global Service Desk Solutions Revenue undefined Forecast, by Country 2020 & 2033
- Table 31: Turkey Service Desk Solutions Revenue (undefined) Forecast, by Application 2020 & 2033
- Table 32: Israel Service Desk Solutions Revenue (undefined) Forecast, by Application 2020 & 2033
- Table 33: GCC Service Desk Solutions Revenue (undefined) Forecast, by Application 2020 & 2033
- Table 34: North Africa Service Desk Solutions Revenue (undefined) Forecast, by Application 2020 & 2033
- Table 35: South Africa Service Desk Solutions Revenue (undefined) Forecast, by Application 2020 & 2033
- Table 36: Rest of Middle East & Africa Service Desk Solutions Revenue (undefined) Forecast, by Application 2020 & 2033
- Table 37: Global Service Desk Solutions Revenue undefined Forecast, by Application 2020 & 2033
- Table 38: Global Service Desk Solutions Revenue undefined Forecast, by Types 2020 & 2033
- Table 39: Global Service Desk Solutions Revenue undefined Forecast, by Country 2020 & 2033
- Table 40: China Service Desk Solutions Revenue (undefined) Forecast, by Application 2020 & 2033
- Table 41: India Service Desk Solutions Revenue (undefined) Forecast, by Application 2020 & 2033
- Table 42: Japan Service Desk Solutions Revenue (undefined) Forecast, by Application 2020 & 2033
- Table 43: South Korea Service Desk Solutions Revenue (undefined) Forecast, by Application 2020 & 2033
- Table 44: ASEAN Service Desk Solutions Revenue (undefined) Forecast, by Application 2020 & 2033
- Table 45: Oceania Service Desk Solutions Revenue (undefined) Forecast, by Application 2020 & 2033
- Table 46: Rest of Asia Pacific Service Desk Solutions Revenue (undefined) Forecast, by Application 2020 & 2033
Frequently Asked Questions
1. What is the projected Compound Annual Growth Rate (CAGR) of the Service Desk Solutions?
The projected CAGR is approximately 8.3%.
2. Which companies are prominent players in the Service Desk Solutions?
Key companies in the market include Samanage, Freshservice, ManageEngine ServiceDesk, JIRA Service Desk, Zendesk, Track-It!, BMC Remedy 9, Cherwell IT Service Management, Agiloft, Re:Desk, ServiceNow, GoToAssist, Spiceworks, EasyVista, Wolken.
3. What are the main segments of the Service Desk Solutions?
The market segments include Application, Types.
4. Can you provide details about the market size?
The market size is estimated to be USD XXX N/A as of 2022.
5. What are some drivers contributing to market growth?
N/A
6. What are the notable trends driving market growth?
N/A
7. Are there any restraints impacting market growth?
N/A
8. Can you provide examples of recent developments in the market?
N/A
9. What pricing options are available for accessing the report?
Pricing options include single-user, multi-user, and enterprise licenses priced at USD 3950.00, USD 5925.00, and USD 7900.00 respectively.
10. Is the market size provided in terms of value or volume?
The market size is provided in terms of value, measured in N/A.
11. Are there any specific market keywords associated with the report?
Yes, the market keyword associated with the report is "Service Desk Solutions," which aids in identifying and referencing the specific market segment covered.
12. How do I determine which pricing option suits my needs best?
The pricing options vary based on user requirements and access needs. Individual users may opt for single-user licenses, while businesses requiring broader access may choose multi-user or enterprise licenses for cost-effective access to the report.
13. Are there any additional resources or data provided in the Service Desk Solutions report?
While the report offers comprehensive insights, it's advisable to review the specific contents or supplementary materials provided to ascertain if additional resources or data are available.
14. How can I stay updated on further developments or reports in the Service Desk Solutions?
To stay informed about further developments, trends, and reports in the Service Desk Solutions, consider subscribing to industry newsletters, following relevant companies and organizations, or regularly checking reputable industry news sources and publications.
Methodology
Step 1 - Identification of Relevant Samples Size from Population Database


Step 2 - Approaches for Defining Global Market Size (Value, Volume* & Price*)

Note*: In applicable scenarios
Step 3 - Data Sources
Primary Research
- Web Analytics
- Survey Reports
- Research Institute
- Latest Research Reports
- Opinion Leaders
Secondary Research
- Annual Reports
- White Paper
- Latest Press Release
- Industry Association
- Paid Database
- Investor Presentations

Step 4 - Data Triangulation
Involves using different sources of information in order to increase the validity of a study
These sources are likely to be stakeholders in a program - participants, other researchers, program staff, other community members, and so on.
Then we put all data in single framework & apply various statistical tools to find out the dynamic on the market.
During the analysis stage, feedback from the stakeholder groups would be compared to determine areas of agreement as well as areas of divergence