

Key Insights
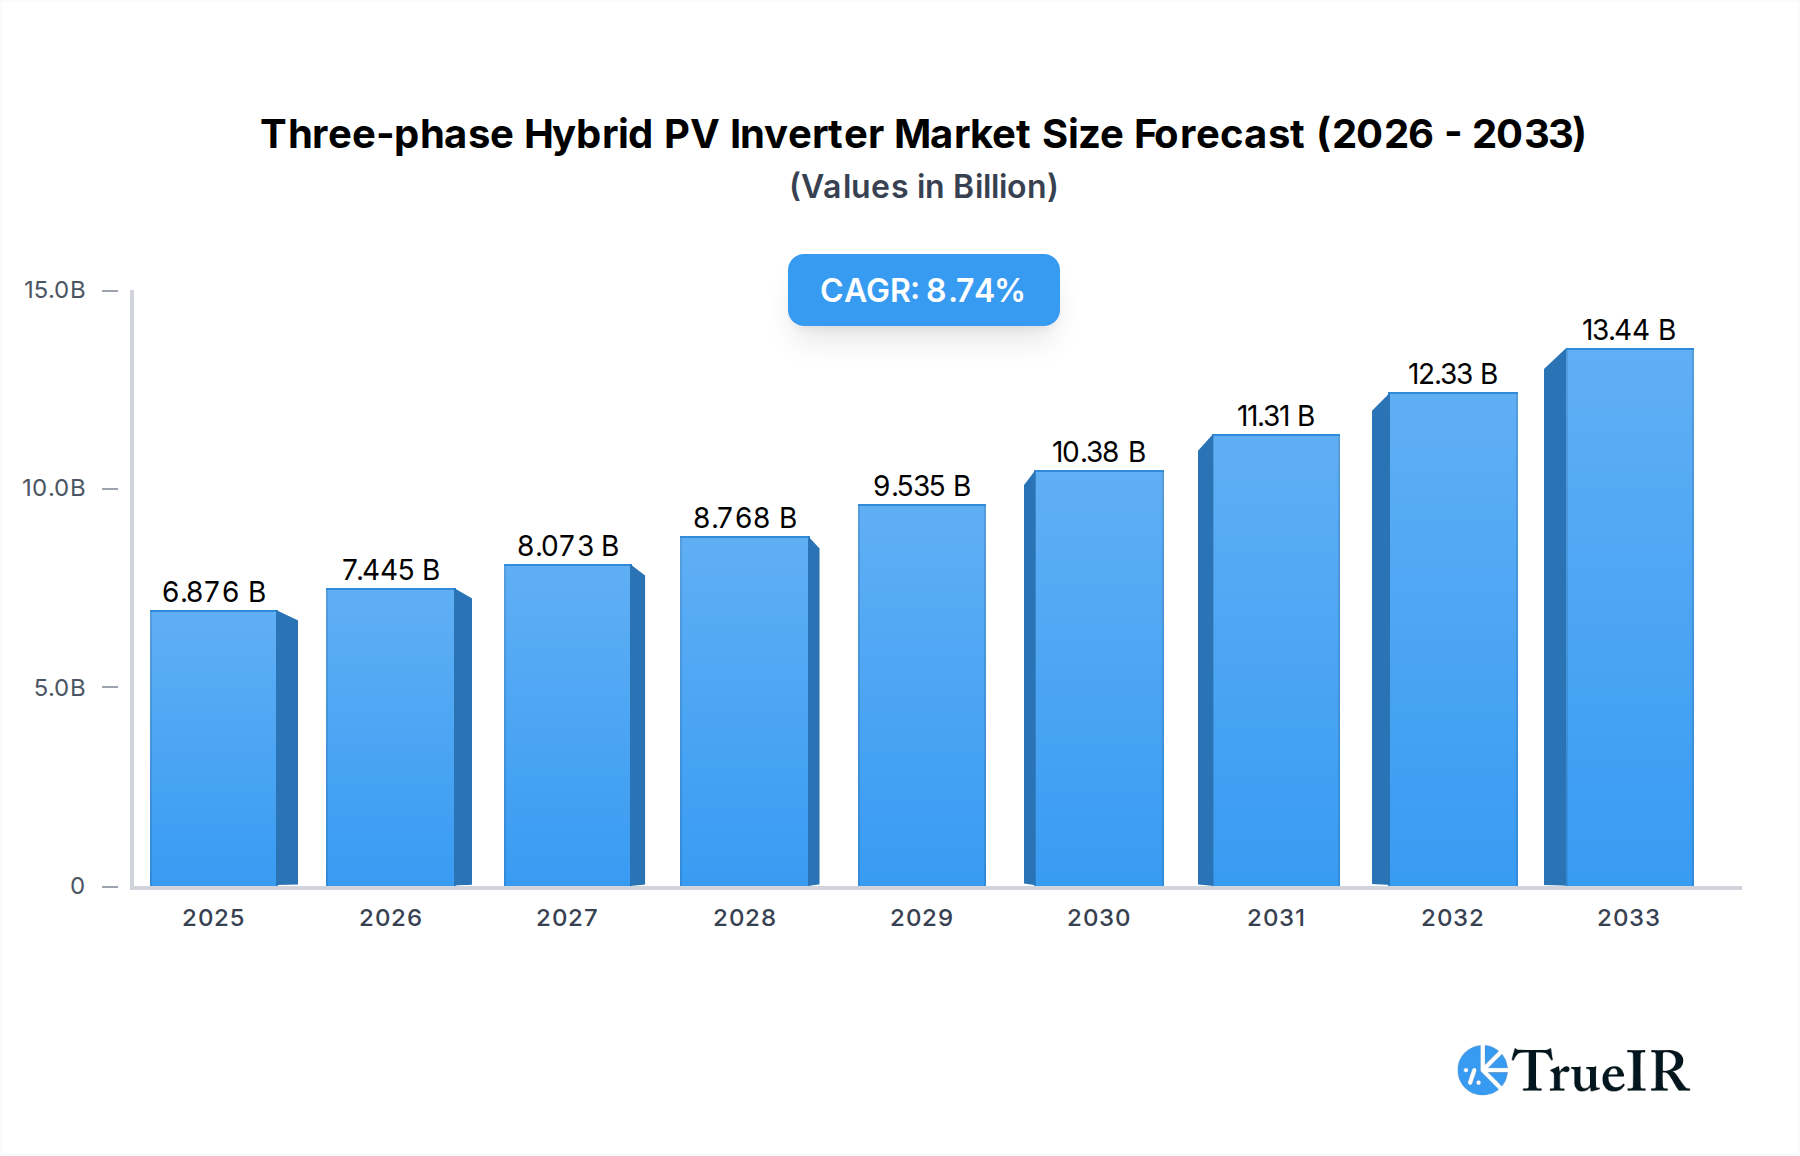
The global market for three-phase hybrid PV inverters is experiencing robust expansion, currently valued at an estimated $6876 million in 2025, with a projected Compound Annual Growth Rate (CAGR) of 8.3% through 2033. This significant growth is primarily driven by the escalating demand for renewable energy solutions, particularly in commercial and residential sectors seeking to integrate solar power with energy storage capabilities. The increasing adoption of smart grid technologies and favorable government policies promoting solar energy deployment are further fueling market penetration. Furthermore, the rising electricity prices and growing environmental consciousness among consumers and businesses alike are acting as potent catalysts for the adoption of hybrid inverters, which offer enhanced energy independence and cost savings through efficient solar energy utilization and battery management. The technological advancements in inverter efficiency and grid integration capabilities are also contributing to market growth.

Three-phase Hybrid PV Inverter Market Size (In Billion)
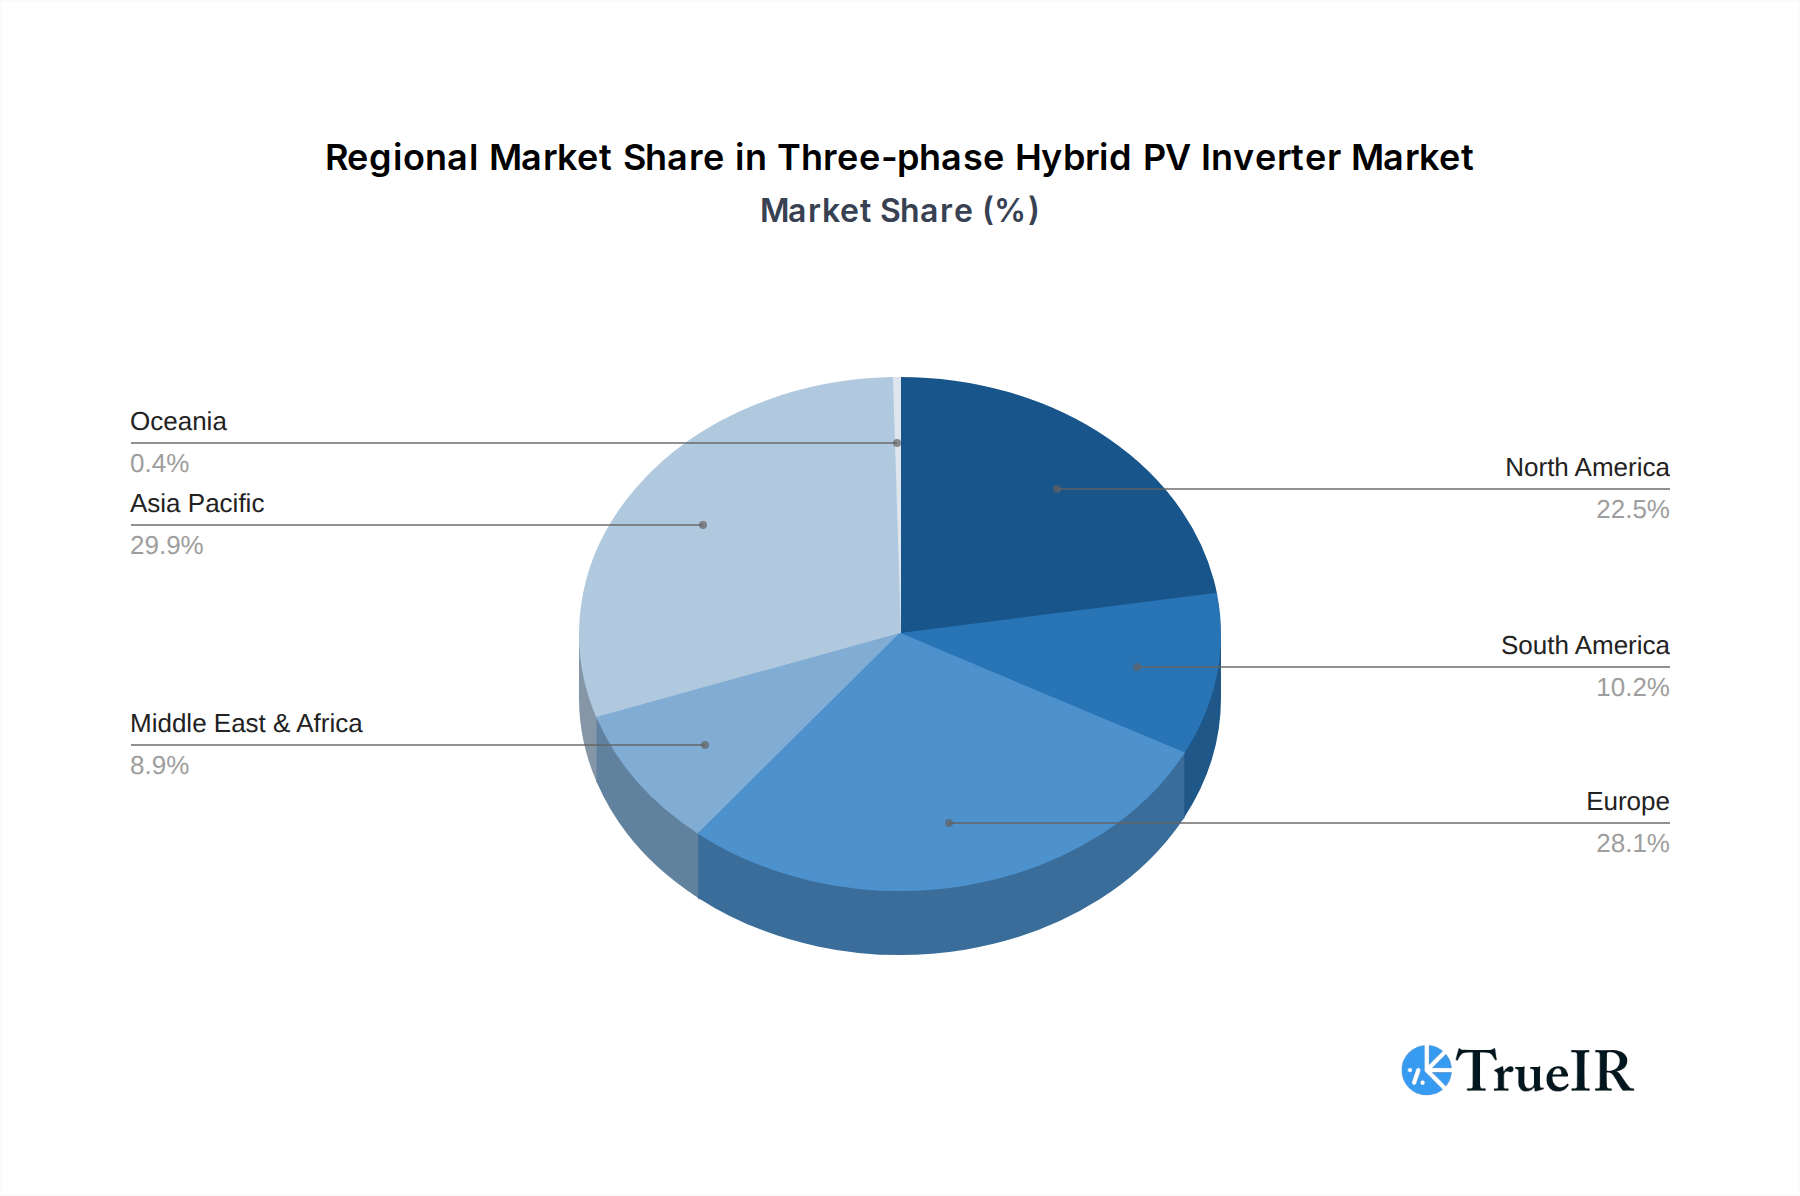
The market segmentation reveals a strong presence in both residential and commercial applications, with a notable trend towards inverters with capacities between 5 KW and 10 KW, catering to a broad spectrum of energy needs. While the market is propelled by these drivers, certain restraints, such as the high initial investment cost of hybrid inverter systems and the complexity of installation and maintenance in some regions, need to be addressed. However, the declining costs of solar panels and battery storage, coupled with ongoing innovations, are expected to mitigate these challenges. Key industry players, including Fronius, SolarEdge, SMA Solar Technology, and HUAWEI, are actively investing in research and development to introduce more advanced and cost-effective solutions, further stimulating market competition and innovation. The Asia Pacific region, led by China and India, is anticipated to dominate the market share due to its massive solar deployment initiatives and supportive regulatory frameworks.
Three-phase Hybrid PV Inverter Company Market Share
Three-phase Hybrid PV Inverter Market Structure & Competitive Landscape
The global three-phase hybrid PV inverter market is characterized by a dynamic and evolving competitive landscape, with a moderate to high level of market concentration. Leading players such as HUAWEI, Sungrow, and SMA Solar Technology command significant market share due to their extensive product portfolios, robust R&D investments, and established global distribution networks. Innovation is a key driver, with companies consistently investing in technologies that enhance energy conversion efficiency, battery integration capabilities, and smart grid connectivity. Regulatory impacts, including government incentives for renewable energy adoption and evolving grid interconnection standards, play a crucial role in shaping market dynamics. Product substitutes, while present in the form of standalone inverters and batteries, are increasingly being consolidated by the hybrid inverter segment's superior system integration and cost-effectiveness. End-user segmentation spans residential, commercial, and industrial applications, with distinct demands and adoption rates. Mergers and acquisitions (M&A) are a notable trend, with larger companies acquiring smaller innovators to expand their technological capabilities and market reach. For instance, recent years have seen M&A volumes in the broader inverter market exceeding XX billion USD, indicating a consolidation drive. Concentration ratios, particularly in developed markets, suggest that the top 5 companies hold over 60% of the market.
Three-phase Hybrid PV Inverter Market Trends & Opportunities
The global three-phase hybrid PV inverter market is projected to experience robust growth, driven by a confluence of accelerating renewable energy adoption, supportive government policies, and advancements in energy storage technologies. The market size, valued at an estimated XX billion USD in the base year of 2025, is anticipated to expand at a compound annual growth rate (CAGR) of approximately 15% during the forecast period of 2025–2033. This impressive growth trajectory is fueled by the increasing demand for reliable and efficient solar power solutions across residential, commercial, and industrial sectors. Technological shifts are at the forefront of market evolution, with manufacturers continuously innovating to offer higher conversion efficiencies, enhanced battery management systems, and seamless integration with smart grids. The development of advanced functionalities like peak shaving, demand response, and energy arbitrage is making hybrid inverters increasingly attractive to consumers seeking to maximize their energy independence and reduce electricity bills. Consumer preferences are tilting towards integrated solutions that offer both power generation and storage, driven by a growing awareness of energy security, sustainability, and the desire to offset rising electricity costs. The penetration rate of hybrid inverters, particularly in developed markets, is expected to surge from an estimated XX% in 2025 to over XX% by 2033. Competitive dynamics are intensifying, with a growing number of players entering the market, leading to price competition and a greater emphasis on product differentiation through innovative features and superior performance. Key companies like HUAWEI, Sungrow, Fronius, and SolarEdge are heavily investing in R&D to maintain their competitive edge. The market is ripe with opportunities for companies that can offer cost-effective, high-performance, and user-friendly hybrid PV inverter solutions tailored to specific regional and application needs. Emerging markets in Asia, Africa, and Latin America present significant untapped potential due to their growing energy demands and increasing government support for renewable energy.
Dominant Markets & Segments in Three-phase Hybrid PV Inverter
The three-phase hybrid PV inverter market exhibits distinct regional and segment dominance, driven by a variety of factors including policy frameworks, economic development, and consumer demand. The Residential System segment is a significant growth engine, accounting for an estimated XX% of the market share in 2025. This dominance is propelled by increasing homeowner interest in energy independence, rising electricity prices, and generous government incentives for solar installations. Within the residential segment, the 5 KW-10 KW type of hybrid inverters represents a substantial portion, catering to the average energy needs of households. The Commercial System segment, while currently smaller in market share at approximately XX%, is poised for substantial expansion, driven by businesses seeking to reduce operating costs, meet sustainability targets, and leverage the tax benefits associated with renewable energy investments. Key growth drivers in the commercial sector include the demand for larger system sizes, often exceeding 10 KW, to offset high energy consumption.
Geographically, the Asia-Pacific region is emerging as the dominant market, with countries like China and India leading the charge in terms of installed capacity and market growth. This dominance is attributed to proactive government policies promoting solar energy, rapid industrialization, and a growing middle class with increasing disposable income for solar investments. Europe, particularly Germany, the Netherlands, and the UK, also holds a significant market share due to strong renewable energy mandates, favorable feed-in tariffs, and a well-established solar industry infrastructure. North America, driven by policies in the United States such as the Investment Tax Credit (ITC), is another key market with considerable growth potential.
- Residential System Dominance: Fueled by declining solar panel costs, increasing electricity prices, and a desire for energy independence. Homeowners are increasingly opting for integrated solar + storage solutions.
- Commercial System Expansion: Driven by corporate sustainability goals, the need to reduce operational expenditures, and the availability of attractive financing options.
- Type Segmentation (5 KW-10 KW): This range is highly popular for residential applications, balancing cost-effectiveness with sufficient power output for typical household needs.
- Type Segmentation (Over 10KW): Dominant in commercial and industrial applications requiring higher energy generation and storage capacities.
- Asia-Pacific Leadership: Characterized by massive government investment, supportive policies, and a rapidly growing demand for electricity, making it the largest and fastest-growing market.
The ongoing development of smart grid technologies and the increasing integration of electric vehicles (EVs) with home energy systems are further enhancing the value proposition of three-phase hybrid PV inverters, particularly in the residential and commercial segments.
Three-phase Hybrid PV Inverter Product Analysis
Three-phase hybrid PV inverters are at the forefront of solar energy innovation, offering advanced functionalities that integrate solar power generation, battery energy storage, and grid connectivity into a single, intelligent system. Product innovations focus on maximizing energy conversion efficiency, often exceeding 98%, and enhancing the seamless integration of various battery chemistries, including lithium-ion. Competitive advantages lie in their ability to provide reliable backup power during grid outages, optimize energy consumption through intelligent load management, and enable participation in grid services like demand response. These inverters are designed for both residential and commercial applications, with models catering to a range of power capacities from below 5 KW to over 10 KW, ensuring scalability for diverse energy needs. Their advanced firmware and communication protocols facilitate remote monitoring and control, offering users unprecedented insights into their energy usage and system performance.
Key Drivers, Barriers & Challenges in Three-phase Hybrid PV Inverter
The three-phase hybrid PV inverter market is propelled by several key drivers. Technologically, advancements in power electronics and battery management systems are enhancing efficiency and reliability, with conversion efficiencies often exceeding 98%. Economically, the declining cost of solar components, coupled with rising electricity prices, makes solar self-consumption increasingly attractive. Policy-driven factors, such as government incentives for renewable energy and energy storage, are crucial in accelerating adoption rates. For example, tax credits in key markets have led to an estimated XX% increase in installations.
However, the market faces significant challenges and restraints. Regulatory hurdles, including complex permitting processes and evolving grid interconnection standards, can slow down deployment. Supply chain issues, exacerbated by global chip shortages and raw material price volatility, can impact production and lead times, potentially increasing costs by XX%. Competitive pressures from established inverter manufacturers and emerging players necessitate continuous innovation and cost optimization. High initial investment costs, although declining, remain a barrier for some consumers, with payback periods varying widely based on location and incentive structures.
Growth Drivers in the Three-phase Hybrid PV Inverter Market
The growth of the three-phase hybrid PV inverter market is fundamentally driven by a synergistic interplay of technological advancements, economic imperatives, and supportive government policies. Technologically, the continuous improvement in power conversion efficiency, often reaching over 98%, coupled with enhanced battery integration capabilities, makes these systems more attractive and cost-effective. Economically, the escalating costs of traditional electricity, coupled with the declining price of solar panels and battery storage, significantly improves the return on investment for hybrid PV systems. Government incentives, such as investment tax credits and feed-in tariffs in numerous countries, act as powerful catalysts, making renewable energy solutions more accessible and financially viable for a broader range of consumers and businesses.
Challenges Impacting Three-phase Hybrid PV Inverter Growth
Despite the positive growth outlook, the three-phase hybrid PV inverter market faces several challenges that could impact its expansion. Regulatory complexities, including varying grid interconnection standards and permitting requirements across different regions, can create significant deployment hurdles. Supply chain vulnerabilities, particularly the reliance on specific components like semiconductors, have led to production delays and increased costs, impacting delivery timelines and pricing. Competitive pressures from both established players and new market entrants necessitate aggressive pricing strategies and continuous product innovation to maintain market share. The high upfront cost of integrated hybrid systems, though decreasing, can still be a barrier for some potential customers, particularly in price-sensitive markets.
Key Players Shaping the Three-phase Hybrid PV Inverter Market
The three-phase hybrid PV inverter market is shaped by a diverse range of global and regional players. These include:
- Fronius
- SolarEdge
- SMA Solar Technology
- KOSTAL Solar Electric
- Imeon Energy
- Delios Srl
- HUAWEI
- Sungrow
- SolaX Power
- Redback Technologies
- GoodWe
- Ginlong Technologies
- Shenzhen Growatt New Energy
- Shenzhen Sofarsolar
- SankoPower
- Voltacon UK
- EnerTech UPS
- Xiamen Sweet Power
- NingBo Deye Inverter Technology
- Guangzhou Felicity Solar Technology
- RENAC Power
Significant Three-phase Hybrid PV Inverter Industry Milestones
- 2019: Launch of advanced hybrid inverter models with enhanced battery management systems by leading manufacturers.
- 2020: Increased regulatory support for energy storage integration in numerous countries, boosting hybrid inverter adoption.
- 2021: Significant investments in R&D for higher efficiency and smarter grid integration capabilities in hybrid inverters.
- 2022: Growing demand for integrated solar + storage solutions in residential and commercial sectors.
- 2023: Further consolidation and strategic partnerships within the inverter manufacturing landscape.
- 2024: Introduction of next-generation hybrid inverters with improved cybersecurity features and AI-driven energy optimization.
- 2025: Anticipated surge in adoption due to continued cost reductions and increasing energy independence awareness.
- 2026-2033: Expected sustained growth driven by smart grid expansion and the electrification of transportation.
Future Outlook for Three-phase Hybrid PV Inverter Market
The future outlook for the three-phase hybrid PV inverter market is exceptionally promising, driven by an escalating global commitment to renewable energy and increasing demand for energy resilience. Growth catalysts include the ongoing technological evolution towards higher efficiencies, enhanced grid interactivity, and seamless integration with emerging smart home and smart city ecosystems. Strategic opportunities lie in expanding into emerging markets with significant untapped potential and in developing solutions tailored for specific commercial and industrial applications requiring sophisticated energy management. The market is set to witness continued innovation in battery management, cybersecurity, and user-friendly interfaces, further solidifying the hybrid inverter's position as the central intelligence unit of future energy systems. The projected market size is expected to reach over XX billion USD by 2033, reflecting sustained expansion and a critical role in the global energy transition.
Three-phase Hybrid PV Inverter Segmentation
-
1. Application
- 1.1. Residential System
- 1.2. Commercial System
-
2. Types
- 2.1. Below 5 KW
- 2.2. 5 KW-10 KW
- 2.3. Over 10KW
Three-phase Hybrid PV Inverter Segmentation By Geography
-
1. North America
- 1.1. United States
- 1.2. Canada
- 1.3. Mexico
-
2. South America
- 2.1. Brazil
- 2.2. Argentina
- 2.3. Rest of South America
-
3. Europe
- 3.1. United Kingdom
- 3.2. Germany
- 3.3. France
- 3.4. Italy
- 3.5. Spain
- 3.6. Russia
- 3.7. Benelux
- 3.8. Nordics
- 3.9. Rest of Europe
-
4. Middle East & Africa
- 4.1. Turkey
- 4.2. Israel
- 4.3. GCC
- 4.4. North Africa
- 4.5. South Africa
- 4.6. Rest of Middle East & Africa
-
5. Asia Pacific
- 5.1. China
- 5.2. India
- 5.3. Japan
- 5.4. South Korea
- 5.5. ASEAN
- 5.6. Oceania
- 5.7. Rest of Asia Pacific
Three-phase Hybrid PV Inverter Regional Market Share
Geographic Coverage of Three-phase Hybrid PV Inverter
Three-phase Hybrid PV Inverter REPORT HIGHLIGHTS
| Aspects | Details |
|---|---|
| Study Period | 2020-2034 |
| Base Year | 2025 |
| Estimated Year | 2026 |
| Forecast Period | 2026-2034 |
| Historical Period | 2020-2025 |
| Growth Rate | CAGR of 8.3% from 2020-2034 |
| Segmentation |
|
Table of Contents
- 1. Introduction
- 1.1. Research Scope
- 1.2. Market Segmentation
- 1.3. Research Methodology
- 1.4. Definitions and Assumptions
- 2. Executive Summary
- 2.1. Introduction
- 3. Market Dynamics
- 3.1. Introduction
- 3.2. Market Drivers
- 3.3. Market Restrains
- 3.4. Market Trends
- 4. Market Factor Analysis
- 4.1. Porters Five Forces
- 4.2. Supply/Value Chain
- 4.3. PESTEL analysis
- 4.4. Market Entropy
- 4.5. Patent/Trademark Analysis
- 5. Global Three-phase Hybrid PV Inverter Analysis, Insights and Forecast, 2020-2032
- 5.1. Market Analysis, Insights and Forecast - by Application
- 5.1.1. Residential System
- 5.1.2. Commercial System
- 5.2. Market Analysis, Insights and Forecast - by Types
- 5.2.1. Below 5 KW
- 5.2.2. 5 KW-10 KW
- 5.2.3. Over 10KW
- 5.3. Market Analysis, Insights and Forecast - by Region
- 5.3.1. North America
- 5.3.2. South America
- 5.3.3. Europe
- 5.3.4. Middle East & Africa
- 5.3.5. Asia Pacific
- 5.1. Market Analysis, Insights and Forecast - by Application
- 6. North America Three-phase Hybrid PV Inverter Analysis, Insights and Forecast, 2020-2032
- 6.1. Market Analysis, Insights and Forecast - by Application
- 6.1.1. Residential System
- 6.1.2. Commercial System
- 6.2. Market Analysis, Insights and Forecast - by Types
- 6.2.1. Below 5 KW
- 6.2.2. 5 KW-10 KW
- 6.2.3. Over 10KW
- 6.1. Market Analysis, Insights and Forecast - by Application
- 7. South America Three-phase Hybrid PV Inverter Analysis, Insights and Forecast, 2020-2032
- 7.1. Market Analysis, Insights and Forecast - by Application
- 7.1.1. Residential System
- 7.1.2. Commercial System
- 7.2. Market Analysis, Insights and Forecast - by Types
- 7.2.1. Below 5 KW
- 7.2.2. 5 KW-10 KW
- 7.2.3. Over 10KW
- 7.1. Market Analysis, Insights and Forecast - by Application
- 8. Europe Three-phase Hybrid PV Inverter Analysis, Insights and Forecast, 2020-2032
- 8.1. Market Analysis, Insights and Forecast - by Application
- 8.1.1. Residential System
- 8.1.2. Commercial System
- 8.2. Market Analysis, Insights and Forecast - by Types
- 8.2.1. Below 5 KW
- 8.2.2. 5 KW-10 KW
- 8.2.3. Over 10KW
- 8.1. Market Analysis, Insights and Forecast - by Application
- 9. Middle East & Africa Three-phase Hybrid PV Inverter Analysis, Insights and Forecast, 2020-2032
- 9.1. Market Analysis, Insights and Forecast - by Application
- 9.1.1. Residential System
- 9.1.2. Commercial System
- 9.2. Market Analysis, Insights and Forecast - by Types
- 9.2.1. Below 5 KW
- 9.2.2. 5 KW-10 KW
- 9.2.3. Over 10KW
- 9.1. Market Analysis, Insights and Forecast - by Application
- 10. Asia Pacific Three-phase Hybrid PV Inverter Analysis, Insights and Forecast, 2020-2032
- 10.1. Market Analysis, Insights and Forecast - by Application
- 10.1.1. Residential System
- 10.1.2. Commercial System
- 10.2. Market Analysis, Insights and Forecast - by Types
- 10.2.1. Below 5 KW
- 10.2.2. 5 KW-10 KW
- 10.2.3. Over 10KW
- 10.1. Market Analysis, Insights and Forecast - by Application
- 11. Competitive Analysis
- 11.1. Global Market Share Analysis 2025
- 11.2. Company Profiles
- 11.2.1 Fronius
- 11.2.1.1. Overview
- 11.2.1.2. Products
- 11.2.1.3. SWOT Analysis
- 11.2.1.4. Recent Developments
- 11.2.1.5. Financials (Based on Availability)
- 11.2.2 SolarEdge
- 11.2.2.1. Overview
- 11.2.2.2. Products
- 11.2.2.3. SWOT Analysis
- 11.2.2.4. Recent Developments
- 11.2.2.5. Financials (Based on Availability)
- 11.2.3 SMA Solar Technology
- 11.2.3.1. Overview
- 11.2.3.2. Products
- 11.2.3.3. SWOT Analysis
- 11.2.3.4. Recent Developments
- 11.2.3.5. Financials (Based on Availability)
- 11.2.4 KOSTAL Solar Electric
- 11.2.4.1. Overview
- 11.2.4.2. Products
- 11.2.4.3. SWOT Analysis
- 11.2.4.4. Recent Developments
- 11.2.4.5. Financials (Based on Availability)
- 11.2.5 Imeon Energy
- 11.2.5.1. Overview
- 11.2.5.2. Products
- 11.2.5.3. SWOT Analysis
- 11.2.5.4. Recent Developments
- 11.2.5.5. Financials (Based on Availability)
- 11.2.6 Delios Srl
- 11.2.6.1. Overview
- 11.2.6.2. Products
- 11.2.6.3. SWOT Analysis
- 11.2.6.4. Recent Developments
- 11.2.6.5. Financials (Based on Availability)
- 11.2.7 HUAWEI
- 11.2.7.1. Overview
- 11.2.7.2. Products
- 11.2.7.3. SWOT Analysis
- 11.2.7.4. Recent Developments
- 11.2.7.5. Financials (Based on Availability)
- 11.2.8 Sungrow
- 11.2.8.1. Overview
- 11.2.8.2. Products
- 11.2.8.3. SWOT Analysis
- 11.2.8.4. Recent Developments
- 11.2.8.5. Financials (Based on Availability)
- 11.2.9 SolaX Power
- 11.2.9.1. Overview
- 11.2.9.2. Products
- 11.2.9.3. SWOT Analysis
- 11.2.9.4. Recent Developments
- 11.2.9.5. Financials (Based on Availability)
- 11.2.10 Redback Technologies
- 11.2.10.1. Overview
- 11.2.10.2. Products
- 11.2.10.3. SWOT Analysis
- 11.2.10.4. Recent Developments
- 11.2.10.5. Financials (Based on Availability)
- 11.2.11 GoodWe
- 11.2.11.1. Overview
- 11.2.11.2. Products
- 11.2.11.3. SWOT Analysis
- 11.2.11.4. Recent Developments
- 11.2.11.5. Financials (Based on Availability)
- 11.2.12 Ginlong Technologies
- 11.2.12.1. Overview
- 11.2.12.2. Products
- 11.2.12.3. SWOT Analysis
- 11.2.12.4. Recent Developments
- 11.2.12.5. Financials (Based on Availability)
- 11.2.13 Shenzhen Growatt New Energy
- 11.2.13.1. Overview
- 11.2.13.2. Products
- 11.2.13.3. SWOT Analysis
- 11.2.13.4. Recent Developments
- 11.2.13.5. Financials (Based on Availability)
- 11.2.14 Shenzhen Sofarsolar
- 11.2.14.1. Overview
- 11.2.14.2. Products
- 11.2.14.3. SWOT Analysis
- 11.2.14.4. Recent Developments
- 11.2.14.5. Financials (Based on Availability)
- 11.2.15 SankoPower
- 11.2.15.1. Overview
- 11.2.15.2. Products
- 11.2.15.3. SWOT Analysis
- 11.2.15.4. Recent Developments
- 11.2.15.5. Financials (Based on Availability)
- 11.2.16 Voltacon UK
- 11.2.16.1. Overview
- 11.2.16.2. Products
- 11.2.16.3. SWOT Analysis
- 11.2.16.4. Recent Developments
- 11.2.16.5. Financials (Based on Availability)
- 11.2.17 EnerTech UPS
- 11.2.17.1. Overview
- 11.2.17.2. Products
- 11.2.17.3. SWOT Analysis
- 11.2.17.4. Recent Developments
- 11.2.17.5. Financials (Based on Availability)
- 11.2.18 Xiamen Sweet Power
- 11.2.18.1. Overview
- 11.2.18.2. Products
- 11.2.18.3. SWOT Analysis
- 11.2.18.4. Recent Developments
- 11.2.18.5. Financials (Based on Availability)
- 11.2.19 NingBo Deye Inverter Technology
- 11.2.19.1. Overview
- 11.2.19.2. Products
- 11.2.19.3. SWOT Analysis
- 11.2.19.4. Recent Developments
- 11.2.19.5. Financials (Based on Availability)
- 11.2.20 Guangzhou Felicity Solar Technology
- 11.2.20.1. Overview
- 11.2.20.2. Products
- 11.2.20.3. SWOT Analysis
- 11.2.20.4. Recent Developments
- 11.2.20.5. Financials (Based on Availability)
- 11.2.21 RENAC Power
- 11.2.21.1. Overview
- 11.2.21.2. Products
- 11.2.21.3. SWOT Analysis
- 11.2.21.4. Recent Developments
- 11.2.21.5. Financials (Based on Availability)
- 11.2.1 Fronius
List of Figures
- Figure 1: Global Three-phase Hybrid PV Inverter Revenue Breakdown (million, %) by Region 2025 & 2033
- Figure 2: Global Three-phase Hybrid PV Inverter Volume Breakdown (K, %) by Region 2025 & 2033
- Figure 3: North America Three-phase Hybrid PV Inverter Revenue (million), by Application 2025 & 2033
- Figure 4: North America Three-phase Hybrid PV Inverter Volume (K), by Application 2025 & 2033
- Figure 5: North America Three-phase Hybrid PV Inverter Revenue Share (%), by Application 2025 & 2033
- Figure 6: North America Three-phase Hybrid PV Inverter Volume Share (%), by Application 2025 & 2033
- Figure 7: North America Three-phase Hybrid PV Inverter Revenue (million), by Types 2025 & 2033
- Figure 8: North America Three-phase Hybrid PV Inverter Volume (K), by Types 2025 & 2033
- Figure 9: North America Three-phase Hybrid PV Inverter Revenue Share (%), by Types 2025 & 2033
- Figure 10: North America Three-phase Hybrid PV Inverter Volume Share (%), by Types 2025 & 2033
- Figure 11: North America Three-phase Hybrid PV Inverter Revenue (million), by Country 2025 & 2033
- Figure 12: North America Three-phase Hybrid PV Inverter Volume (K), by Country 2025 & 2033
- Figure 13: North America Three-phase Hybrid PV Inverter Revenue Share (%), by Country 2025 & 2033
- Figure 14: North America Three-phase Hybrid PV Inverter Volume Share (%), by Country 2025 & 2033
- Figure 15: South America Three-phase Hybrid PV Inverter Revenue (million), by Application 2025 & 2033
- Figure 16: South America Three-phase Hybrid PV Inverter Volume (K), by Application 2025 & 2033
- Figure 17: South America Three-phase Hybrid PV Inverter Revenue Share (%), by Application 2025 & 2033
- Figure 18: South America Three-phase Hybrid PV Inverter Volume Share (%), by Application 2025 & 2033
- Figure 19: South America Three-phase Hybrid PV Inverter Revenue (million), by Types 2025 & 2033
- Figure 20: South America Three-phase Hybrid PV Inverter Volume (K), by Types 2025 & 2033
- Figure 21: South America Three-phase Hybrid PV Inverter Revenue Share (%), by Types 2025 & 2033
- Figure 22: South America Three-phase Hybrid PV Inverter Volume Share (%), by Types 2025 & 2033
- Figure 23: South America Three-phase Hybrid PV Inverter Revenue (million), by Country 2025 & 2033
- Figure 24: South America Three-phase Hybrid PV Inverter Volume (K), by Country 2025 & 2033
- Figure 25: South America Three-phase Hybrid PV Inverter Revenue Share (%), by Country 2025 & 2033
- Figure 26: South America Three-phase Hybrid PV Inverter Volume Share (%), by Country 2025 & 2033
- Figure 27: Europe Three-phase Hybrid PV Inverter Revenue (million), by Application 2025 & 2033
- Figure 28: Europe Three-phase Hybrid PV Inverter Volume (K), by Application 2025 & 2033
- Figure 29: Europe Three-phase Hybrid PV Inverter Revenue Share (%), by Application 2025 & 2033
- Figure 30: Europe Three-phase Hybrid PV Inverter Volume Share (%), by Application 2025 & 2033
- Figure 31: Europe Three-phase Hybrid PV Inverter Revenue (million), by Types 2025 & 2033
- Figure 32: Europe Three-phase Hybrid PV Inverter Volume (K), by Types 2025 & 2033
- Figure 33: Europe Three-phase Hybrid PV Inverter Revenue Share (%), by Types 2025 & 2033
- Figure 34: Europe Three-phase Hybrid PV Inverter Volume Share (%), by Types 2025 & 2033
- Figure 35: Europe Three-phase Hybrid PV Inverter Revenue (million), by Country 2025 & 2033
- Figure 36: Europe Three-phase Hybrid PV Inverter Volume (K), by Country 2025 & 2033
- Figure 37: Europe Three-phase Hybrid PV Inverter Revenue Share (%), by Country 2025 & 2033
- Figure 38: Europe Three-phase Hybrid PV Inverter Volume Share (%), by Country 2025 & 2033
- Figure 39: Middle East & Africa Three-phase Hybrid PV Inverter Revenue (million), by Application 2025 & 2033
- Figure 40: Middle East & Africa Three-phase Hybrid PV Inverter Volume (K), by Application 2025 & 2033
- Figure 41: Middle East & Africa Three-phase Hybrid PV Inverter Revenue Share (%), by Application 2025 & 2033
- Figure 42: Middle East & Africa Three-phase Hybrid PV Inverter Volume Share (%), by Application 2025 & 2033
- Figure 43: Middle East & Africa Three-phase Hybrid PV Inverter Revenue (million), by Types 2025 & 2033
- Figure 44: Middle East & Africa Three-phase Hybrid PV Inverter Volume (K), by Types 2025 & 2033
- Figure 45: Middle East & Africa Three-phase Hybrid PV Inverter Revenue Share (%), by Types 2025 & 2033
- Figure 46: Middle East & Africa Three-phase Hybrid PV Inverter Volume Share (%), by Types 2025 & 2033
- Figure 47: Middle East & Africa Three-phase Hybrid PV Inverter Revenue (million), by Country 2025 & 2033
- Figure 48: Middle East & Africa Three-phase Hybrid PV Inverter Volume (K), by Country 2025 & 2033
- Figure 49: Middle East & Africa Three-phase Hybrid PV Inverter Revenue Share (%), by Country 2025 & 2033
- Figure 50: Middle East & Africa Three-phase Hybrid PV Inverter Volume Share (%), by Country 2025 & 2033
- Figure 51: Asia Pacific Three-phase Hybrid PV Inverter Revenue (million), by Application 2025 & 2033
- Figure 52: Asia Pacific Three-phase Hybrid PV Inverter Volume (K), by Application 2025 & 2033
- Figure 53: Asia Pacific Three-phase Hybrid PV Inverter Revenue Share (%), by Application 2025 & 2033
- Figure 54: Asia Pacific Three-phase Hybrid PV Inverter Volume Share (%), by Application 2025 & 2033
- Figure 55: Asia Pacific Three-phase Hybrid PV Inverter Revenue (million), by Types 2025 & 2033
- Figure 56: Asia Pacific Three-phase Hybrid PV Inverter Volume (K), by Types 2025 & 2033
- Figure 57: Asia Pacific Three-phase Hybrid PV Inverter Revenue Share (%), by Types 2025 & 2033
- Figure 58: Asia Pacific Three-phase Hybrid PV Inverter Volume Share (%), by Types 2025 & 2033
- Figure 59: Asia Pacific Three-phase Hybrid PV Inverter Revenue (million), by Country 2025 & 2033
- Figure 60: Asia Pacific Three-phase Hybrid PV Inverter Volume (K), by Country 2025 & 2033
- Figure 61: Asia Pacific Three-phase Hybrid PV Inverter Revenue Share (%), by Country 2025 & 2033
- Figure 62: Asia Pacific Three-phase Hybrid PV Inverter Volume Share (%), by Country 2025 & 2033
List of Tables
- Table 1: Global Three-phase Hybrid PV Inverter Revenue million Forecast, by Application 2020 & 2033
- Table 2: Global Three-phase Hybrid PV Inverter Volume K Forecast, by Application 2020 & 2033
- Table 3: Global Three-phase Hybrid PV Inverter Revenue million Forecast, by Types 2020 & 2033
- Table 4: Global Three-phase Hybrid PV Inverter Volume K Forecast, by Types 2020 & 2033
- Table 5: Global Three-phase Hybrid PV Inverter Revenue million Forecast, by Region 2020 & 2033
- Table 6: Global Three-phase Hybrid PV Inverter Volume K Forecast, by Region 2020 & 2033
- Table 7: Global Three-phase Hybrid PV Inverter Revenue million Forecast, by Application 2020 & 2033
- Table 8: Global Three-phase Hybrid PV Inverter Volume K Forecast, by Application 2020 & 2033
- Table 9: Global Three-phase Hybrid PV Inverter Revenue million Forecast, by Types 2020 & 2033
- Table 10: Global Three-phase Hybrid PV Inverter Volume K Forecast, by Types 2020 & 2033
- Table 11: Global Three-phase Hybrid PV Inverter Revenue million Forecast, by Country 2020 & 2033
- Table 12: Global Three-phase Hybrid PV Inverter Volume K Forecast, by Country 2020 & 2033
- Table 13: United States Three-phase Hybrid PV Inverter Revenue (million) Forecast, by Application 2020 & 2033
- Table 14: United States Three-phase Hybrid PV Inverter Volume (K) Forecast, by Application 2020 & 2033
- Table 15: Canada Three-phase Hybrid PV Inverter Revenue (million) Forecast, by Application 2020 & 2033
- Table 16: Canada Three-phase Hybrid PV Inverter Volume (K) Forecast, by Application 2020 & 2033
- Table 17: Mexico Three-phase Hybrid PV Inverter Revenue (million) Forecast, by Application 2020 & 2033
- Table 18: Mexico Three-phase Hybrid PV Inverter Volume (K) Forecast, by Application 2020 & 2033
- Table 19: Global Three-phase Hybrid PV Inverter Revenue million Forecast, by Application 2020 & 2033
- Table 20: Global Three-phase Hybrid PV Inverter Volume K Forecast, by Application 2020 & 2033
- Table 21: Global Three-phase Hybrid PV Inverter Revenue million Forecast, by Types 2020 & 2033
- Table 22: Global Three-phase Hybrid PV Inverter Volume K Forecast, by Types 2020 & 2033
- Table 23: Global Three-phase Hybrid PV Inverter Revenue million Forecast, by Country 2020 & 2033
- Table 24: Global Three-phase Hybrid PV Inverter Volume K Forecast, by Country 2020 & 2033
- Table 25: Brazil Three-phase Hybrid PV Inverter Revenue (million) Forecast, by Application 2020 & 2033
- Table 26: Brazil Three-phase Hybrid PV Inverter Volume (K) Forecast, by Application 2020 & 2033
- Table 27: Argentina Three-phase Hybrid PV Inverter Revenue (million) Forecast, by Application 2020 & 2033
- Table 28: Argentina Three-phase Hybrid PV Inverter Volume (K) Forecast, by Application 2020 & 2033
- Table 29: Rest of South America Three-phase Hybrid PV Inverter Revenue (million) Forecast, by Application 2020 & 2033
- Table 30: Rest of South America Three-phase Hybrid PV Inverter Volume (K) Forecast, by Application 2020 & 2033
- Table 31: Global Three-phase Hybrid PV Inverter Revenue million Forecast, by Application 2020 & 2033
- Table 32: Global Three-phase Hybrid PV Inverter Volume K Forecast, by Application 2020 & 2033
- Table 33: Global Three-phase Hybrid PV Inverter Revenue million Forecast, by Types 2020 & 2033
- Table 34: Global Three-phase Hybrid PV Inverter Volume K Forecast, by Types 2020 & 2033
- Table 35: Global Three-phase Hybrid PV Inverter Revenue million Forecast, by Country 2020 & 2033
- Table 36: Global Three-phase Hybrid PV Inverter Volume K Forecast, by Country 2020 & 2033
- Table 37: United Kingdom Three-phase Hybrid PV Inverter Revenue (million) Forecast, by Application 2020 & 2033
- Table 38: United Kingdom Three-phase Hybrid PV Inverter Volume (K) Forecast, by Application 2020 & 2033
- Table 39: Germany Three-phase Hybrid PV Inverter Revenue (million) Forecast, by Application 2020 & 2033
- Table 40: Germany Three-phase Hybrid PV Inverter Volume (K) Forecast, by Application 2020 & 2033
- Table 41: France Three-phase Hybrid PV Inverter Revenue (million) Forecast, by Application 2020 & 2033
- Table 42: France Three-phase Hybrid PV Inverter Volume (K) Forecast, by Application 2020 & 2033
- Table 43: Italy Three-phase Hybrid PV Inverter Revenue (million) Forecast, by Application 2020 & 2033
- Table 44: Italy Three-phase Hybrid PV Inverter Volume (K) Forecast, by Application 2020 & 2033
- Table 45: Spain Three-phase Hybrid PV Inverter Revenue (million) Forecast, by Application 2020 & 2033
- Table 46: Spain Three-phase Hybrid PV Inverter Volume (K) Forecast, by Application 2020 & 2033
- Table 47: Russia Three-phase Hybrid PV Inverter Revenue (million) Forecast, by Application 2020 & 2033
- Table 48: Russia Three-phase Hybrid PV Inverter Volume (K) Forecast, by Application 2020 & 2033
- Table 49: Benelux Three-phase Hybrid PV Inverter Revenue (million) Forecast, by Application 2020 & 2033
- Table 50: Benelux Three-phase Hybrid PV Inverter Volume (K) Forecast, by Application 2020 & 2033
- Table 51: Nordics Three-phase Hybrid PV Inverter Revenue (million) Forecast, by Application 2020 & 2033
- Table 52: Nordics Three-phase Hybrid PV Inverter Volume (K) Forecast, by Application 2020 & 2033
- Table 53: Rest of Europe Three-phase Hybrid PV Inverter Revenue (million) Forecast, by Application 2020 & 2033
- Table 54: Rest of Europe Three-phase Hybrid PV Inverter Volume (K) Forecast, by Application 2020 & 2033
- Table 55: Global Three-phase Hybrid PV Inverter Revenue million Forecast, by Application 2020 & 2033
- Table 56: Global Three-phase Hybrid PV Inverter Volume K Forecast, by Application 2020 & 2033
- Table 57: Global Three-phase Hybrid PV Inverter Revenue million Forecast, by Types 2020 & 2033
- Table 58: Global Three-phase Hybrid PV Inverter Volume K Forecast, by Types 2020 & 2033
- Table 59: Global Three-phase Hybrid PV Inverter Revenue million Forecast, by Country 2020 & 2033
- Table 60: Global Three-phase Hybrid PV Inverter Volume K Forecast, by Country 2020 & 2033
- Table 61: Turkey Three-phase Hybrid PV Inverter Revenue (million) Forecast, by Application 2020 & 2033
- Table 62: Turkey Three-phase Hybrid PV Inverter Volume (K) Forecast, by Application 2020 & 2033
- Table 63: Israel Three-phase Hybrid PV Inverter Revenue (million) Forecast, by Application 2020 & 2033
- Table 64: Israel Three-phase Hybrid PV Inverter Volume (K) Forecast, by Application 2020 & 2033
- Table 65: GCC Three-phase Hybrid PV Inverter Revenue (million) Forecast, by Application 2020 & 2033
- Table 66: GCC Three-phase Hybrid PV Inverter Volume (K) Forecast, by Application 2020 & 2033
- Table 67: North Africa Three-phase Hybrid PV Inverter Revenue (million) Forecast, by Application 2020 & 2033
- Table 68: North Africa Three-phase Hybrid PV Inverter Volume (K) Forecast, by Application 2020 & 2033
- Table 69: South Africa Three-phase Hybrid PV Inverter Revenue (million) Forecast, by Application 2020 & 2033
- Table 70: South Africa Three-phase Hybrid PV Inverter Volume (K) Forecast, by Application 2020 & 2033
- Table 71: Rest of Middle East & Africa Three-phase Hybrid PV Inverter Revenue (million) Forecast, by Application 2020 & 2033
- Table 72: Rest of Middle East & Africa Three-phase Hybrid PV Inverter Volume (K) Forecast, by Application 2020 & 2033
- Table 73: Global Three-phase Hybrid PV Inverter Revenue million Forecast, by Application 2020 & 2033
- Table 74: Global Three-phase Hybrid PV Inverter Volume K Forecast, by Application 2020 & 2033
- Table 75: Global Three-phase Hybrid PV Inverter Revenue million Forecast, by Types 2020 & 2033
- Table 76: Global Three-phase Hybrid PV Inverter Volume K Forecast, by Types 2020 & 2033
- Table 77: Global Three-phase Hybrid PV Inverter Revenue million Forecast, by Country 2020 & 2033
- Table 78: Global Three-phase Hybrid PV Inverter Volume K Forecast, by Country 2020 & 2033
- Table 79: China Three-phase Hybrid PV Inverter Revenue (million) Forecast, by Application 2020 & 2033
- Table 80: China Three-phase Hybrid PV Inverter Volume (K) Forecast, by Application 2020 & 2033
- Table 81: India Three-phase Hybrid PV Inverter Revenue (million) Forecast, by Application 2020 & 2033
- Table 82: India Three-phase Hybrid PV Inverter Volume (K) Forecast, by Application 2020 & 2033
- Table 83: Japan Three-phase Hybrid PV Inverter Revenue (million) Forecast, by Application 2020 & 2033
- Table 84: Japan Three-phase Hybrid PV Inverter Volume (K) Forecast, by Application 2020 & 2033
- Table 85: South Korea Three-phase Hybrid PV Inverter Revenue (million) Forecast, by Application 2020 & 2033
- Table 86: South Korea Three-phase Hybrid PV Inverter Volume (K) Forecast, by Application 2020 & 2033
- Table 87: ASEAN Three-phase Hybrid PV Inverter Revenue (million) Forecast, by Application 2020 & 2033
- Table 88: ASEAN Three-phase Hybrid PV Inverter Volume (K) Forecast, by Application 2020 & 2033
- Table 89: Oceania Three-phase Hybrid PV Inverter Revenue (million) Forecast, by Application 2020 & 2033
- Table 90: Oceania Three-phase Hybrid PV Inverter Volume (K) Forecast, by Application 2020 & 2033
- Table 91: Rest of Asia Pacific Three-phase Hybrid PV Inverter Revenue (million) Forecast, by Application 2020 & 2033
- Table 92: Rest of Asia Pacific Three-phase Hybrid PV Inverter Volume (K) Forecast, by Application 2020 & 2033
Frequently Asked Questions
1. What is the projected Compound Annual Growth Rate (CAGR) of the Three-phase Hybrid PV Inverter?
The projected CAGR is approximately 8.3%.
2. Which companies are prominent players in the Three-phase Hybrid PV Inverter?
Key companies in the market include Fronius, SolarEdge, SMA Solar Technology, KOSTAL Solar Electric, Imeon Energy, Delios Srl, HUAWEI, Sungrow, SolaX Power, Redback Technologies, GoodWe, Ginlong Technologies, Shenzhen Growatt New Energy, Shenzhen Sofarsolar, SankoPower, Voltacon UK, EnerTech UPS, Xiamen Sweet Power, NingBo Deye Inverter Technology, Guangzhou Felicity Solar Technology, RENAC Power.
3. What are the main segments of the Three-phase Hybrid PV Inverter?
The market segments include Application, Types.
4. Can you provide details about the market size?
The market size is estimated to be USD 6876 million as of 2022.
5. What are some drivers contributing to market growth?
N/A
6. What are the notable trends driving market growth?
N/A
7. Are there any restraints impacting market growth?
N/A
8. Can you provide examples of recent developments in the market?
N/A
9. What pricing options are available for accessing the report?
Pricing options include single-user, multi-user, and enterprise licenses priced at USD 3950.00, USD 5925.00, and USD 7900.00 respectively.
10. Is the market size provided in terms of value or volume?
The market size is provided in terms of value, measured in million and volume, measured in K.
11. Are there any specific market keywords associated with the report?
Yes, the market keyword associated with the report is "Three-phase Hybrid PV Inverter," which aids in identifying and referencing the specific market segment covered.
12. How do I determine which pricing option suits my needs best?
The pricing options vary based on user requirements and access needs. Individual users may opt for single-user licenses, while businesses requiring broader access may choose multi-user or enterprise licenses for cost-effective access to the report.
13. Are there any additional resources or data provided in the Three-phase Hybrid PV Inverter report?
While the report offers comprehensive insights, it's advisable to review the specific contents or supplementary materials provided to ascertain if additional resources or data are available.
14. How can I stay updated on further developments or reports in the Three-phase Hybrid PV Inverter?
To stay informed about further developments, trends, and reports in the Three-phase Hybrid PV Inverter, consider subscribing to industry newsletters, following relevant companies and organizations, or regularly checking reputable industry news sources and publications.
Methodology
Step 1 - Identification of Relevant Samples Size from Population Database


Step 2 - Approaches for Defining Global Market Size (Value, Volume* & Price*)

Note*: In applicable scenarios
Step 3 - Data Sources
Primary Research
- Web Analytics
- Survey Reports
- Research Institute
- Latest Research Reports
- Opinion Leaders
Secondary Research
- Annual Reports
- White Paper
- Latest Press Release
- Industry Association
- Paid Database
- Investor Presentations

Step 4 - Data Triangulation
Involves using different sources of information in order to increase the validity of a study
These sources are likely to be stakeholders in a program - participants, other researchers, program staff, other community members, and so on.
Then we put all data in single framework & apply various statistical tools to find out the dynamic on the market.
During the analysis stage, feedback from the stakeholder groups would be compared to determine areas of agreement as well as areas of divergence